Abstract
G protein-coupled receptors (GPCRs) constitute the largest family of membrane receptors in eukaryotes. Crystal structures have provided insight into GPCR interaction with ligands and G-proteins1,2, but our understanding of the conformational dynamics of activation is incomplete. Metabotropic glutamate receptors (mGluRs) are dimeric class C GPCRs that modulate neuronal excitability, synaptic plasticity, and serve as drug targets for neurological disorders3,4. A “clamshell” ligand-binding domain (LBD), which contains the ligand binding site, is coupled to the transmembrane domain (TMD) via a cysteine rich domain, and LBD closure appears to be the first step in activation5,6. Crystal structures of isolated mGluR LBD dimers led to the suggestion that activation also involves a reorientation of the dimer interface from a “relaxed” to an “active” state7,8, but the relationship between ligand binding, LBD closure and dimer interface rearrangement in activation remains unclear. We used single-molecule fluorescence resonance energy transfer (smFRET) to probe the activation mechanism of full-length mammalian group II mGluRs. We find that the LBDs interconvert between three conformations: resting, activated and a short-lived intermediate state. Orthosteric agonists induce transitions between these conformational states with efficacy determined by occupancy of the active conformation. Unlike mGluR2, mGluR3 displays basal dynamics, which are Ca2+ dependent and lead to basal protein activation. Our results support a general mechanism for the activation of mGluRs in which agonist binding induces closure of the LBDs followed by dimer interface reorientation. Our experimental strategy should be widely applicable to study conformational dynamics in GPCRs and other membrane proteins.
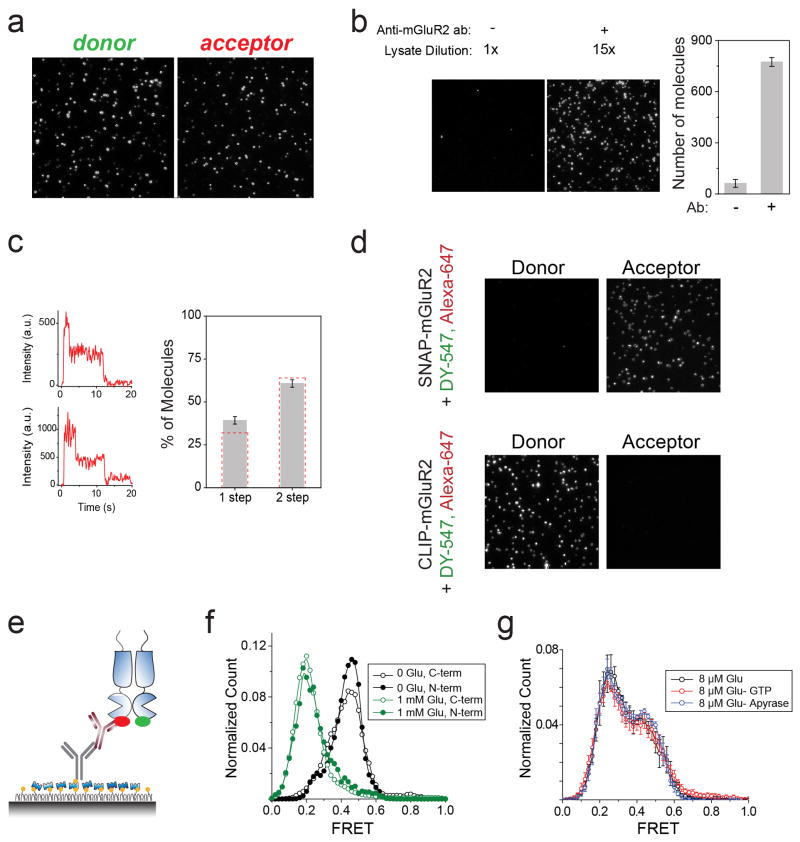
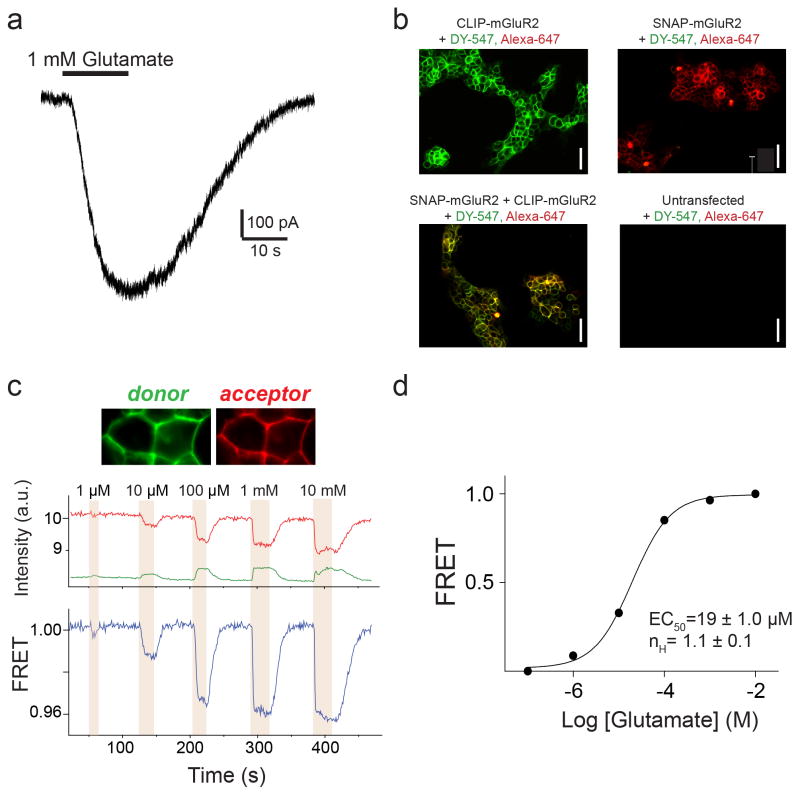
smFRET spectroscopy is a powerful tool for high-resolution probing of protein conformational change9 and was recently applied to study membrane proteins10,11,12. To visualize ligand-induced rearrangements of full-length mGluRs, we used previously described N-terminal SNAP or CLIP tagged proteins (Fig. 1a), permitting the selective and orthogonal introduction of either a FRET donor or acceptor fluorophore into each subunit of the dimer, near the LBD13,14. Electrophysiological recordings in cells co-expressing the G protein-gated inward rectifier potassium channel (GIRK) showed that these constructs were physiologically functional (Extended Data Fig. 1a). SNAP-mGluR2 and CLIP-mGluR2 were expressed in HEK293T cells and labeled with FRET donor (DY-547) and acceptor (Alexa-647) fluorophores, respectively (Methods) (Extended Data Fig. 1b). Glutamate induced a concentration-dependent decrease in ensemble FRET (Extended Data Fig. 1c, d), as previously shown15. For the smFRET assay, we used single-molecule pull-down (SiMPull)16 with an anti-C-terminal antibody for in situ immunopurification of labeled receptors from HEK293T cell lysate, followed by total internal reflection fluorescence microscopy (Fig. 1b; Extended Data Fig. 2a). The pull-down was specific, mGluR2 remained a dimer after pull-down (Extended Data Fig. 2b, c) and there was no cross labeling between SNAP and CLIP tags (Extended Data Fig 2d).
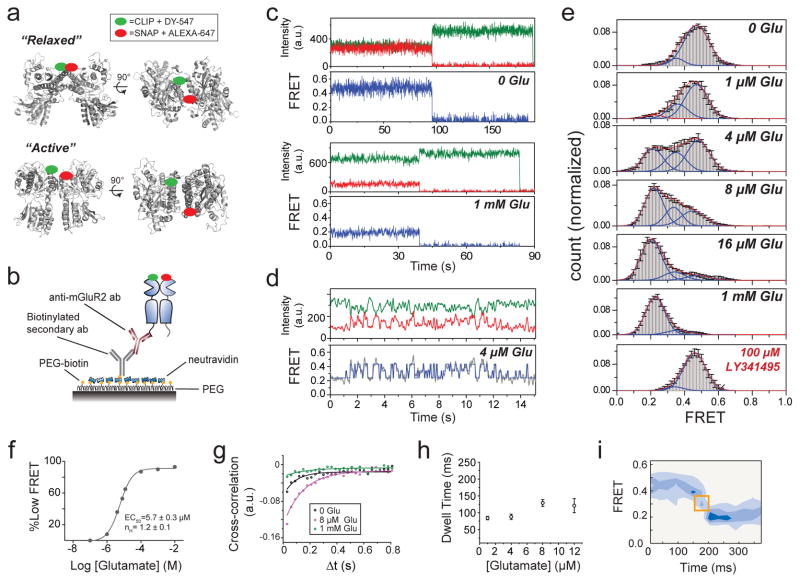
Figure 1. A single molecule FRET assay reveals three conformations of the mGluR2 activation pathway.
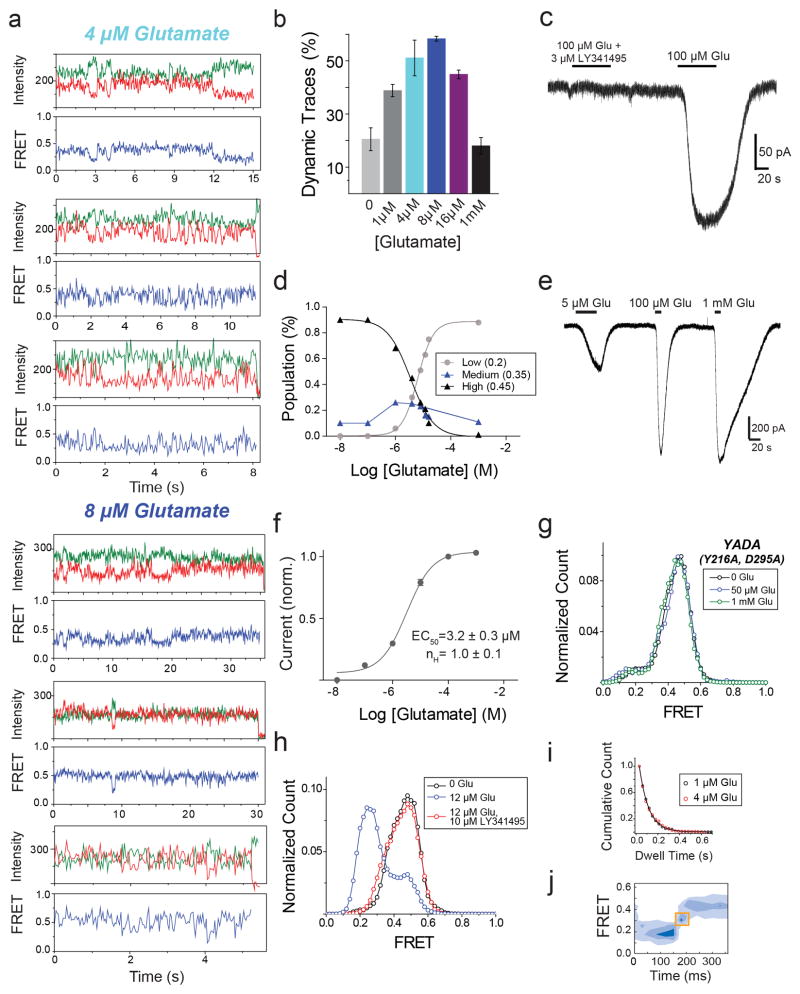
a, Crystal structures of mGluR1 in the “relaxed” (PDB ID: 1EWT) and “active” states (PDB ID: IEWK) show an increase in the distance between N-termini upon activation. Green and red ovals show the approximate positions of SNAP and CLIP tags. b, Schematic of single molecule FRET measurements. c, Donor (green) and acceptor (red) intensity time traces and FRET trace (blue) in the absence (top) or presence (bottom) of 1 mM glutamate show a decrease in FRET in the presence of saturating glutamate. d, Representative smFRET traces at 4 μM glutamate reveal rapid dynamics between 3 states. A 3 state fit obtained from Hidden Markov analysis is overlaid over the filtered raw data. e, smFRET histograms in the presence of a range of glutamate concentrations or competitive antagonist (LY341495). Blue lines show global 3-component Gaussian fits that show the high (~0.45), medium (~0.35), and low (0.2) FRET states. The sum of all 3 components is shown in red. f, Titration curve for the low FRET peak g, Cross-correlation plots show limited dynamics in the absence of glutamate (black) or in saturating glutamate (1 mM, green), but enhanced dynamics at intermediate concentrations (8 μM, magenta). h, Concentration dependence of low FRET dwell times obtained from dwell time analysis. i, FRET density plots constructed from synchronized transitions from the high to low FRET states show a short dwell at the medium FRET level (yellow box). Error bars are s.e.m.
In the absence of glutamate, smFRET efficiency was ~0.45 (Fig. 1c, top) and saturating glutamate (1 mM) shifted smFRET efficiency to ~0.2 (Fig. 1c, bottom), consistent with ensemble FRET (Extended Data Fig. 1c). Both the 0 and 1 mM glutamate states were stable within our time resolution (30 ms), with few transitions to other FRET levels. However, at intermediate glutamate concentrations, mGluR2 displayed rapid transitions between three distinct states: the 0.45 (high) FRET level seen in 0 glutamate, the 0.2 (low) FRET level seen in 1 mM glutamate, and a short-lived 0.35 (medium) FRET level (Fig. 1d, e; Extended Data Fig. 3a). The competitive antagonist LY341495 produced a similar FRET histogram to that seen in 0 glutamate: a major high FRET peak (0.45) and a minor medium FRET peak (~0.35) (Fig. 1e, bottom). About 20% of individual FRET trajectories showed visits to the low FRET state in 0 glutamate (Extended Data Figure 3b), but these transitions were rare and brief and, thus, almost undetectable in the FRET histograms (Fig. 1e, top). Control experiments with an antibody against the mGluR2 N-terminus instead of the C-terminus showed identical histograms (Extended Data Fig. 2e, f). Moreover, application of GTP or apyrase, respectively, to favor receptor association or dissociation from G proteins did not alter the smFRET histograms (Extended Data Fig. 2g), indicating that G proteins are not co-immunoprecipitated with mGluR2.
Since mGluR2 did not induce G protein signaling in 0 glutamate or in LY341495 (Extended Data Fig. 3c), we hypothesized that the high and medium FRET states represent functionally inactive conformations and that the low FRET state corresponds to the active state. Consistent with this interpretation, the low FRET state glutamate concentration-dependence had an EC50 of 5.7 ± 0.3 μM (Fig. 1f; Extended Data Fig. 3d), corresponding to the concentration-dependence of GIRK current activation in HEK293T cells (3.2 ± 0.3 μM) (Extended Data Fig. 3e). Moreover, glutamate had no effect on the FRET histogram in the glutamate-insensitive mutant mGluR2-YADA (Y216A and D295A)17 (Extended Data Fig. 3g). Finally, addition of LY341495 to glutamate abolished the low FRET state (Extended Data Fig. 3h). These observations confirm the assignment of the low FRET peak to the active conformation.
We next quantified the glutamate-induced fluctuations with cross-correlation and dwell time analyses. The cross-correlation amplitude of donor and acceptor signals increased with glutamate concentration, reaching a maximum near the EC50 and decreased at high glutamate concentrations (Fig 1g). Anti-correlation between donor and acceptor was almost abolished in saturating glutamate (1 mM), confirming the stabilization of the active state. Kinetic analysis of individual traces showed an ~84 ms active state dwell time that was nearly independent of glutamate concentration (Fig. 1h; Extended Data Figure 3i), suggesting that the active state dwell time reflects the glutamate dissociation rate and the inherent stability of the active conformation. Two-dimensional histograms obtained from synchronized transitions into or out of the low FRET state showed a short dwell at the medium FRET value of ~0.35, providing additional evidence that this state is an intermediate in the activation pathway (Fig. 1i; Extended Data Figure 3j).
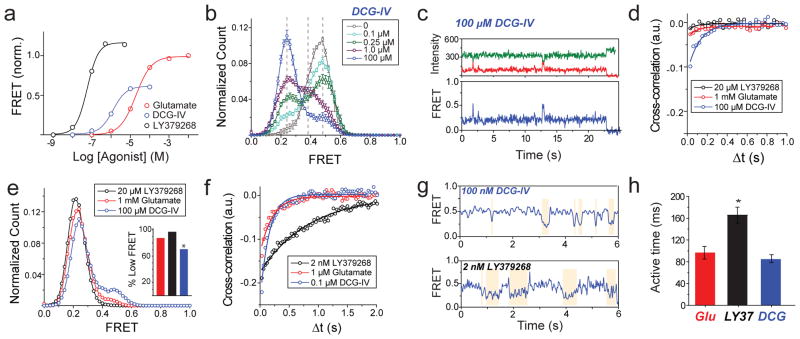
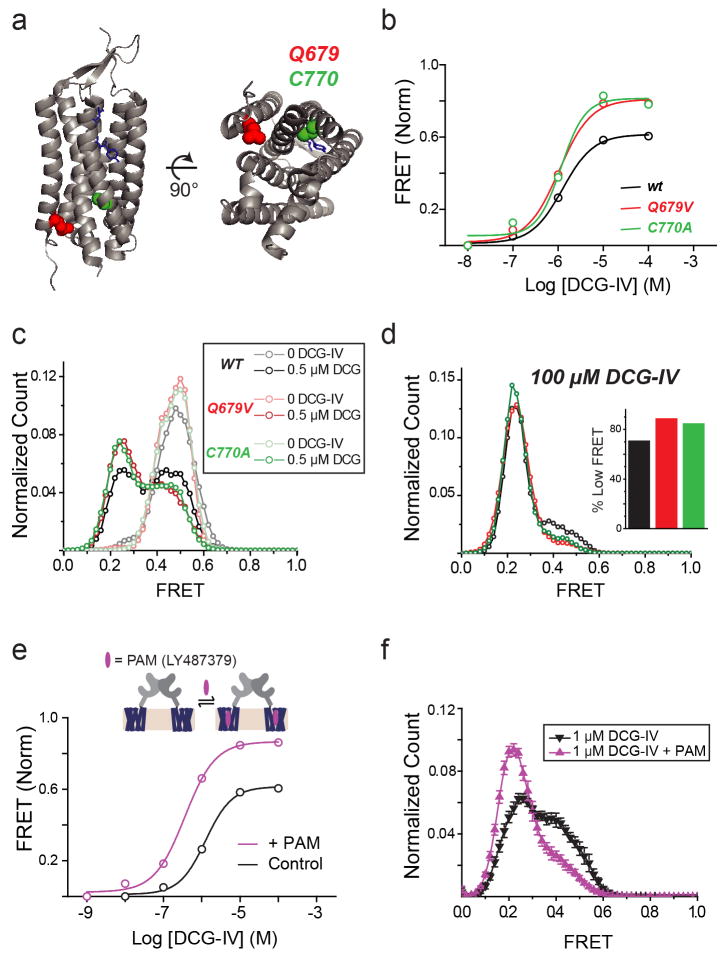
Next, we investigated the relationship between ligand efficacy and receptor conformation. We studied two group II mGluR agonists whose efficacies differ from that of glutamate (Fig. 2a)15. While DCG-IV increased the occupancy of the low FRET state, even at saturating concentrations (≥100 μM), the low FRET state was not fully occupied and ~30% of the distribution remained in the high and medium FRET states (Fig. 2b). Single molecule traces in saturating DCG-IV showed recurrent transitions out of the low FRET state (Fig. 2c, d; Extended Data Fig. 4a). In contrast, the full-agonist LY379268 populated the same three FRET states but with more complete occupancy of the active state than glutamate (Fig. 2e; Extended Data Fig. 4b, c). Consistent with these results, cross-correlation analysis showed that mGluR2 retained substantial dynamics in saturating DCG-IV, but not in saturating glutamate or LY379268 (Fig. 2d). Interestingly, at concentrations that produced comparable occupancy of the low FRET state (Extended Data Fig. 4d), cross-correlation analysis showed that LY379268 induced longer timescale fluctuations and longer active state dwell times than did glutamate and DCG-IV (Fig. 2f–h; Extended Data Fig. 4e, f). Two-dimensional histograms showed that both DCG-IV and LY379268, like glutamate, visit the medium FRET state as an intermediate during activation (Extended Data Fig. 4g, h). Thus, unlike ionotropic receptors, where the efficacy of an agonist is a function of the degree of LBD closure18, in mGluR2, agonists with different efficacies stabilize the same conformational states, with the degree of efficacy depending on the occupancy of a single active conformation. The data suggest that ligand efficacy depends more on the rate of transition into the active state than on dwell time in the active state, i.e. that agonists differ in how they induce LBD closure and subsequent reorientation. Additionally, an mGluR2-specific positive allosteric modulator, LY48739, and the TMD mutations Q679V and C770A19,20, which all increase the efficacy of DCG-IV, also increased the relative occupancy of the low FRET state (Extended Data Fig. 5), further supporting the role of active state occupancy in determining agonist efficacy and confirming that the immobilized receptors retain TMD function and coupling to the LBD.
Figure 2. Conformational basis of partial agonism of mGluR2.
a, Ensemble FRET titrations in HEK 293T cells expressing mGluR2 in the presence of glutamate (red), DCG-IV (blue) or LY379268 (black). FRET values in each condition are normalized to the response to 1 mM glutamate. b, smFRET histogram for DCG-IV shows the same 3 states as seen for glutamate (dotted lines), with dose-dependent occupancy of the low FRET state. c, Representative smFRET trace shows transitions out of the low FRET state in saturating DCG-IV. d, Cross-correlation plots for saturating agonist reveal dynamics = DCG-IV > glutamate > LY379268. e, smFRET histograms for saturating agonist; occupancy of the low FRET state = DCG-IV < glutamate < LY379268 (inset). f-g, At concentrations that result in comparable population of the active state, LY379268 induces slower dynamics than DCG-IV and glutamate as shown in cross-correlation (f) and representative smFRET traces (g). h, LY379268 induces significantly longer low FRET state dwell times than glutamate and DCG-IV (Two-tailed T-test, P=0.0084). Error bars are s.e.m.
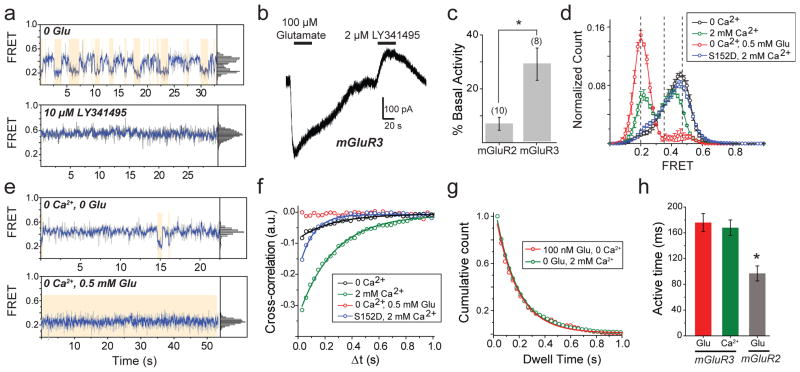
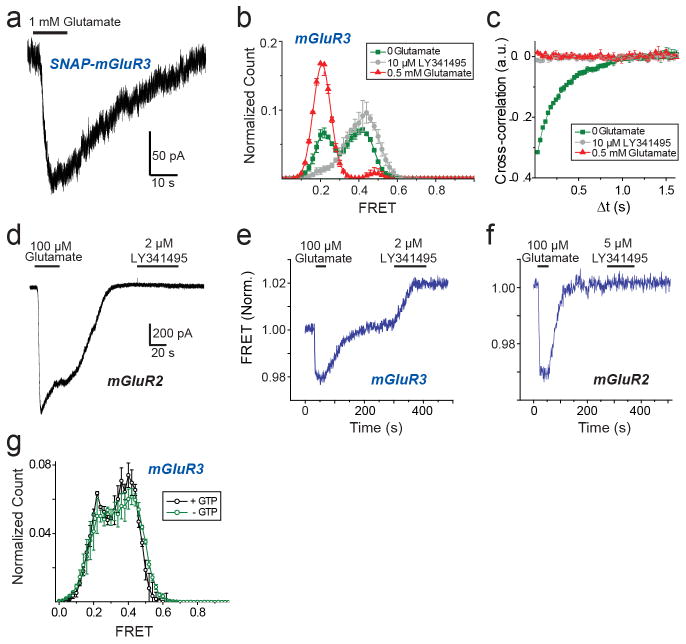
We next wondered if the properties of mGluR2 apply to other mGluRs. We turned to the other group II mGluR, mGluR3, which possesses ~70% sequence identity with mGluR2. SNAP or CLIP-tagged mGluR3 constructs were physiologically functional (Extended Data Fig. 6a) and underwent a glutamate-dependent decrease in ensemble FRET similar to mGluR2, but with a lower EC50 (0.5 ± 0.2 μM). Strikingly, single molecule trajectories of mGluR3 in 0 glutamate exhibited frequent transitions between the three FRET states (Fig. 3a, top), resulting in ~30% occupancy of the low FRET active state (Extended Data Fig. 6b, c), which was eliminated by LY341495 (Fig. 3a, bottom; Extended Data Fig. 6b, c). LY341495 produced a large decrease in glutamate-free GIRK current (Fig. 3b, c; Extended Data Fig. 6d) and ensemble FRET (Extended Data Fig. 6e, f) in cells expressing mGluR3, but not in cells expressing mGluR2, indicating that, unlike mGluR2, mGluR3 has basal activity. Importantly, the 0 glutamate smFRET distribution of mGluR3 was insensitive to GTP, indicating that the different basal activity of mGluR3 is not due to association with G protein (Extended Data Fig. 6g).
Figure 3. mGluR3 has high basal structural dynamics and activity.
a, Representative mGluR3 smFRET traces show basal dynamics in the absence of glutamate (top) that are abolished by the competitive antagonist LY341495 (bottom). b, In HEK293T cells co-expressing GIRK channels, mGluR3 has basal activity in the absence of glutamate, which is blocked by LY341495. c, Basal activity ([ILY341495]/([ILY341495] +[IGlu]) for mGluR2 and mGluR3. Values in parentheses indicate number of cells tested and * indicates significance (unpaired, two-tailed T-Test; p=0.0097). d, smFRET histograms for mGluR3 show occupancy of the low FRET state that is abolished by removal of Ca2+ or introduction of the S152D mutation. e, Representative smFRET traces for mGluR3 in the absence of Ca2+ with either 0 (top) or saturating (bottom) glutamate. f, Cross-correlation plots for mGluR3. g–h, Dwell time of the active state for mGluR3 in the presence of glutamate (100 nM) or Ca2+ (2 mM) compared to mGluR2 (4 μM glutamate) (unpaired, two-tailed T-test, p=0.00055). Error bars are s.e.m.
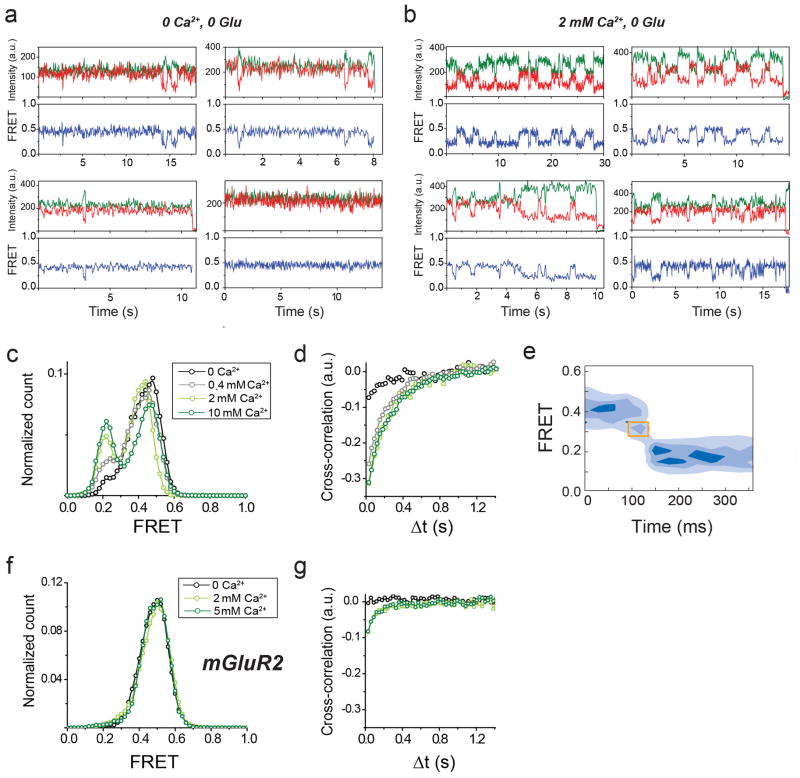
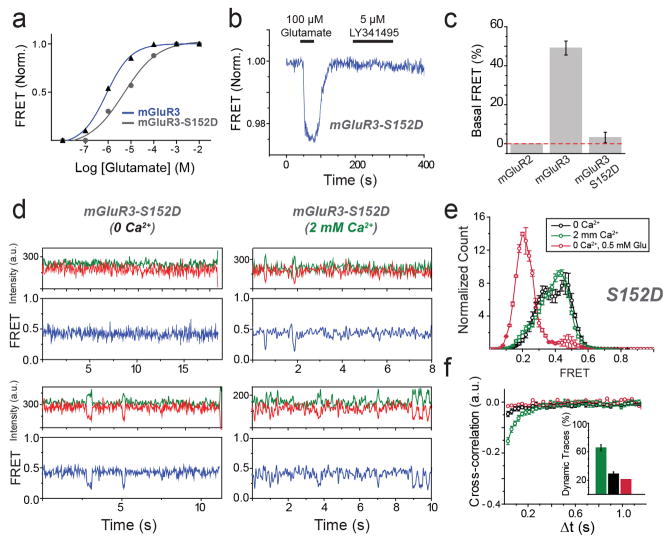
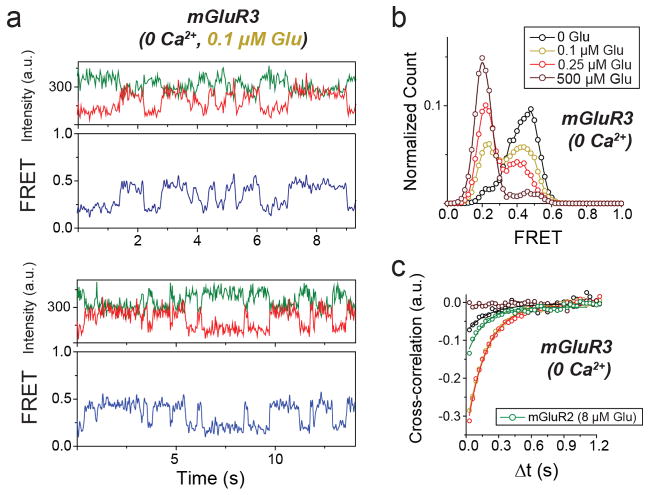
Earlier work suggested that some mGluRs, including mGluR3, but not mGluR2, are calcium-sensitive21. However direct binding of Ca2+ has been challenged and Ca2+ activity was attributed to indirect downstream signaling effects22. smFRET measurements of mGluR3 in 0 glutamate and 0 Ca2+ showed a significant reduction of basal dynamics and occupancy of the low FRET state (Fig. 3d, e; Extended Data Fig. 7a, b). In 0 glutamate we observed a Ca2+ concentration-dependent increase in low FRET state occupancy dynamics (Extended Data Fig. 7c, d). In contrast, removal of Ca2+ did not alter the smFRET properties of mGluR2 (Extended Data Fig. 7f, g). Saturating glutamate (0.5 mM) induced the same mGluR3 smFRET histogram in 0 and 2 mM Ca2+, indicating that Ca2+ is not required for full agonism of mGluR3 (Fig. 3d, e). Similar to orthosteric agonists on mGluR2, in mGluR3, Ca2+ induced transient occupancy of the intermediate FRET state (Extended Data Fig. 7e). The mutation S152D, which is reported to abolish the Ca2+ sensitivity of both mGluR1 and mGluR321, eliminated the effect of LY341495 on mGluR3 (Extended Data Fig. 8a–c), indicating elimination of basal activity. Consistent with this, smFRET analysis of mGluR3-S152D revealed a large reduction in basal low FRET population and Ca2+ sensitivity (Fig. 3d; Extended Data Fig. 8d,e) and a decrease in receptor dynamics (Fig. 3f; Extended Data Fig. 8f). Dwell time analysis of mGluR3 in the presence of 2 mM Ca2+ or 100 nM glutamate (Fig, 3g, h; Extended Data Fig. 9a, b) showed an average active state lifetime of 183 ms, significantly longer than the ~80 ms lifetime in mGluR2 (Fig. 1h), indicating that the active conformation of mGluR3 is more stable than in mGluR2. Consistent with this, the time scale of donor and acceptor cross-correlation for mGluR3 in all conditions was much slower than for mGluR2 (Extended Data Fig. 9c). Overall, smFRET measurements revealed that mGluR3 transitions between the same three FRET states as mGluR2. However, unlike mGluR2, mGluR3 is Ca2+-sensitive and therefore basally active under physiological conditions.
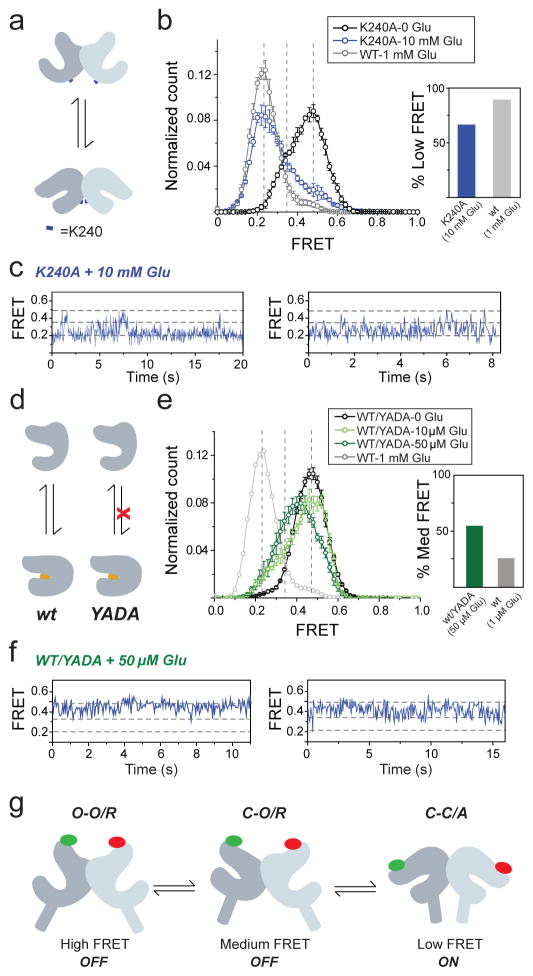
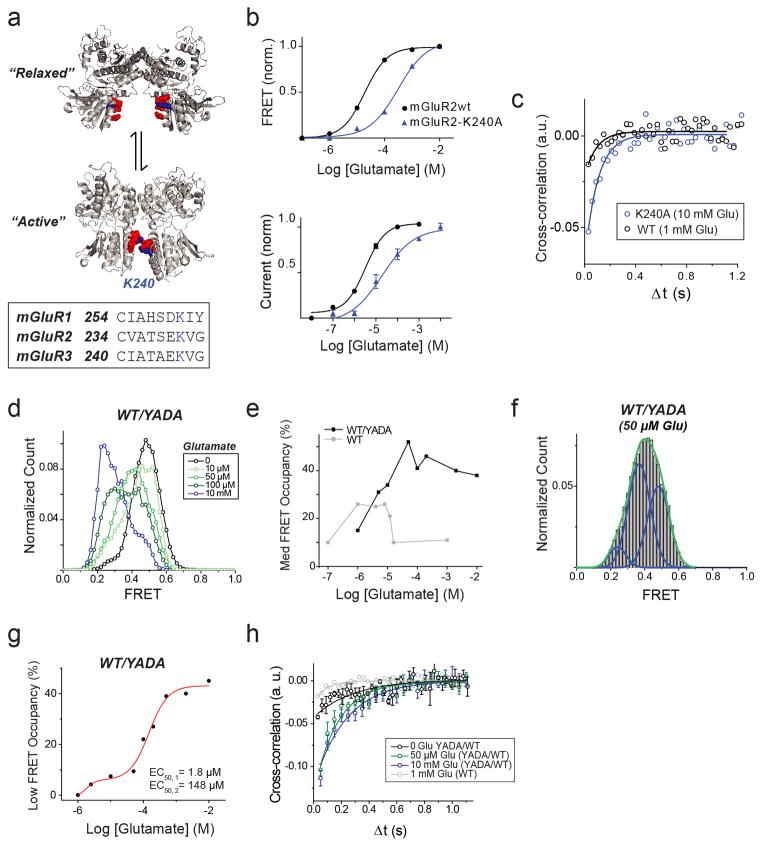
Having observed three ligand-dependent FRET states in the LBDs of both mGluR2 and mGluR3, we sought to identify the underlying conformational rearrangements in the activation pathway. The available structures of mGluR LBDs have been characterized as either “relaxed,” with the lower lobes of the LBD far apart, or “active,” with the lower lobes of the LBD closer to one other (Fig. 4a; Extended Data Fig. 10a). We hypothesized that electrostatic interactions between charged residues in the lower lobe, including a conserved lysine (K240 in mGluR2), stabilize the active conformation. Indeed, neutralizing K240 (K240A) decreased the apparent affinity for glutamate in both ensemble FRET and GIRK activation assays in cells (Extended Data Fig. 10b). In the smFRET assay, even at saturating glutamate concentrations (10 mM) this mutant populated the low FRET state less than wildtype (WT) mGluR2 (Fig. 4b). Single molecule trajectories showed frequent transitions out of the low FRET state in saturating glutamate (Fig. 4c; Extended Data Figure 10c), consistent with destabilization of the active state. These results support the idea that the lower lobes of the mGluR2 come into close proximity in the active state and help to stabilize it.
Figure 4. A three-state model of mGluR activation.
a–b, Mutation of residue K240 at the lower lobe LBD dimer interface (blue marker) (a) decreases occupancy of the low FRET state at saturating (10 mM) glutamate. (b). c, Representative smFRET traces for K240A in the presence of glutamate show transitions out of the low FRET state. d–e, Heterodimers of WT mGluR2 and the glutamate-insensitive mGluR2 (YADA) mutant (d) show enhanced occupancy of the medium FRET state (e). f, Representative smFRET traces for WT/YADA heterodimers show transitions between the high and medium FRET states with limited visits to the low FRET state. g, Three-state structural model of mGluRs based on intra-subunit (closed “C” to open “O”) and inter-subunit (relaxed “R” to active “A”) conformational changes. Error bars are s.e.m.
We next investigated the conformations corresponding to the high (0.45) and medium (0.35) FRET states. Considering the comparatively small distance change between high and medium FRET states (~4 Å) compared to medium and low FRET states (~8 Å), and the observation that the medium FRET state appears to be inactive, we hypothesized that the medium state corresponds to a “relaxed” conformation where only one LBD has closed. If this is true, an mGluR2 heterodimer composed of a WT subunit and a YADA subunit (WT/YADA) is expected to bind glutamate only in the WT LBD and therefore populate the middle FRET state more than the WT homodimer. smFRET analysis showed that at near-saturating concentrations for the WT subunit, WT/YADA had an ~55% occupancy of the medium FRET state, whereas WT/WT had a maximal medium FRET occupancy of ~25% (Fig. 4d, e; Extended Data Figure 10d–f). Unlike the mono-phasic concentration-dependence of occupancy of the low FRET state seen in WT mGluR2 (Fig. 1f), WT/YADA showed a biphasic distribution (Extended Data Figure 10g), resembling the previously reported dose-response of effector activation by the WT/YADA heterodimer of mGluR519, and supporting the assignment of the low smFRET conformation to the active state. smFRET traces at 50 μM glutamate showed numerous transitions between the high and medium FRET states with rare and brief visits to the low FRET state (Fig. 4f; Extended Data Fig. 10h), consistent with the activity of this heterodimer, and possibly due to occasional binding of glutamate to the YADA subunit or spontaneous closure of the YADA subunit in the absence of glutamate.
Our kinetic, mutational and functional analyses indicate that mGluR2 and mGluR3 undergo ligand-dependent fluctuations between three conformations: a resting and inactive O-O/R conformation, an active C-C/A conformation and an intermediate inactive short-lived C-O/R conformation (Fig. 4g). The relative instability of the intermediate conformation may explain why crystal structures have not been obtained in the C-O/R state. Electrostatic interactions at the lower lobe LBD interface stabilize the active state, suggesting that mGluR activation requires closure of both LBDs followed by rearrangement of the dimer interface (Fig. 4g) and consistent with findings that activation requires downstream reorientation at the inter-subunit interfaces between cysteine rich domains and TMDs23,24, 25,26. We observed occupancy times of tens of milliseconds to seconds—on the timescale of G protein signaling27—for both the O-O/R and C-C/A conformations. This is longer than the sub-millisecond fluctuations seen in isolated LBDs using diffusion-based FRET28, suggesting that the TMD of the intact receptor stabilizes the LBDs in the R and A states, giving the receptors a wide dynamic range of activity. Our findings suggest that the fractional occupancy of the C-C/A conformation determines agonist efficacy, consistent with isolated LBD single molecule spectroscopy28 and crystal structures, where the degree of closure is similar for full and partial agonists18,19,29. Finally, we revealed kinetic differences between mGluR2 and mGluR3 and found that mGluR3 has a more stable active state and is activated by physiological concentrations of external Ca2+, resulting in considerable basal G-protein signaling in cells. Our study provides a framework for investigating the activation mechanisms of other bi-lobed, clamshell LBDs, such as in the GABAB receptor and ionotropic neurotransmitter receptors.
Online Methods
Cell culture
HEK293T cells were cultured in DMEM with 5% FBS on poly-L-lysine-coated glass coverslips. HEK 293T cells were obtained from the UC Berkeley MCB tissue culture facility, authenticated by DDC Medical, and tested negative for mycoplasma contamination. Previously described HA-SNAP and FLAG-CLIP-tagged rat mGluR cDNA were provided by Jean-Phillipe Pin (IGF- Montpellier). DNA plasmids were transfected into cells using lipofectamine 2000 (Sigma). For electrophysiology experiments, cells were transfected with WT-mGluR2 or WT-mGluR3, GIRK1-F137S, and YFP (as a transfection marker) at a 7:7:1 ratio with 0.7 ug plasmid/well for receptor and channel. For FRET experiments, cells were transfected with SNAP and CLIP-tagged constructs at a ratio of 1:2 with 0.3 μg of SNAP-mGluR DNA/well.
Patch clamp electrophysiology
Whole-cell patch clamp recordings from single isolated cells were performed 24–48 hr after transfection in a high potassium extracellular solution containing (in mM): 120 KCl, 29 NaCl, 1 MgCl2, 2 CaCl2 and 10 HEPES, pH 7.4. Cells were voltage clamped to −60 mV using an Axopatch 200B amplifier (Axon Instruments) and membrane currents were recorded. Glass pipettes of resistance between 3 and 8 MΩ were filled with intracellular solution containing (in mM): 140 KCl, 10 HEPES, 3 Na2ATP, 0.2 Na2GTP, 5 EGTA and 3 MgCl2, pH 7.4. Data was acquired with a 2 kHz acquisition rate and filtered with the amplifier 4-pole Bessel filter at 1 kHz. Data acquisition and analysis were performed using pCLAMP 10 software (Axon Instruments).
Ensemble FRET
24–48 hrs after transfection, cells were labeled while attached to poly-L-lysine-coated coverslips. Culture media was removed and coverslips were washed and transferred to extracellular solution containing (in mM): 135 NaCl, 5.4 KCl, 2 CaCl2, 1 MgCl2, 10 HEPES, pH 7.4. Cells were labeled at 37° C with 2.5 μM benzylguanine Alexa-647 (NEB) for 45 minutes followed by 5 μM benzylcytosine DY-547 (NEB) for 45 minutes. The fluorophores were diluted in extracellular solution and coverslips were washed in between labeling with donor and acceptor. After labeling, cells were mounted on an upright, scanning confocal microscope (Zeiss LSM 780) and imaged with a 20x objective. Donor excitation was performed using a 561 nm laser and images were taken in the donor and acceptor channels at 1 Hz. Clusters of cells were analyzed together and FRET was calculated as FRET=(IAcceptor)/(IDonor +IAcceptor) where I is fluorescence intensity. For individual traces FRET was normalized to the basal FRET value observed before application of any drugs. FRET changes calculated for dose-response curves were normalized to saturating glutamate (1 mM) and dose-response curves were obtained from multiple cell clusters and averaged from at least 3 experiments. Fitting of dose-response curves was performed using Prism (Graphpad). All drugs were purchased from Tocris and delivered with a gravity-driven perfusion system.
smFRET measurements
To inhibit non-specific protein adsorption, flow cells for single-molecule experiments were prepared as previously described using mPEG (Laysan Bio) passivated glass coverslips (VWR) and doped with biotin PEG16. Prior to each experiment, coverslips were incubated with NeutrAvidin (Thermo), followed by 10 nM biotinylated secondary antibody (donkey anti-rabbit, Jackson ImmunoResearch). For receptor immunopurification either 10 nM anti-mGluR2 primary antibody (Cell Signaling, #12056) or 10 nM anti-mGluR3 antibody (abcam) or 15 nM anti-HA antibody (abcam, #ab26228) were incubated in the chamber (Fig. 1c). Between each conjugation step, the chambers were flushed to remove free reagents. The antibody dilutions and washes were done in T50 buffer (50 mM NaCl, 10 mM Tris, pH 7.5).
For single molecule experiments, fresh cells expressing tagged mGluR constructs were labeled as described above. Following labeling, cells were recovered from coverslips by incubating with Ca2+-free PBS buffer for 20–30 minutes followed by gentle pipetting. Cells were then pelleted and lysed in the lysis buffer consisting of 150 mM NaCl, 1 mM EDTA, protease inhibitor cocktail (Thermo Scientific) and 1.2% IGEPAL (Sigma) or 1% n-dodecyl-B-D-maltoside (DDM) (Anatrace). After 1 h incubation at 4° C, cells were centrifuged at 16,000 g for 20 min and supernatant was collected and kept on ice. The cell lysate was diluted to achieve sparse immobilization of labeled receptors on the surface (ranging from 5x to 50x dilution depending on the expression and labeling efficiency) and applied to coverslips. After achieving optimum surface immobilization (~400 molecules in a 2000 μm2 imaging area) unbound receptors were washed out of the flow chamber and the flow cells were then washed extensively (up to 50 X the cell volume). Finally, receptors were imaged in the imaging buffer consisting of (in mM) 3 Trolox, 120 KCl, 29 NaCl, 2 CaCl2, 1 MgCl2, 50 HEPES, 0.04% IGEPAL and an oxygen scavenging system (0.8% dextrose, 0.8 mg/mL glucose oxidase, and 0.02 mg/mL catalase), pH 7.4. Reagents were purchased from Sigma and were all UltraPure grade (purity > 99.99%). All buffers were made in UltraPure distilled water (Invitrogen). For the experiments done in the absence of Ca2+, 10 mM EGTA and 1 mM EDTA were added to the imaging buffer. Catalase was diluted in T50 buffer and passed through a spin column 3x (BioRad). To further ensure lack of glutamate contamination for the experiments done in the absence of glutamate, the oxygen scavenging solution was treated with Glutamic-Pyruvic Transaminase (Sigma) in the presence of 2 mM sodium pyruvate (Gibco) to remove possible trace levels of glutamate.
Samples were imaged with a ×60 objective (Olympus) on a total internal reflection fluorescence microscope with 30 ms time resolution unless stated otherwise. 532 nm (Cobolt) and a 632 nm (Melles Griot) lasers were used for donor or acceptor excitation. FRET efficiency was calculated as (IA − 0.1 ID)/(ID+ IA) where ID is the donor and IA is the acceptor intensity after background subtraction.
smFRET data analysis
Single molecule intensity traces showing single donor and single acceptor photobleaching with a stable total intensity for longer than 5 s were collected (20–30% of total molecules per imaging area). Individual traces were smoothed using a nonlinear filter from Haran et al30 with filter parameters: window=2, M=2 and p=15. Each experiment was repeated at least five times independently to ensure reproducibility of the results and one data set for each condition is presented. FRET histograms were compiled from at least 200 molecules per condition (30 ms time resolution). Error bars in the histograms represent the standard error from at least six independent movies. To ensure that traces with different length contribute equally, histograms from individual traces were normalized to one before compiling. Fitting to histograms was done in Origin Pro. Synchronized density plots were constructed from manually selected transitions that were synchronized to the data point where FRET signal drops below (forward transition) or above (reverse transition) the threshold of 0.3. The proportion of dynamic traces was calculated manually from the raw smFRET traces. Each molecule that exhibited at least one FRET transition (defined by anti-correlated changes in donor and acceptor signals) and lasted for at least two data points was counted as having dynamics. Dwell-time analysis was performed using unfiltered traces to avoid smoothing artifacts. First, donor and acceptor signals were each idealized to a two state signal with the value of idealized intensity obtained from the two main peaks in the intensity histogram. Idealized FRET was then calculated from idealized donor and acceptor signals and further analyzed to calculate the active state dwell-time. Due to time resolution limitations Dwell time measurement represents an upper limit estimate. All transitions were individually inspected to make sure the FRET transitions were real based on anti-correlation of the donor and acceptor intensity signals at the transition. The number of traces used in dwell-time analysis for mGlu2 with glutamate, LY379268 and DCG-IV are 53, 61 and 41 obtained from at least six independent movies and error bars represent the standard error. More than 300 transitions in each case were analyzed. The hidden Markov fit in figure 2 was done using HaMMy31. The cross-correlation32 of donor and acceptor intensity time traces at time τ is defined as CC(τ) = 〈δID(t)δIA(t + τ)〉/(〈ID(t)〉 + 〈IA(t)〉) where δID(t) = ID(t) − 〈ID(t)〉 and δIA(t) = IA(t) − 〈IA(t)〉. 〈ID(t)〉 and 〈IA(t)〉 are time average donor and acceptor intensities. The cross-correlation calculation was performed on the same traces that were used for the histogram. We fit the cross-correlation data to a single exponential function to obtain two parameters: the characteristic time of the exponential (τ) and the amplitude of the exponential.
Because of the low anisotropy of the donor and acceptor fluorophores when attached to these SNAP and CLIP tags24, and taking into account their spectral overlap, a Förster radius of 52 Å was used to estimate the distances.
Extended Data
Extended Data Figure 1. Fluorophore labeling is specific and FRET constructs are functional in HEK293T cells.
a, SNAP-mGluR2 shows glutamate-induced currents in cells co-expressing GIRK channels. b, Treatment with 2.5 μM benzylguanine Alexa-647 (for SNAP) followed by 5 μM benzylcytosine DY-547 (for CLIP) produces specific and orthogonal labeling of SNAP and CLIP-mGluR2 constructs in HEK293T cells. All conditions were imaged with identical settings in both the red (excitation=635 nm) and green (excitation=561 nm) channels. c, Ensemble FRET measurements from HEK 293T cells. Top, image of cells expressing SNAP and CLIP-mGluR2 labeled with donor (DY-547, green) and acceptor (Alexa-647, red). Bottom, representative trace showing dose-dependent, reversible decrease in FRET upon glutamate application. Glutamate was washed out between applications. d, Ensemble FRET glutamate titration in HEK293T cells. Error bars are s.e.m.
Extended Data Figure 2. Control experiments verifying specificity of the smFRET assay.
a, Representative TIRF image showing single receptors in donor and acceptor channels during donor excitation with a 532 nm laser. b, Single molecule pulldown of SNAP-mGluR2 on a passivated surface is specific. Left, representative images of individual molecules in the absence or presence of an anti-mGluR2 antibody. Right, quantification of number of molecules pulled down for each condition. c, Photobleaching step analysis shows that mGluR2 remains a dimer in SiMpull. Left, representative single molecule bleaching steps for mGluR2-GFP. Right, histogram of bleaching step counts for all molecules. Dotted red line shows the predicted proportions for an 80% GFP maturation rate. d, Pulldown of lysate from cells expressing only SNAP-mGluR2 (c) or only CLIP-mGluR2 (d), and labeled with both donor and acceptor fluorophores confirms labeling specificity at the single molecule level. e–f, Pulldown of SNAP- and CLIP-mGluR2 via an antibody against an N-terminal HA-tag (e) leads to very similar smFRET histograms (f, full circles) in the absence (black) or presence of 1 mM glutamate (green) compared to pulldown with a C-terminal antibody (f, open circles). g, Application of either GTP, to remove any co-assembled G proteins, or apyrase, to lock any G proteins onto mGluR2, does not alter smFRET histograms.
Extended Data Figure 3. Further analysis of glutamate-induced smFRET and functional properties of mGluR2.
a, Representative smFRET traces for mGluR2 in the presence of 4 μM or 8 μM glutamate. b, Quantification of the percentage of single molecule traces showing at least one transition to the active state at different glutamate concentrations c, In HEK293T cells co-expressing mGluR2 and GIRK, LY341495 prevents glutamate-induced inward currents without altering the baseline current. d, Glutamate titration curves produced from fitting FRET histograms to the sum of 3 Gaussian distributions. e–f, Glutamate induces inward currents via mGluR2 in a dose-dependent manner (n=9 cells). g, The glutamate-insensitive mGluR2-YADA (Y216A, D295A) shows no smFRET response to 50 μM or 1mM glutamate. h, smFRET histograms showing that application of the competitive antagonist LY341495 reverses the FRET change induced by glutamate. i, Dwell time analysis of mGluR2 for sub-saturating glutamate concentrations. j, FRET density plots constructed from synchronized transitions from the low to high FRET states show a short dwell at the medium FRET level (yellow box). Error bars are s.e.m.
Extended Data Figure 4. Further analysis of the effects of orthosteric agonists on mGluR2 smFRET.
a, Cross-correlation plot for mGluR2 in the presence of DCG-IV shows concentration dependent dynamics. b–c, smFRET histogram (b) and cross-correlation plots (c) for mGluR2 in the presence of the full agonist LY379268. d, smFRET histograms in the presence of 1μM glutamate, 100 nM DCG-IV and 2 nM LY379268 yields comparable occupancy of the active state. e–f, representative smFRET traces for mGluR2 in the presence of 0.1μM DCG-IV (e) or 2nM LY379268 (f) which are the concentrations used for dwell time analysis. g–h, FRET density plots constructed from the average transitions from the low to high states show a short dwell at the medium FRET level (yellow boxes) for mGluR2 in the presence of DCG-IV (g) or LY379268 (h).
Extended Data Figure 5. TMD mutations that introduce basal activity and a positive allosteric modulator increase the affinity and efficacy of a partial agonist.
a, Crystal structures of the mGluR1 TMD bound to a NAM (PDB ID: 4OR2) showing the location of conserved residues in TM4 and TM6 previously shown to be sensitive to mutations that induce basal activity. b, Ensemble FRET titrations showing that mutations Q679V and C770A increase the affinity and efficacy of DCG-IV compared to mGluR2wt. c–d, smFRET histograms for TMD mutants show population of the same 3 FRET states as wt, but with greater occupation of the low FRET state at either sub-saturating (c) or saturating (d) concentrations of DCG-IV. e, Binding of PAM LY487379 to the TMD of mGluR2 (top) increases the apparent affinity and efficacy of DCG-IV in ensemble FRET measurements in HEK 293T cells. All values were normalized to the response to 1 mM glutamate. b, smFRET histograms showing a LY487379 -induced shift in the response to 1 μM DCG-IV. Error bars are s.e.m.
Extended Data Figure 6. Characterization of basic ensemble and smFRET properties of mGluR3 as compared to mGluR2.
a, Activation of GIRK by SNAP-mGluR3 in HEK293T cells. b, smFRET histograms for mGluR3 show glutamate-independent low FRET population. c, Cross-correlation plots for mGluR3 show glutamate-independent dynamics. d, Unlike mGluR3, mGluR2 shows zero or minimal current response to the antagonist LY341495 in the absence of glutamate. e–f, Ensemble FRET in HEK293T cells shows a robust antagonist LY341495-induced FRET increase in mGluR3 (e) but not in mGluR2 (f). g, smFRET histograms for mGluR3 with or without GTP treatment to dissociate any G proteins that may be coupled to the receptor. The time resolution for this data is 100 ms. Error bars are s.e.m.
Extended Data Figure 7. Calcium sensitivity of mGluR3.
a–b, Representative smFRET traces for mGluR3 in the absence (a) or presence (b) of 2 mM Ca2+. c, smFRET histograms for mGluR3 in the presence of various concentrations of calcium. d, Cross-correlation plots for mGluR3 in the presence of various concentrations of calcium. e, FRET density plot for showing that Ca2+ induced synchronized transitions show a similar intermediate in mGluR3, as observed in mGluR2. f–g, smFRET histograms (f) and cross-correlation plots (g) for mGluR2 in the presence of various concentrations of calcium.
Extended Data Figure 8. mGluR3-S152D shows decreased basal FRET and calcium sensitivity.
a, Ensemble FRET glutamate titrations for mGluR3 and mGluR3-S152D. b, Representative ensemble FRET trace for mGluR3-S152D shows no response to LY341495. c, Summary of basal FRET for mGluR3, mGluR2, and mGluR3-S152D. Basal FRET=[ΔFRETLY341495]/([ΔFRETLY341495] +[ΔFRETGlu]). d, Representative smFRET traces for mGluR3-S152D in the absence (left) or presence (right) of 2 mM Ca2+. e, smFRET histograms for mGluR3-S152D in the absence or presence of Ca2+ or saturating glutamate. f, Cross-correlation plots for mGluR3-S152D. Inset shows the percentage of traces showing dynamics in different ligand conditions. Error bars are s.e.m.
Extended Data Figure 9. Glutamate induced smFRET dynamics of mGluR3 in the absence of calcium.
a, Representative smFRET traces for mGluR3 in the absence of Ca2+ and the presence of sub-saturating glutamate. b, smFRET Histogram showing dose-dependent response of mGluR3 to glutamate in the absence of Ca2+. c, Cross-correlation plots showing glutamate-induced smFRET dynamics. mGluR2 (green) at its maximum dynamics shows a smaller cross-correlation amplitude compared to mGluR3.
Extended Data Figure 10. Further characterization of mGluR2-K240A and WT/YADA heterodimers.
a, Crystal structures of mGluR1 in the “relaxed” (top; PDB ID: 1EWT) and “active” states (bottom; PDB ID: IEWK) show a reorientation of the dimer interface that brings charged residues of the lower lobe in close proximity. Conserved negatively charged residues are shown in red and K260 (K240 in mGluR2) is shown in blue. b, Glutamate titrations show a decreased apparent affinity for mGluR2-K240A in ensemble FRET (top) and GIRK current activation (bottom). c, Cross-correlation plots in the presence of saturating glutamate show increased dynamics for mGluR2-K240A relative to wild type. d, smFRET histogram showing distributions for WT/YADA heterodimers at a range of glutamate concentrations. e, Concentration-dependence of low FRET population in WT/YADA heterodimers produced from fitting FRET histograms to the sum of 3 Gaussian distributions. The EC50 for each phase of the distribution is shown. g, Concentration-dependence of medium FRET population in WT/YADA heterodimers and WT homodimers produced from fitting FRET histograms to the sum of 3 Gaussian distributions. g, 3-state fit to FRET histogram for WT/YADA heterodimers in the presence of 100 μM glutamate shows substantial population of the medium FRET (0.35) peak. h, Cross-correlation plots for WT/YADA heterodimers. Error bars are s.e.m.
Acknowledgments
We thank Zhu Fu and Hitomi Okada for technical assistance, Jean Philippe Pin for generously providing the SNAP and CLIP tagged mGluRs and advice on their properties, and Jean Philippe Pin, Emmanuel Margeat, Pierre Rondard, Ankur Jain, Andreas Reiner and members of the Isacoff lab for helpful discussions. Funding was provided by the National Institutes of Health Nanomedicine Development Center for the Optical Control of Biological Function (2PN2EY018241) and the National Science Foundation (EAGER: IOS-1451027). R.V. is a Merck fellow of the Life Science Research Foundation.
Footnotes
Author Contributions
R.V., J.L., and E.I. designed the research. R.V. set up, performed and analyzed single molecule FRET experiments. J.L. performed and analyzed ensemble FRET and electrophysiology experiments and contributed to single molecule FRET experiments. R.V., J.L., and E.I. wrote the paper.
References
- 1.Rasmussen SG, et al. Crystal structure of the beta2 adrenergic receptor-Gs protein complex. Nature. 2011;477:549–555. doi: 10.1038/nature10361. [DOI] [PMC free article] [PubMed] [Google Scholar]
- 2.Katritch V, Cherezov V, Stevens RC. Structure-function of the G protein-coupled receptor superfamily. Annu Rev Pharmacol Toxicol. 2013;53:531–556. doi: 10.1146/annurev-pharmtox-032112-135923. [DOI] [PMC free article] [PubMed] [Google Scholar]
- 3.Conn PJ, Pin JP. Pharmacology and functions of metabotropic glutamate receptors. Annu Rev Pharmacol Toxicol. 1997;37:205–237. doi: 10.1146/annurev.pharmtox.37.1.205. [DOI] [PubMed] [Google Scholar]
- 4.Niswender CM, Conn PJ. Metabotropic glutamate receptors: physiology, pharmacology, and disease. Annu Rev Pharmacol Toxicol. 2010;50:295–322. doi: 10.1146/annurev.pharmtox.011008.145533. [DOI] [PMC free article] [PubMed] [Google Scholar]
- 5.Kniazeff J, et al. Locking the dimeric GABA(B) G-protein-coupled receptor in its active state. J Neurosci. 2004;24:370–377. doi: 10.1523/JNEUROSCI.3141-03.2004. [DOI] [PMC free article] [PubMed] [Google Scholar]
- 6.Kumar J, Mayer ML. Functional insights from glutamate receptor ion channel structures. Annu Rev Physiol. 2013;75:313–337. doi: 10.1146/annurev-physiol-030212-183711. [DOI] [PMC free article] [PubMed] [Google Scholar]
- 7.Kunishima N, et al. Structural basis of glutamate recognition by a dimeric metabotropic glutamate receptor. Nature. 2000;407:971–977. doi: 10.1038/35039564. [DOI] [PubMed] [Google Scholar]
- 8.Tsuchiya D, Kunishima N, Kamiya N, Jingami H, Morikawa K. Structural views of the ligand-binding cores of a metabotropic glutamate receptor complexed with an antagonist and both glutamate and Gd3+ Proc Natl Acad Sci U S A. 2002;99:2660–2665. doi: 10.1073/pnas.052708599. [DOI] [PMC free article] [PubMed] [Google Scholar]
- 9.Roy R, Hohng S, Ha T. A practical guide to single-molecule FRET. Nat Methods. 2008;5:507–516. doi: 10.1038/nmeth.1208. [DOI] [PMC free article] [PubMed] [Google Scholar]
- 10.Zhao Y, et al. Single-molecule dynamics of gating in a neurotransmitter transporter homologue. Nature. 2010;465:188–193. doi: 10.1038/nature09057. [DOI] [PMC free article] [PubMed] [Google Scholar]
- 11.Bockenhauer S, Furstenberg A, Yao XJ, Kobilka BK, Moerner WE. Conformational dynamics of single G protein-coupled receptors in solution. J Phys Chem B. 2011;115:13328–13338. doi: 10.1021/jp204843r. [DOI] [PMC free article] [PubMed] [Google Scholar]
- 12.Morrison EA, et al. Antiparallel EmrE exports drugs by exchanging between asymmetric structures. Nature. 2012;481:45–50. doi: 10.1038/nature10703. [DOI] [PMC free article] [PubMed] [Google Scholar]
- 13.Keppler A, et al. A general method for the covalent labeling of fusion proteins with small molecules in vivo. Nat Biotechnol. 2003;21:86–89. doi: 10.1038/nbt765. [DOI] [PubMed] [Google Scholar]
- 14.Doumazane E, et al. A new approach to analyze cell surface protein complexes reveals specific heterodimeric metabotropic glutamate receptors. FASEB J. 2011;25:66–77. doi: 10.1096/fj.10-163147. [DOI] [PubMed] [Google Scholar]
- 15.Doumazane E, et al. Illuminating the activation mechanisms and allosteric properties of metabotropic glutamate receptors. Proc Natl Acad Sci U S A. 2013;110:E1416–1425. doi: 10.1073/pnas.1215615110. [DOI] [PMC free article] [PubMed] [Google Scholar]
- 16.Jain A, et al. Probing cellular protein complexes using single-molecule pull-down. Nature. 2011;473:484–488. doi: 10.1038/nature10016. [DOI] [PMC free article] [PubMed] [Google Scholar]
- 17.Kniazeff J, et al. Closed state of both binding domains of homodimeric mGlu receptors is required for full activity. Nat Struct Mol Biol. 2004;11:706–713. doi: 10.1038/nsmb794. [DOI] [PubMed] [Google Scholar]
- 18.Jin R, Banke TG, Mayer ML, Traynelis SF, Gouaux E. Structural basis for partial agonist action at ionotropic glutamate receptors. Nat Neurosci. 2003;6:803–810. doi: 10.1038/nn1091. [DOI] [PubMed] [Google Scholar]
- 19.Yamashita T, Kai T, Terakita A, Shichida Y. A novel constitutively active mutation in the second cytoplasmic loop of metabotropic glutamate receptor. J Neurochem. 2004;91:484–492. doi: 10.1111/j.1471-4159.2004.02739.x. [DOI] [PubMed] [Google Scholar]
- 20.Yanagawa M, Yamashita T, Shichida Y. Activation switch in the transmembrane domain of metabotropic glutamate receptor. Mol Pharmacol. 2009;76:201–207. doi: 10.1124/mol.109.056549. [DOI] [PubMed] [Google Scholar]
- 21.Kubo Y, Miyashita T, Murata Y. Structural basis for a Ca2+-sensing function of the metabotropic glutamate receptors. Science. 1998;279:1722–1725. doi: 10.1126/science.279.5357.1722. [DOI] [PubMed] [Google Scholar]
- 22.Nash MS, Saunders R, Young KW, Challiss RA, Nahorski SR. Reassessment of the Ca2+ sensing property of a type I metabotropic glutamate receptor by simultaneous measurement of inositol 1,4,5-trisphosphate and Ca2+ in single cells. J Biol Chem. 2001;276:19286–19293. doi: 10.1074/jbc.M007600200. [DOI] [PubMed] [Google Scholar]
- 23.Tateyama M, Abe H, Nakata H, Saito O, Kubo Y. Ligand-induced rearrangement of the dimeric metabotropic glutamate receptor 1alpha. Nat Struct Mol Biol. 2004;11:637–642. doi: 10.1038/nsmb770. [DOI] [PubMed] [Google Scholar]
- 24.Huang S, et al. Interdomain movements in metabotropic glutamate receptor activation. Proc Natl Acad Sci U S A. 2011;108:15480–15485. doi: 10.1073/pnas.1107775108. [DOI] [PMC free article] [PubMed] [Google Scholar]
- 25.Hlavackova V, et al. Sequential inter- and intrasubunit rearrangements during activation of dimeric metabotropic glutamate receptor 1. Sci Signal. 2012;5:ra59. doi: 10.1126/scisignal.2002720. [DOI] [PubMed] [Google Scholar]
- 26.Xue L, et al. Major ligand-induced rearrangement of the heptahelical domain interface in a GPCR dimer. Nat Chem Biol. 2015;11:134–140. doi: 10.1038/nchembio.1711. [DOI] [PubMed] [Google Scholar]
- 27.Lohse MJ, Maiellaro I, Calebiro D. Kinetics and mechanism of G protein-coupled receptor activation. Curr Opin Cell Biol. 2014;27:87–93. doi: 10.1016/j.ceb.2013.11.009. [DOI] [PubMed] [Google Scholar]
- 28.Olofsson L, et al. Fine tuning of sub-millisecond conformational dynamics controls metabotropic glutamate receptors agonist efficacy. Nat Commun. 2014;5:5206. doi: 10.1038/ncomms6206. [DOI] [PubMed] [Google Scholar]
- 29.Muto T, Tsuchiya D, Morikawa K, Jingami H. Structures of the extracellular regions of the group II/III metabotropic glutamate receptors. Proc Natl Acad Sci U S A. 2007;104:3759–3764. doi: 10.1073/pnas.0611577104. [DOI] [PMC free article] [PubMed] [Google Scholar]
- 30.Haran G. Noise reduction in single-molecule fluorescence trajectories of folding proteins. Chem Phys. 2004;307:137–145. [Google Scholar]
- 31.McKinney SA, Joo C, Ha T. Analysis of single-molecule FRET trajectories using hidden Markov modeling. Biophys J. 2006;91:1941–1951. doi: 10.1529/biophysj.106.082487. [DOI] [PMC free article] [PubMed] [Google Scholar]
- 32.Zhou R, et al. SSB functions as a sliding platform that migrates on DNA via reptation. Cell. 2011;146:222–232. doi: 10.1016/j.cell.2011.06.036. [DOI] [PMC free article] [PubMed] [Google Scholar]


