

Abstract
This study studies in detail the settlement patterns of blacks in the urban North from before the Great Migration and through 1940, focusing on the cases of New York and Chicago. It relies on new and rarely used data sources, including census geocoded microdata from the 1880 census (allowing segregation patterns and processes to be studied at any geographic scale) and census data for 1900–1940 aggregated to enumeration districts (EDs). It is shown that blacks were unusually highly isolated in 1880 given their small share of the total population and that segregation reached high levels in both cities earlier than previously reported. Regarding sources of racial separation, neither higher class standing nor Northern birth had much effect on whether blacks lived within or outside black neighborhoods in 1880 or 1940, and it is concluded that the processes that created large black ghettos were already in place several decades before 1940.
Studies of black-white segregation in the early 20th Century are mostly concerned with the phenomenon of creation of black ghettos in Northern cities. One common view is that before the Great Migration blacks in the urban North did not experience the segregating processes that later became common. In this view a new neighborhood form was constructed after the First World War, as a result of the initial influx of black migration, re-emergent white racism, restrictive covenants and redlining spearheaded by government agencies. This perspective is stated most directly by Massey and Denton (1993, p.17): “There was a time, before 1900, when blacks and whites lived side by side in American cities. In the north, a small native black population was scattered widely throughout white neighborhoods … In this lost urban world, blacks were more likely to share a neighborhood with whites than with other blacks… No matter what other disadvantages urban blacks suffered in the aftermath of the Civil War, they were not residentially segregated from whites.” A similar interpretation is offered by Cutler, Glaeser, and Vigdor (1999, p. 456), who find that “1890 to 1940 saw the birth of the ghetto … Where only one city had a ghetto by our definition in 1890 (Norfolk, Va.), 55 cities had a ghetto by 1940.” Flamming’s (2006) study of black Los Angeles describes the trend from a historian’s perspective: The “quieter” migration of the better educated and more ambitious African Americans during 1890–1915 “filtered into small, loosely knit communities that were, in large part, middle class …There was some racial segregation, but there were no black ghettos to speak of” (2006, p. 45). But following World War I, provoked by the first wave of the Great Migration, whites panicked: “They erected residential boundaries, through violence and law … thereby penning the migrants into black-only districts that proved to be embryonic ghettos” (2006, p. 46).
Some historians, notably Philpott (1978), argue that distinctive features of the black ghetto were present even before the Great Migration, and this study offers new support for that view. We base our evaluation on two key criteria. The first is the sheer level of segregation across residential areas of cities. To what degree and at what spatial scale were blacks segregated from whites? We show that black-white segregation in major northern cities was substantial even in 1880 when we take into account its actual spatial scale at that time. The second is the locational process resulting in segregated patterns. Specifically how did variation in social class standing among blacks affect their residential outcome? We examine how race combined with other background factors, especially social class, to place blacks in particular locations within cities. We show that having higher class standing was no more associated with living outside of identifiable black neighborhoods in 1880 than in 1940, but that class differentiation within black neighborhoods had appeared already in 1880.
Discussion of the black ghetto is heavily influenced by the great size and racial isolation of places like Harlem or South Side of Chicago in the 1940s and 1950s. Such places of course could not have existed prior to the Great Migration, when Northern cities were so overwhelmingly white. If the ghetto by definition is a large section of a city that is almost exclusively populated by people of one race, then there were no Northern city ghettos before World War I. To avoid debate over terminology, we refer to the black neighborhoods that we find at an earlier time as ghettos in formation, or emergent ghettos.1 But we will argue that they were ghettos, nonetheless, by the criteria that we examine. We proceed as follows. First we present and defend the criteria by which we evaluate the New York and Chicago cases, arguing that the process of segregation is as relevant as the outcome and emphasizing that the spatial scale of segregation is different in contexts with very large or very small minority populations. We then present findings on our two main research questions for the period between 1880 and 1940: 1) to what degree and at what spatial scale were blacks segregated from whites and 2) how did variation in social class standing among blacks affect their residential outcome?
I. Segregation as a process
There is a considerable literature on both criteria that we use to examine segregation. Let us consider first the conceptual question of why blacks live separately from whites. To what extent is segregation the result of the processes of racial exclusion that for some scholars distinguishes the ghetto from other types of residential enclaves (Marcuse 1997)? For example, in the theoretical model of spatial assimilation that has often been applied to white ethnic groups (Massey 1985) immigrants’ ethnic neighborhoods mainly arise from their residents’ limited market resources and ethnically bound cultural and social capital. But these are transitional neighborhoods, and they represent only a practical and temporary phase in the incorporation of new groups into mainstream society. Their residents search for areas with more amenities as soon as their economic situations improve, their outlooks broaden, and they learn to navigate daily life in a more mainstream setting. Ethnic minority zones are left behind by immigrants with more experience and by the second generation. Separate ethnic neighborhoods in this context have been called ‘immigrant enclaves’ to emphasize their function as springboards for future mobility, in contrast to the ghetto that tends to be an absorbing state (Logan et al. 2002). A test of the process of spatial assimilation, therefore, is the extent to which residential mobility flows from increasing socioeconomic standing or to the difference between newcomers and those raised in the local area.
The situation of African Americans has been treated as an exceptional case from this perspective, since numerous studies over the years demonstrate that more affluent blacks do not live in neighborhoods comparable to their white peers. Another point of view is offered by the place stratification model (Logan and Molotch 1987) which posits that the urban development process is heavily influenced by collective efforts to create and defend spatial privilege, resulting in a fairly rigid hierarchy of places. Whatever the effective social boundaries in a given society, whether by race, nativity, national origin, religion, or class, the hierarchy of social groups is likely to be reproduced in the composition of advantaged vs disadvantaged places. Hence the historical black ghetto was not an exception but an illustration of normal processes, and although locational outcomes are likely to vary with individuals’ human capital and housing preferences, it should not be expected that people of different groups will necessarily live in comparable places as their peers in other groups. For example much contemporary research shows that blacks are less likely than comparable whites to escape poor neighborhoods (South and Crowder 1997).
The location of the black middle class is an important element in evaluating the place stratification perspective. Wilson (1987) famously linked the problems of the contemporary inner city underclass neighborhood to the abandonment of those neighborhoods by newly mobile blacks in the stable working class and middle class. Recent discussions of the black ghetto now take for granted that it is defined not only by racial composition but also by concentrated poverty (see, for example, Small 2008). Some scholars emphasize that there remain barriers to residential mobility by middle class blacks who have left these inner city areas (Alba, Logan and Stults 2000). Yet to the extent that upwardly mobile blacks now live in more racially integrated neighborhoods and in communities that mirror their own class standing, this would represent a fundamental weakening of segregating processes and a marked contrast with the situation of the mid-20th Century.
Unlike today, the ghetto sixty or more years ago was generally understood to include blacks of all social classes. Summarizing research on the 1930s and 1940s (see, for example Frazier [1937] on Harlem and Duncan and Duncan [1957, pp. 237–98] on Chicago), Massey and Denton report that the relatively modest black middle class tended to move toward the edge of the black settlement area, where they were eventually followed by other blacks, but not beyond it. This dynamic process led to “a distinct class gradient in the ghetto, with the poorest families being concentrated toward the center … and the middle and upper classes progressively increasing their share of the population as one moved from the core toward the periphery” (1993, p. 39). When the black middle class became trapped in black neighborhoods and their mobility was expressed through living in the better parts of those neighborhoods is a marker for the emergence of the ghetto as it existed in the mid-20th Century.
When did these phenomena appear? Massey and Denton argue that it was only as the ghetto was being created in the early 20th Century that “[w]ell-educated middle-class blacks of the old elite found themselves increasingly lumped together with poorly educated, impoverished migrants from the rural south; and well-to-do African Americans were progressively less able to find housing commensurate with their social status” (1993, p. 30). Other researchers offer a less sanguine view of the situation before the Great Migration. One study of Chicago (Philpott 1978) contrasted the black ghetto with the ethnic slum mainly by the observation that the slum could be escaped while the ghetto could not. Philpott cited early work by Comstock (1912, p. 255), who concluded that “[t]he strong prejudice among the white people against having colored people living on white residence streets, colored children attending schools with white children, or entering into other semi-social relations with them, confines the opportunities for residence open to colored people of all positions in life [our emphasis] to relatively small and well-defined areas.” Another early study of the “color line” in Chicago housing (Breckinridge 1913, p. 574) observed that “the problem of the Chicago Negro is quite different from the white man and even that of the immigrants. With the Negro the housing dilemma was found to be an acute problem, not only among the poor, as in the case of the Polish, Jewish, or Italian immigrants, but also among the well-to-do.” Dubois’ (1899, p. 348) study of Philadelphia, while emphasizing that blacks were more dispersed in Philadelphia in the 1890s than they had been in the mid-1800s, noted that “it remains true that as a rule they must occupy the worst houses of the districts where they live. The advance made has been a battle for the better class of Negroes [our emphasis].” Undoubtedly some affluent blacks lived in high quality housing in predominantly white neighborhoods in Northern cities in the late 19th and early 20th Centuries. However there is little systematic evidence on how blacks’ residential outcomes were related to their social class.
There is also early but fragmentary evidence of class-differentiated patterns. Comstock (1912, p. 241) noted that within Chicago’s black belt “older and poorer dwellings are as a rule found grouped in the section west of State Street, following the two lines of rail-road tracks. Many of the colored people who desire a better neighborhood have moved east of State Street.” Spear (1967, p. 25) dates this process to before 1900, suggesting that “the streets east of State … had become the mecca of the Negro middle class in the late 1890s” but they had begun to decline by 1905 as poorer blacks followed their lead. DuBois’s (1899) survey of Philadelphia’s Seventh Ward in 1896 emphasized the class gradations among the black community, distinguishing “the criminals, the poor, the laborers, and the well-to-do” (p. 311), but he describes a patch-quilt spatial pattern in which very high and very low status blocks were scattered through the Ward. The “worst Negro slums of the city” could be found near the corner of Seventh and Lombard, but further up Lombard beyond Eight Street and on Rodman to the south are several blocks where “some of the best Negro families of the ward live.” To the west, from Sixteenth to Eighteenth “is a dangerous criminal class,” but north of Lombard and beyond Seventeenth “is one of the best Negro residence sections of the city, centering about Addison street” (pp. 58–61). His account suggests that blacks’ class differentiation would be in evidence only at a very fine spatial scale within the black zone at this early time.
In our analysis of segregating processes, we will focus mainly on the role of social class. A related issue is the impact of migration from the South. From the perspective of assimilation theory, these phenomena are of equal importance. Black migrants from the South should have experienced the disadvantages of being newcomers to the city and of having rural backgrounds not well suited to urban occupations. These disadvantages might result in greater residential isolation, which is of interest in itself. And because migrant status may have been correlated with class standing, we need to control for its effects. The existing literature is inconclusive. Osofsky (1993, p. 43) suggests there was antagonism between Northern and Southern-origin blacks in New York after 1900 but does not comment on their residential patterns. Drake and Clayton (1945) describe a class structure within the black community in which low income and education were especially associated with Southern birth. Tolnay (2003, p. 220) concludes, however, that black migrants enjoyed some advantages with respect to both employment and family structure, possibly due to selectivity in migration. Tolnay, Crowder and Adelman (2002), using ward-level data for a large sample of Northern and Western cities in 1920, found evidence of a slight advantage for Northern-born blacks in the percent of neighbors who were native white and the percent of homeowners. Taeuber and Taeuber (1964) reported that in Chicago by 1950 there was no difference in segregation from whites between migrant and non-migrant blacks, and so they dispute the “immigrant” interpretation of black segregation.
II. Spatial Scale of Segregation
Aside from the processes leading to segregated living, the degree of residential segregation is another natural criterion for evaluating residential separation, and for some it is the sole criterion for use of the term “ghetto.” Massey and Denton (1993, pp. 18–19) define a ghetto as “a set of neighborhoods that are exclusively inhabited by members of one group, within which virtually all members of that group live.” Cutler, Glaeser and Vigdor (1999, p. 456) agree with this assessment, asserting that “[f]or the vast majority of blacks, the neighborhood has come to mean an area that is nearly exclusively black, which we refer to as a ghetto.” Among commonly used measures of segregation, this definition is most closely aligned with the Isolation measure (P*bb), which calculates the percent of black residents in the neighborhood where the average black person lives. Other researchers’ accounts of the formation of black ghettos lean strongly on evidence that an initially dispersed black population became highly concentrated over time into a small set of disproportionately black neighborhoods. The Index of Dissimilarity (D) is relevant here, measuring the extent to which blacks are dispersed across neighborhoods in the same pattern as whites.
What do we know about trends over time in segregation levels? Spear (1967, p. 7) states that in Chicago in 1890 “[m]ost Negroes, although concentrated in certain sections of the city, lived in mixed neighborhoods.” The Chicago Commission on Race Relations (1922, p. 106) aggregated enumeration district data to an area defined as the Black Belt in 1910 (an area extending from 12th to 55th Streets and from Wentworth to Indiana). In this major area of black concentration, Negroes were only about 10% of the population. Bodnar, Simon and Weber (1982, p. 71), studying Pittsburgh in 1900, wrote that “[t]he heavy concentration of blacks in the city’s Hill District, however, did not result in the creation of an isolated ghetto. Black clusters … were interspersed with sections of Russian Jews, Italians, Syrians, Hungarians, and a few Germans and Irish remaining from earlier days.” Lieberson (1980) found that black isolation – the black population share in areas where the average black person lived – averaged only .067 in several major cities in 1890.
A limitation of these reports, acknowledged by all of their authors, is that they relied on census data that were mostly tabulated at the level of wards, which were very large areas. Chicago, for example, had only 35 wards in 1900, averaging nearly 50,000 persons per ward. The strongest critique of relying on such data was voiced by Philpott (pp. 120–121), who complained that the 1900 ward map for Chicago “shows blacks scattered over all of the Southwest Side, most of the South Side, and much of the West Side as well.” In fact, he argued, “the residential confinement of the blacks was nearly complete at the turn of the century … Actually, the blacks were hemmed in tightly from the start.”
A small number of studies provide measures of segregation at a finer spatial scale. The Philadelphia Social History Project (Hershberg et al 1979) provides the most consistent time series documentation of black segregation, tabulating data for very small areas in 1850, 1880, and 1900, and aggregating these data to match comparably-bounded census tract areas in 1930 and 1970. The black-white Index of Dissimilarity (D) at this scale was .47 in 1850, rising to .52 in 1880. In 1930, when the black share of the city population had more than tripled to 11.3%, D rose to .61. By 1970, when blacks were 33.6% of the population, D was near its peak at .75. Another measure, the Isolation Index, shows that blacks were always disproportionately represented in their neighborhoods in Philadelphia, though because of their relatively small numbers they remained a minority in the early decades of the century. The average black lived in a tract that was 11% black in 1850 and 12% black in 1880, but 35% black in 1930. By 1970 isolation by this measure had reached 74%.
Race data for small areas in Chicago have also been reported for early years, including a precinct-level census conducted in 1898 by the Chicago Board of Education (1899). Wallace (1952) plotted these data to 1910 tract boundaries, showing that just over a quarter of blacks lived in areas that were more than 50% black, while over 30% lived in areas that were more than 95% white. These results show that even in fairly small geographic areas blacks in Chicago at the turn of the century tended to live in disproportionately black but not predominantly black neighborhoods. On the other hand, the same data show that 90% of whites lived in areas with no black neighbors. One could conclude that indeed blacks were “hemmed in tightly from the start,” but that they nevertheless lived in racially diverse neighborhoods.
Much can be learned from studying trends in the level of segregation, including both the evenness of distribution of blacks and whites across the city (which the Index of Dissimilarity, D, measures) and the racial composition of areas where blacks lived (such as the Isolation Index P*bb), while also taking into account the relative size of the city’s black population. These are the measures most often employed in past research. We recommend that research should also be sensitive to spatial scale. Although it is sometimes necessary to use a rule of thumb to guess how segregation at one spatial scale (such as a ward) is related to segregation at another scale (such as a tract), such estimates are less convincing than working with actual data at different scales, and neither the ward nor the tract is necessarily the appropriate scale for a given group and time period. Social scientists are becoming more aware of the spatial nature of segregation. Recent work demonstrates that cities vary in the spatial scale at which minorities are segregated (Lee et al 2008) and that the spatial scale may change over time (Reardon et al 2009). We suspect in particular that minority groups are unlikely to establish large homogeneous ethnic settlements when they represent only a tiny proportion of the city population, as was the case of blacks in Northern cities prior to World War I. At an early point in the growth of a minority community, group members may occupy specific buildings or streets, only later extending to whole neighborhoods. As Osofsky (1963, p. 13) pointed out for New York in the 1890s “no single large neighborhood was an all-Negro community. Handfuls of small and densely populated ghettos [our emphasis], usually a block or two in length, were found throughout Manhattan Island … Thirty-seventh and Fifty-eighth Streets, between Eight and Ninth Avenues, were Negro blocks. They were surrounded by white people …”
III. Research plan
We will examine these questions using a combination of rarely used and newly available data for New York City and Chicago, the two most important destinations of the Great Migration in the early 20th Century. The analysis begins in 1880, earlier than most prior studies and early enough to provide a clear baseline of residential patterns before the eventual massive influx of Southern blacks. It extends through 1940, when by all accounts the ghettos in these and other major Northern cities were well established, although the size of the black population and its degree of residential segregation would continue to rise for another two or three decades.
Sources and variables
This study relies on information gathered in the decennial censuses in the period 1880–1940 as individual microdata and aggregate small area data.
1. Small area data
Our data source for 1880 is uniquely suited to our purpose. We draw on the 100% transcription of records from the 1880 federal census, harmonized by the Minnesota Population Center (MPC) and available for public use through the North Atlantic Population Project (NAPP, http://www.nappdata.org/napp). These records were mapped and geocoded to the address level for New York and Chicago by the Urban Transition Historical GIS Project (www.s4.brown.edu/utp, described in Logan et al 2011). Consequently we have complete population information at the finest possible geographic level and we are able to aggregate it to any spatial scale.
We draw on other sources for small-area data for the decades 1900–1940. Most researchers have relied on ward-level statistics published by the Census Bureau for all cities prior to 1940. Tract-level census data for 1940 have long been available as a result of transcriptions organized by Don and Elizabeth Mullen Bogue. Some pre-1940 small area census data have also been accessible, but they are little used.2 However a new source has emerged based on the genealogical website of Ancestry.com. Ancestry has transcribed portions of all the individual records from pre-1950 censuses and used them to construct a finder index for users of its web-based system. These data are now processed for public use by Minnesota’s NAPP project. Meanwhile Allison Shertzer (University of Pittsburgh) obtained permission to assemble records from Ancestry’s webpage for the four census years 1900–1930 for several cities including New York (Manhattan and Brooklyn only) and Chicago. These individual records have now been cleaned and aggregated to EDs in each year, along with historically accurate ED maps. For 1940 we draw on the 100% microdata prepared by NAPP, which we have aggregated to EDs and census tracts. We used these data to create a 1940 indicator of the class composition of census tracts. Median years of education is the indicator, based on all persons above age 15 in the tract. EDs have not yet been mapped for 1940. For this reason our spatial analysis of black neighborhoods in 1940 is based on census tracts, and for consistency we also use tract maps for other years (except that Chicago is missing tract data for 1910 and New York City for 1900, so in these two cases the analyses are based on EDs). We have created comparable maps for 1880 using the 1940 tract boundaries. We make use of the tract maps for 1940 prepared by the National Historical GIS Project (http://www.nhgis.org) for Chicago. Because NHGIS provides only health district maps for New York in 1940, we prepared New York tract maps independently
2. Microdata in 1880 and 1940
We use the 100% census microdata for 1880 at the individual level. For 1940 we rely on the IPUMS microdata sample that now includes an ED identifier for residents. We linked EDs to census tracts, creating a data set with information on individuals and households and tract identifiers. The following individual-level measures are included as predictors in our models of neighborhood location.
The census’s race question in 1940 asked people’s “color or race” and gave alternatives of “white, Negro, Chinese, Japanese, etc.” The 1880 census included a race category of mulatto, and we found that many blacks (identified as Negro in the census) were married to or lived in households with people classified as mulatto. We treat both Negro and mulatto as black, and we include this dichotomy in locational attainment models for 1880.
In 1880 the only indicator of socioeconomic standing is the socioeconomic index (SEI). This index assigns a score to an occupation based on the mean income and education level of persons with that occupation in 1950. The SEI can be expected to be robust over time because it conforms to conventional distinctions among major occupational strata, including the less precise rankings that have been used by many historians (with non-manual occupations ranked above manual labor; professionals and managers ranked above clerks and salesmen; craftsmen ranked above operatives and laborers). Sobek (1996) has studied this question directly, comparing the average income of men in each of 140 occupations in 1890 (using various historical sources) to the income of men in those occupations in 1950. The correlation between the two (weighting occupations by their 1890 size) is .93, showing very little change in occupations’ relative standing. Featherman and Hauser (1978, pp. 25–27; see also Hodge 1981) reached the same conclusion, that the SEI is “strong and persistent enough” to be used in the study of trends in vertical social mobility.
When used as a predictor in 1880, we use the highest SEI value among family (or subfamily) members to represent the family’s standing. Unrelated adults in the household are treated as separate cases. In 1880 the median SEI of employed whites was 19 in Chicago and 22 in New York, compared to the black median of only 15 in Chicago and 12 in New York. The most common occupations for blacks were porter (SEI<5), servant, laborer, hostler (SEI between 5 and 8), and cook, coachman, janitor, laundress (between 9 and 15). By 1940 the median SEI for whites had risen to 33 (Chicago) and 34 (New York), but fell to 11 in both cities for blacks. The most common occupations at the lower end remained similar: porter, private household worker, laborer, janitor, and waiter.
The 1940 census was the first to include multiple indicators of class standing. As a predictor of neighborhood outcome we constructed an index that equally weights the standardized values of individuals’ SEI, educational attainment (highest grade completed of unrelated individuals or of family members), wage income (of unrelated individuals or the sum across family members, on the assumption that all contribute to housing costs), and home ownership. If the household head was a home owner, we treated all family members as home owners and all unrelated persons as renters.
Another potentially important occupational characteristic is the category of domestic servant working in a white-headed household. Very few blacks appear in the 1940 census as servants living in the home of a white employer, but this category accounted for upwards of 10% of black workers in 1880. We include it only in 1880.
Place of birth is used to distinguish Northern from Southern born blacks. The categories in our models are: born in the South, born in the state of residence (New York or Illinois), and born elsewhere (other states and foreign countries).
Demographic control variables are gender, marital status, and household composition. Household composition distinguishes people who live alone from those who live with relatives or only with non-relatives. In 1880 the category of servant in a white household is treated as another category of household composition.
Research approach
Our purpose is to use these sources to examine residential patterns in New York and Chicago over 1880–1940 with a particular focus on our two main research questions: 1) to what degree and at what spatial scale were blacks segregated from whites and 2) how did variation in social class standing among blacks affect their residential outcome? The analysis includes several descriptive and analytical steps.
First, we replicate previous analyses of segregation trends in Northern cities (and specifically New York and Chicago) at the level of wards in 1890–1940. We then add new information on the trend at the enumeration district (ED) level in New York and Chicago, including 1880 for the first time, to assess segregation at this finer spatial scale. We also use spatial statistics (the Moran’s i measure of local spatial clustering) to identify and map black neighborhoods for each decade using data aggregated to the census tract level. The results of neighborhood identification allow us to describe segregation trends more fully in terms of the location of black neighborhoods, the density of black residents within them, and the proportion of each city’s black population that lived in every neighborhood over time. For 1880, taking advantage of geocoded locations of all residents of New York and Chicago, we calculate segregation at scales as fine as the household, building, and street segment to assess the residential pattern at that time.
Second, we carry out a multivariate analysis in each city, using individual-level data to study how individual blacks’ residential locations were associated with their class standing and other background characteristics. In both 1880 and 1940 we use logistic regression to predict whether blacks lived in a black neighborhood and ordinary least squares regression (OLS) to predict the mean SEI of neighbors (in 1880) or median years of education (in 1940) within identified black neighborhoods. We estimate the OLS models at multiple spatial scales in 1880, ranging from individual buildings to combinations of adjacent street segments that are similar to EDs or census tracts.
Our intention, in short, is to provide a clearer assessment of the emergence of the black ghetto in Northern cities during 1880–1940, including both its intensity and spatial extent and the entrapment of higher status blacks within it, which is theoretically one of its outstanding features. The principal question is to what extent patterns observed by 1940 had already appeared many decades earlier in some form.
IV. Long-term trends in segregation at the ward and ED levels
We begin with an overview of the population data at the ward level on which much historical analysis of segregation is based. We begin by looking at the ten Northern cities with the largest black populations in 1940.3 In 1890 nine of the cities with the largest black populations were found in the South (the exception was Philadelphia with 39,000 black residents). By 1940 the absolute numbers and the rankings had changed drastically. New York (458,000) and Chicago (277,000) were now the cities with the largest black populations. City population figures by race for each decade are from Gibson and Jung (2005). Segregation measures were calculated from ward-level data assembled by Cutler, Glaeser and Vigdor (1999) and downloaded from http://trinity.aas.duke.edu/~jvigdor/segregation.
Figure 1 shows the close association between growing black populations and increasing segregation measured at the ward level for the average of the ten cities weighted by the size of their black population. It depicts the total share of blacks in the population along with the average values of the Index of Dissimilarity and the Isolation Index.
Figure 1.

Segregation (D), Isolation (P*bb) and black population share, ward data: weighted average for 10 Northern cities
The figure reveals why historical studies have described segregation as moderate in the earlier decades. The average value of D at the ward level in these cities was only .45 in both 1890 and 1900, similar to contemporary segregation at the tract level between Asians and non-Hispanic whites. Based on the isolation index (P*bb) the average black lived in a ward that was disproportionately black, about 9% compared to the typical city’s black share of 3%. But blacks certainly lived in wards where a great majority of their neighbors were white. The drastic change in both segregation measures over time and especially in isolation between 1920 and 1930 has been used to support the conclusion that black ghettos were formed subsequent to the First World War.
We reach a different conclusion through analysis of higher resolution neighborhood data: We agree that black ghettos had not been formed at the ward level prior to 1920, though by 1940 they were fully developed. What was the situation at finer spatial scales? To answer this question we present results at the ED level for New York and Chicago (Figures 2a and 2b) extending the time frame a decade earlier to 1880. EDs are areas in which a single enumerator was assigned to collect information, generally similar to but in most cases smaller than census tracts (typically around 2000 residents). The levels of segregation and isolation are considerably higher for EDs than for wards and support different conclusions about timing. Philpott (1978, p. 125) previously made this point forcefully in the case of Chicago based on analysis of census tract data: “The first thing to notice is how much segregation the 1910 ward tabulation concealed. While [ward data] show no Negroes living in areas more than 25 percent black in 1910, [tract data] indicate that almost a third of the city’s blacks lived in areas more than 50 percent black.”
Figure 2.


Figure 2a. Black segregation and population share, New York 1880–1940 (based on EDs or wards)
Figure 2b. Black segregation and population share, Chicago 1880–1940 (based on EDs or wards)
Black-white dissimilarity at the level of EDs in 1880 was .63 in New York and .69 in Chicago. (As a point of comparison, the metropolitan average value of D measured for census tracts in 2010 was .59.) D rose to .70 and .75 in these cities by 1900, but values were only .46 and .58 at the ward level. This disparity of about 20 points remained fairly constant through 1940.
Black isolation (P*bb) in 1880 was low by the standards of later years: .10 in New York and .15 in Chicago. But it rose sharply between 1910 and 1920 in New York, from .30 to .54 at the ED level. Blacks were already a majority in their ED by 1920 (when the black overall population share was under 3%), a finding that was missed at the ward level where the 1920 isolation value was only .20. In Chicago blacks were a large majority of the population (P*bb =.62) in 1920 in their ED though just over a third of the population in their ward (P*bb =.38).
These results suggest that blacks did in fact experience a considerable degree of segregation as early as 1880 as measured by D, well before the Great Migration. Black isolation was very high at the ED level by 1920 when the Great Migration was just beginning and the overall black population share was still only 3–4%, and it had been rising steadily since 1880. We now take several steps toward a more complete examination of black residential patterns in New York and Chicago than can be accomplished with summary segregation measures alone.
V. Charting and mapping the full distribution of local area data on race
The dissimilarity index shown in Figures 2a and 2b is derived from a comparison of the distribution of whites and blacks across EDs, but it is difficult for a single measure to convey the extent of segregation. The distribution can be represented more fully in a Lorenz curve, similar to the curves that are more familiar to many social scientists as the basis for calculating the gini index of income inequality. If we list tracts in order from highest to lowest percent black, we can then plot the cumulative distribution of the total black population against the cumulative distribution of the total white population, from 0 to 100%. As with the gini index, a perfectly even distribution would be represented as a straight line with a slope of 1, and in that case the value of D would be 0. Figure 3 presents these plots for 1880 EDs.4 The dotted line is for New York and the solid line is for Chicago. These curves show how extreme racial separation was in Chicago. The EDs with the highest black percentage, where 80% of black residents lived, housed barely more than 10% of the white population. Further inspection of the underlying data (not shown here) reveals that over half of the black population lived in 5 EDs that included less than 3% of the city’s white population, though because the black population was so small, blacks were outnumbered by whites about four to one even in these EDs. At the same time 85 of Chicago’s 190 EDs had no black residents. Over 45% of whites lived in these all-white sections of the city. This distribution yields a gini coefficient of .86. The New York distribution has similar characteristics but the curve is a bit closer to the reference line and the gini is .79. Half of New York’s blacks lived in EDs that included only 5% of the white population. Not shown in the figure, there were 327 EDs (out of 966 total) with no black population. However, about a third of New York’s whites lived in EDs with no black residents.
Figure 3.

Lorenz curves: distribution of black and white population, 1880 (EDs)
Figure 4 shows comparable data for 1940 when segregation was much higher in both cities. The gini had risen to .99 in Chicago and .97 in New York. The 1880 data showed a very highly segregated situation, and by 1940 the pattern was even more extreme (close to the theoretical maximum).
Figure 4.

Lorenz curves: distribution of black and white population, 1940 (EDs)
The spatial distribution of people is another aspect of the residential patterns in these cities that cannot be fully captured in a single measure or even in the complete Lorenz curve. As noted above because this purpose requires detailed mapping we rely on tract data. Where were the disproportionately black areas, and to what extent did they appear as large clusters of tracts or as multiple distinct neighborhoods? How did they change over time? Here we present thematic maps of the black neighborhoods in each city at three points in time: 1880, 1920, and 1940. The maps are based on an analysis of spatial clustering at the tract level, following a procedure described by Logan and Zhang (2004). Local Moran’s i is used to establish which local clusters of tracts with relatively high black concentrations are statistically significant.5 Then tracts with comparable black shares adjacent to these “core” areas are added to the neighborhood. This method provides an objective criterion for identifying black neighborhoods without making a priori judgments about what cutting point qualifies as “disproportionately black.” As will be seen, there is considerable variation over time and across neighborhoods in their degree of black concentration.
The maps showing the largest black neighborhoods in New York are presented in Figure 5.6 Two characteristics of black New York stand out: 1) there appear to be several black neighborhoods in different parts of the city, and 2) their location changes substantially after 1880. One black area in Brooklyn (Bedford-Stuyvesant) and one other in midtown Manhattan (San Juan Hill) are identifiable in all three years. New areas (Harlem, as well as Morrisania in the Bronx and Jamaica in Queens) emerge.
Figure 5.

New York black neighborhoods in 1880, 1920, and 1940 (based on clusters of census tracts)
Table 1 provides more information about the most prominent of these areas. Though larger than the “small and densely populated ghettos” mentioned by Osofsky (1963), data on these neighborhoods emphasize the arrangement of blacks in several small clusters in 1880. The Tenderloin (New York’s Red Light District at the time) had the largest black population in that year, with nearly a fifth of New York’s blacks but a black share of only 14.2%. Greenwich Village, better known as a center of Irish population, included an area that was 12.5% black and comprised almost as many black residents as the Tenderloin. Bedford-Stuyvesant was the third largest black district, with 8.3% of the city’s blacks but in an area that was only 6.8% black. Still, taken together these areas included less than half the city’s black residents.
Table 1.
Black neighborhoods in New York, 1880–1940
| Black population | % Black | % of city black total | ||
|---|---|---|---|---|
|
|
||||
| New York declining black neighborhoods | ||||
| 1 Tenderloin | 1880 | 4,804 | 14.2 | 17.5 |
| 1900 | 9,685 | 18.6 | 18.3 | |
| 1910 | 8,050 | 14.6 | 8.8 | |
| 1920 | 4,397 | 10.2 | 2.9 | |
| 1930 | 142 | 10.4 | 0.0 | |
| 1940 | --- | --- | --- | |
| 2 Greenwich Village | 1880 | 4,655 | 12.5 | 16.9 |
| 1900 | --- | --- | --- | |
| 1910 | --- | --- | --- | |
| 1920 | --- | --- | --- | |
| 1930 | 1,254 | 17.7 | 0.4 | |
| 1940 | --- | --- | --- | |
| New York persisting and post-1880 black neighborhoods | ||||
| 3 San Juan Hill | 1880 | 506 | 9.3 | 1.8 |
| 1900 | 8,129 | 15.4 | 15.3 | |
| 1910 | 12,435 | 22.5 | 13.6 | |
| 1920 | 10,950 | 21.4 | 7.3 | |
| 1930 | 10,169 | 23.1 | 3.1 | |
| 1940 | 8,048 | 18.5 | 1.7 | |
| 4 Bedford-Stuyvesant | 1880 | 2,267 | 6.8 | 8.3 |
| 1900 | 6,320 | 10.9 | 11.9 | |
| 1910 | 9,029 | 16.5 | 9.8 | |
| 1920 | 16,249 | 18.3 | 10.8 | |
| 1930 | 46,579 | 21.0 | 14.1 | |
| 1940 | 84,123 | 33.2 | 18.2 | |
| 5 Harlem | 1880 | --- | --- | --- |
| 1900 | 1,353 | 13.1 | 2.6 | |
| 1910 | 19,257 | 23.1 | 21.0 | |
| 1920 | 71,674 | 56.9 | 47.8 | |
| 1930 | 187,151 | 63.5 | 56.6 | |
| 1940 | 275,669 | 71.2 | 59.5 | |
| 6 Jamaica | 1880 | --- | --- | --- |
| 1900 | 2,489 | 9.9 | 5.4 | |
| 1910 | --- | --- | --- | |
| 1920 | 967 | 10.3 | 0.6 | |
| 1930 | 8,649 | 33.5 | 2.6 | |
| 1940 | 13,587 | 38.6 | 2.9 | |
| 7 Morrisania | 1880 | --- | --- | --- |
| 1900 | --- | --- | --- | |
| 1910 | --- | --- | --- | |
| 1920 | --- | --- | --- | |
| 1930 | --- | --- | --- | |
| 1940 | 12,534 | 11.3 | 2.7 | |
Note: Neighborhoods are identified as clusters of census tracts (EDs in 1900)
By 1940 the situation was much changed. Harlem alone, with 275,000 black residents in an area that was 71.2% black, accounted for almost 60% of the city’s black population. Bedford-Stuyvesant’s black population had soared to 84,000, though the area was not yet majority black. San Juan Hill on Manhattan’s West Side, the area with the largest black population in 1910 though never more than 25% black, was slowly declining, while Jamaica (Queens) was beginning to develop.
Chicago’s black neighborhoods are shown in Figure 6 with population data in Table 2. In sharp contrast to New York, in 1880 there was already one predominant area of black settlement in the South Side. This section of the city held over 70% of Chicago’s small black population in 1880, though the area was less than 10% black. Over time it expanded in area and population size to include 220,000 blacks in 1940, when it was very close to all-black and included 80% of the city’s black population. There was just one other identifiable black community in 1880, the small West Side neighborhood, only 8% black in 1880 but over 76% black by 1940. Other small black neighborhoods appeared by 1940, including the Maxwell Street area, Morgan Park, North Side, Englewood and Lilydale. But the South Side black belt dwarfed these outlying clusters.
Figure 6.

Chicago black neighborhoods in 1880, 1920, and 1940 (based on clusters of census tracts)
Table 2.
Black neighborhoods in Chicago, 1880–1940
| Black population | % Black | % of city black total | ||
|---|---|---|---|---|
|
|
||||
| Chicago persisting black neighborhoods | ||||
| 1 South Side | 1880 | 4,580 | 9.1 | 71.6 |
| 1900 | 16,138 | 16.5 | 62.6 | |
| 1910 | 31,519 | 27.6 | 69.3 | |
| 1920 | 87,148 | 48.5 | 79.6 | |
| 1930 | 186,079 | 87.3 | 79.6 | |
| 1940 | 220,268 | 93.9 | 80.0 | |
| 2 Westside | 1880 | 201 | 8.0 | 3.2 |
| 1900 | --- | --- | --- | |
| 1910 | --- | --- | --- | |
| 1920 | 7,177 | 35.3 | 6.6 | |
| 1930 | 11,644 | 58.7 | 5.0 | |
| 1940 | 11,588 | 76.6 | 4.2 | |
| Chicago post-1910 black neighborhoods | ||||
| 3 Maxwell Street | 1880 | --- | --- | --- |
| 1900 | --- | --- | --- | |
| 1910 | --- | --- | --- | |
| 1920 | --- | --- | --- | |
| 1930 | 14,358 | 47.8 | 6.1 | |
| 1940 | 13,783 | 60.1 | 5.0 | |
| 4 Morgan Park | 1880 | --- | --- | --- |
| 1900 | --- | --- | --- | |
| 1910 | --- | --- | --- | |
| 1920 | 692 | 11.6 | 0.6 | |
| 1930 | 4,410 | 50.1 | 1.9 | |
| 1940 | 6,124 | 55.0 | 2.2 | |
| 5 North Side | 1880 | --- | --- | --- |
| 1900 | --- | --- | --- | |
| 1910 | --- | --- | --- | |
| 1920 | --- | --- | --- | |
| 1930 | 2,943 | 19.1 | 1.3 | |
| 1940 | 4,018 | 30.0 | 1.5 | |
| 6 Englewood | 1880 | --- | --- | --- |
| 1900 | --- | --- | --- | |
| 1910 | --- | --- | --- | |
| 1920 | 1,206 | 20.3 | 1.1 | |
| 1930 | 2,418 | 30.5 | 1.0 | |
| 1940 | 3,681 | 42.2 | 1.3 | |
| 7 Lilydale | 1880 | --- | --- | --- |
| 1900 | --- | --- | --- | |
| 1910 | --- | --- | --- | |
| 1920 | 205 | 32.7 | 0.2 | |
| 1930 | 1,254 | 67.6 | 0.5 | |
| 1940 | 1,823 | 79.5 | 0.7 | |
Note: Neighborhoods are identified as clusters of census tracts (EDs in 1910)
VI. The spatial scale of segregation
These results show that blacks in New York and Chicago were already highly segregated from whites as early as 1880 at the ED level, but that their neighborhoods – built up from ED-level data – nevertheless were majority white in the early decades. We now take a closer look at this latter point, exploiting the geocoded population data from 1880 to examine the composition of areas at ever finer spatial scales. The complete maps cannot be shown here, but we offer some representative street segment information from major black neighborhoods in Chicago and New York. Our purpose is not to demonstrate that segregation is higher at a finer spatial scale, which is already well known, but rather to call attention to just how isolated blacks were at more micro scales and the ways in which this may have mattered in their lives.
The most densely black core of Chicago’s South Side was a group of three street segments in close proximity to one another. Two blocks of 4th Avenue between Harrison and Taylor housed a total of 846 blacks and 458 whites (64.9% black), and one block of 3rd Avenue between Polk and Taylor housed 521 blacks and 125 whites (80.7% black). Thus close to a third of the South Side black population was concentrated in these three majority-black street segments. In New York’s Greenwich Village the single street segment with the largest black concentration was Sullivan Street between West 3rd and Bleecker (517 black residents, 515 whites). In the Tenderloin area it was West 26th Street between Sixth and Seventh Avenues, with 448 blacks and 470 whites.
Yet the larger neighborhoods around these street segments were less than 15% black. A common situation was for a street segment to include 15–25 buildings, of which a majority were predominantly white but the remainder – often clustered together on a portion of the blockface – were predominantly black. We use the 1400 block of South State Street, a majority white street segment on the edge of the South Side as we define it in 1880, to illustrate this arrangement. As shown in Figure 7, one building (#1407, near the northeast corner) had two white and two black residents. The black residents (Emma Hawkins and Henry Morris) were domestic servants of Mary Waltermeyer. Other buildings with black residents were clustered together on the east side of the street. Next to the all-white boarding house at #1423 was an all-black boarding house with 8 residents at #1425. At #1427 lived two white couples, one of whom had a black servant. Next door, #1429 housed four black households with a total of 16 persons, including four boarders. Two doors down, #1433 was a predominantly black building with three all-white households (seven persons) and three all-black households (21 persons). The remainder of that side of South State was all white. On the other side of the street, there was just one racially mixed building; this was #1418 with one white household (7 persons) and one black household (six persons) that included three boarders and a servant girl.
Figure 7.
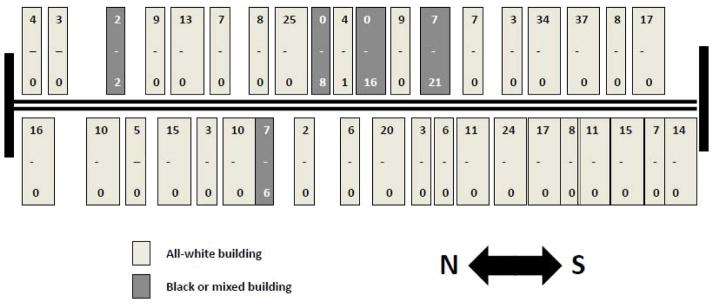
South State Street, Chicago, 1400 block (partial) in 1880, showing number of white residents (upper numeral) and black residents (lower numeral)
Whether a street segment was majority black or majority white, common elements were that households (except for black servants) and buildings tended to be either all-white or predominantly black, and on many streets the black or mixed buildings were near to one another, so that most white buildings were adjacent to other white buildings.
Studies of residential segregation have typically focused on larger areas than buildings or street segments, which are the scales at which we find high levels of racial concentration in 1880. Though this practice has been imposed by the lack of data at spatial scales smaller than census tracts or block groups, it has a theoretical justification. A “neighborhood” of as many as 3,000–5,000 residents, which is the usual range for a contemporary census tract, is large enough to constitute a market for goods and services, and to support institutions like a school or church. We would argue that other spatial scales also have substantive meaning, and that it is not desirable to impose an a priori scale on the analysis of neighborhood phenomena (Spielman and Logan 2013). According to accounts by Comstock and Breckenridge above, the building should have mattered because blacks inhabited the oldest and least comfortable buildings on the block, but did not pay lower rents. From a social relations perspective the street segment is the scale that Grannis (2009) considers the basis of neighborhood social networks and face-to-face interaction. The multi-household building in 1880 likely involved even more personal contact, as co-residents typically shared a backyard privy or a toilet at the end of the hallway, sat together on the stoop on hot summer nights, and heard one another’s quarrels through thin walls. The building also represented a common landlord and a shared interest among tenants. The landlord was a gatekeeper who determined who (by race or class or family composition) was allowed to live there. The landlord was also the person who collected rents and provided (or failed to provide) basic building services, a factor that established a degree of common interest among tenants.
Urban sociologists are familiar with the coexistence of different vertical layers of local social organization, often starting with the face block, extending to a larger neighborhood, community area or district, or even an entire city (Suttles 1972, Hunter 1974). Both Suttles and Hunter considered the street segment or face block (both sides of a street between two intersections) to be the main basis of casual social relationships and face-to-face neighbor relations. The same assumption is made by Anderson (1992) and Grannis (2009). Suttles (1972, p. 56) referred to the next layer (“the smallest area which possesses a corporate identity known to both its members and outsiders”) as the defended neighborhood – the area in which he expected to find collective mobilization. Kusenbach (2008) has more recently investigated neighborhoods at various spatial scales (microsettings within blocks, street blocks, walking distance neighborhoods, and larger enclaves). At each of these scales she finds different constellations of residents’ sentiments and practical uses of their environment, neighborly interaction and relationships, and locals’ participation in collective events and rituals. Her point is not that one scale is more consequential than another, but rather that each is important in its own right. Similarly we do not argue that fine-scale segregation matters more than segregation on a larger scale, but rather that it, too, has consequences.
Table 3 provides summary measures of segregation at various spatial scales. For this purpose we first aggregated the point data to the finest possible units, households and buildings.7 We created three larger levels of non-overlapping areas based on street segments. One is the street segment itself, which includes all of the residents of a single street between two intersections. Another is what we label first-order segment groups. These were constructed to include a focal street segment as well as all of the segments directly connected with it (with which it shares an intersection). A considerably larger area is the second-order segment group that starts with a focal street segment, adds the connected segments, and then adds the segments connected to those. Table 3 also provides measures for the familiar areal units of tracts (as defined in 1940) and wards (as defined in 1880). We have omitted from the calculations those black persons who lived in a white-headed household and had the occupation of domestic servant. Live-in black servants were common in 1880, accounting for about 10% of the black workforce in Chicago and 15% in New York.
Table 3.
Segregation at varying spatial scales, New York and Chicago 1880
| New York | Chicago | |||
|---|---|---|---|---|
| D | Isolation | D | Isolation | |
|
|
||||
| Household | .989 | .931 | .987 | .890 |
| Building | .953 | .741 | .977 | .725 |
| Street | .829 | .230 | .867 | .328 |
| Street Group (1st Order) | .709 | .117 | .791 | .256 |
| Street Group (2nd Order) | .650 | .085 | .754 | .203 |
| Tract | .614 | .072 | .721 | .120 |
| Ward | .455 | .036 | .663 | .086 |
The Index of Dissimilarity (D) was moderately high at the ward and tract levels, as shown above in Figures 2a and 2b. D was considerably higher in second-order street segment groups, higher still in first-order segment groups, and above .80 in both cities at the level of street segments. At even finer spatial scales, it was above .95 in both cities. Segregation of buildings was almost complete, quite similar to the level of segregation across households, which we expected to be extreme in a period when racial intermarriage was rare and lodgers were almost always of the same race as the household head. These measures confirm our observation that segregation (unevenness of distribution) was already substantial in 1880, but they demonstrate that it also varied greatly by spatial scale.
Table 3 provides new information about black isolation at different spatial scales. As reported above and despite high levels of D, blacks lived in wards and census tracts where they were on average a small share of the residents, generally between 5% and 10%. Isolation was low at these scales. They were more isolated, over 20% in New York and over 30% in Chicago at the level of street segments, but still a minority of residents. This means that even at the scale of encounters in daily life, as people might see one another outside their homes, the average black person lived in a racially mixed environment. However the picture is quite different at the scale of buildings. In their own building, the average black person’s “neighborhood” was over 70% black – not as black as their own households (around 90%), but well over a majority.
The exclusion of blacks from large parts of both New York and Chicago resulted in high levels of unevenness (reflected in D) even at the ward or tract level, and segregation within the racially mixed sections created yet higher segregation at finer spatial scales. Nevertheless, whites so greatly outnumbered blacks in both cities in 1880 that even in the mixed areas the average street segment was majority white. Black isolation reached levels that are associated in later years with the black ghetto at the scale of buildings and in some specific street segments at the core of black neighborhoods.
VII. Location of the black middle class
The last step in our analysis is to evaluate how class standing and other personal background factors affected blacks’ residential outcome at the beginning and the end of the period of study. Were blacks with higher class standing able to translate their position into access to a wider range of neighborhoods in 1880 and had they lost this possibility by 1940? Or were they entrapped in black neighborhoods throughout these decades? Within black neighborhoods were there zones of higher and lower class standing? Were these variations measurable in 1880, and how had they evolved by 1940?
Table 4 presents results for 1880 of logistic regressions predicting whether blacks lived in a black neighborhood (as defined above). We considered also presenting ordinary least-squares (OLS) models for the black percentage in the neighborhood in both years, but this dependent variable is far from normally distributed, and racial composition is better represented by the dichotomy between black and non-black neighborhood that we developed above. Tables 5–6 report OLS regressions predicting the median SEI of blacks’ neighbors within black neighborhoods in 1880. Here we take advantage of our geocoded data to compare results at multiple spatial scales. Table 7 reports logistic regression predicting living in a black neighborhood in 1940. Table 8 reports median education levels of the neighborhood in 1940 (for residents 15 and above). Data in all these analyses are at the census tract level.
Table 4.
Logistic regression predicting living in a black neighborhood, Chicago and New York 1880
| Chicago (N=2838) | NYC (N=11796) | |||||
|---|---|---|---|---|---|---|
| b | Robust SE | Z score | b | Robust SE | Z score | |
|
| ||||||
| Intercept | 1.277 | 0.437 | 2.92** | 0.783 | 0.132 | 5.91*** |
| Mulatto | 0.283 | 0.141 | 2.01* | 0.491 | 0.062 | 7.86*** |
| Female | −0.064 | 0.156 | −0.41 | −0.145 | 0.06 | −2.42* |
| Age | −0.009 | 0.005 | −1.61 | −0.006 | 0.002 | −2.84** |
| Marital Status (Reference: single) | ||||||
| Married | −0.356 | 0.192 | −1.85 | 0.029 | 0.077 | 0.38 |
| Widowed | −0.123 | 0.226 | −0.55 | 0.29 | 0.078 | 3.71*** |
| Divorced | −1.593 | 0.741 | −2.15* | 0.74 | 0.346 | 2.14* |
| Household Composition (Reference: living alone) | ||||||
| Servant in white-headed household | −1.649 | 0.407 | −4.05*** | −2.565 | 0.127 | −20.12*** |
| Living with relatives | 0.398 | 0.4 | 1 | 0.032 | 0.11 | 0.29 |
| Living with non-relatives | 0.727 | 0.391 | 1.86 | −0.312 | 0.111 | −2.81** |
| Birthplace (Reference: South) | ||||||
| Local state | 0.132 | 0.255 | 0.52 | −0.192 | 0.053 | −3.6*** |
| Other places | 0.133 | 0.109 | 1.22 | −0.106 | 0.058 | −1.82 |
| Highest SEI in the family | −0.002 | 0.004 | −0.63 | −0.005 | 0.002 | −3.51*** |
| Log pseudolikelihood | −1398.5 | −6982.3 | ||||
| Chi-square | 191*** | 990.1*** | ||||
| df | 12 | 12 | ||||
Note:
P < 0.05,
P < 0.01,
P < 0.001
Table 5.
Predicting mean SEI of neighbors at various spatial scales, Chicago 1880
| Building | Street Segment | 1st Order Segment Group | 2nd Order Segment Group | |||||
|---|---|---|---|---|---|---|---|---|
| b | Robust SE | b | Robust SE | b | Robust SE | b | Robust SE | |
|
| ||||||||
| Intercept | 18.59 | 2.9*** | 23.86 | 1.71*** | 24.95 | 1.61*** | 26.52 | 1.29*** |
| Mulatto | 0.88 | 1.19 | −0.08 | 0.58 | −0.46 | 0.45 | −0.85 | 0.39* |
| Female | 0.25 | 1.28 | 0.18 | 0.56 | −0.16 | 0.49 | 0.06 | 0.39 |
| Age | 0.05 | 0.04 | 0.05 | 0.02** | 0.06 | 0.02*** | 0.06 | 0.01*** |
| Marital Status (Reference: single) | ||||||||
| Married | −1.79 | 1.22 | 0.08 | 0.66 | −0.49 | 0.56 | −0.02 | 0.47 |
| Widowed | −2.5 | 1.6 | −1.02 | 0.77 | −1.12 | 0.67 | −0.86 | 0.56 |
| Divorced | −6.91 | 2.59** | 2.7 | 1.77 | 1.68 | 1.73 | −0.05 | 1.47 |
| Household Composition (Reference: living alone) | ||||||||
| Servant in white-headed household | 23.81 | 3.58*** | 10.7 | 1.63*** | 9.62 | 1.57*** | 7.55 | 1.26*** |
| Living with relatives | 0.82 | 2.55 | −1.57 | 1.57 | −1.23 | 1.54 | −1.97 | 1.23 |
| Living with non-relatives | 1.06 | 2.5 | −1.68 | 1.56 | −2.1 | 1.52 | −2.52 | 1.2* |
| Birthplace (Reference: South) | ||||||||
| Local state | −2.07 | 1.46 | −0.88 | 0.77 | 0.06 | 0.67 | −0.06 | 0.58 |
| Other places | −0.08 | 0.77 | 0.01 | 0.41 | 0.23 | 0.31 | −0.09 | 0.27 |
| Highest SEI in the family | 0.08 | 0.03** | 0.03 | 0.01* | 0.01 | 0.01 | 0 | 0.01 |
| R-squared | 0.091 | 0.155 | 0.191 | 0.197 | ||||
| Root MSE | 13.875 | 8.579 | 7.074 | 6.14 | ||||
| Number of cases | 2,004 | 2,785 | 2,797 | 2,806 | ||||
Note:
P < 0.05,
P < 0.01,
P < 0.001
Table 6.
Predicting mean SEI of neighbors at various spatial scales, New York 1880
| Building | Street Segment | 1st Order Segment Group | 2nd Order Segment Group | |||||
|---|---|---|---|---|---|---|---|---|
| b | Robust SE | b | Robust SE | b | Robust SE | b | Robust SE | |
|
| ||||||||
| Intercept | 18.64 | 0.71*** | 25.18 | 0.43*** | 28.24 | 0.31*** | 29.11 | 0.25*** |
| Mulatto | 0.02 | 0.41 | −0.68 | 0.18*** | −0.37 | 0.13** | −0.08 | 0.11 |
| Female | 0.8 | 0.4* | 1.79 | 0.19*** | 1.31 | 0.14*** | 1.02 | 0.11*** |
| Age | 0.02 | 0.01 | −0.01 | 0.01* | −0.01 | 0** | −0.01 | 0** |
| Marital Status (Reference: single) | ||||||||
| Married | −1.16 | 0.52* | 0.15 | 0.23 | 0.02 | 0.16 | −0.06 | 0.14 |
| Widowed | −2.23 | 0.51*** | −0.78 | 0.25** | −0.3 | 0.17 | −0.3 | 0.14* |
| Divorced | −0.2 | 2.23 | −1.48 | 1.23 | 1.02 | 1.02 | 0.42 | 0.86 |
| Household Composition (Reference: living alone) | ||||||||
| Servant in white-headed household | 20.73 | 1.08*** | 7.29 | 0.39*** | 4.29 | 0.28*** | 3.32 | 0.22*** |
| Living with relatives | 0.37 | 0.51 | 0.01 | 0.36 | 0.34 | 0.26 | 0.43 | 0.2* |
| Living with non-relatives | 0.98 | 0.53 | 1.3 | 0.37*** | 0.88 | 0.27*** | 0.74 | 0.21*** |
| Birthplace (Reference: South) | ||||||||
| Local state | −0.22 | 0.3 | 0.04 | 0.16 | −0.2 | 0.11 | −0.46 | 0.1*** |
| Other places | −0.18 | 0.36 | −0.04 | 0.18 | −0.25 | 0.13 | −0.34 | 0.11** |
| Highest SEI in the family | 0.04 | 0.01** | 0.03 | 0.01*** | 0.01 | 0* | 0.01 | 0 |
| R-squared | 0.227 | 0.198 | 0.147 | 0.126 | ||||
| Root MSE | 11.15 | 6.722 | 4.79 | 4.027 | ||||
| Number of cases | 8,484 | 11,799 | #### | #### | ||||
Note:
P < 0.05,
P < 0.01,
P < 0.001
Table 7.
Logit model predicting living in black neighborhood in Chicago and New York, 1940
| Chicago (N=859) | NYC (N=1564) | |||
|---|---|---|---|---|
| b | Robust SE | b | Robust SE | |
|
| ||||
| Intercept | 4.766 | 0.862*** | 2.411 | 0.462*** |
| Female | −0.269 | 0.449 | 0.594 | 0.228** |
| Age | −0.022 | 0.012 | −0.017 | 0.009 |
| Marital Status (Reference=never married) | ||||
| Married | 0.274 | 0.755 | 0.231 | 0.259 |
| Widowed | 0.033 | 0.837 | 0.209 | 0.374 |
| Divorced | −0.454 | 1.175 | −0.287 | 0.757 |
| Household Composition (Reference=live alone) | ||||
| Living with relatives | −0.966 | 0.55 | 0.169 | 0.232 |
| Living with non-relatives | −0.195 | 0.663 | 0.547 | 0.327 |
| Birthplace (Reference=South) | ||||
| Local state | −0.551 | 0.584 | −0.602 | 0.266* |
| Other places | −0.28 | 0.485 | −0.088 | 0.208 |
| SES Index | 0.136 | 0.228 | 0.088 | 0.201 |
| Log pseudolikelihood | −135 | −475.3 | ||
| Chi-square | 15.88 | 60.81 | *** | |
| df | 10 | 10 | ||
Note:
P < 0.05,
P < 0.01,
P < 0.001
Table 8.
OLS regression predicting tract median education in Chicago and New York, 1940
| Chicago (N=859) | NYC (N=1564) | |||
|---|---|---|---|---|
| b | Robust SE | b | Robust SE | |
|
| ||||
| Intercept | 7.601 | 0.121*** | 7.903 | 0.13*** |
| Female | 0.057 | 0.064 | 0.117 | 0.052* |
| Age | −0.002 | 0.003 | −0.002 | 0.003 |
| Marital Status (Reference=never married) | ||||
| Married | 0.221 | 0.097* | 0.01 | 0.069 |
| Widowed | −0.003 | 0.144 | 0.056 | 0.102 |
| Divorced | 0.039 | 0.19 | −0.105 | 0.199 |
| Household Composition (Reference=live alone) | ||||
| Living with relatives | −0.135 | 0.077 | −0.156 | 0.063* |
| Living with non-relatives | 0.066 | 0.098 | −0.018 | 0.081 |
| Birthplace (Reference=South) | ||||
| Local state | 0.255 | 0.082** | −0.047 | 0.077 |
| Other places | 0.13 | 0.085 | −0.096 | 0.056 |
| SES Index | 0.37 | 0.047*** | 0.301 | 0.042*** |
| R-squared | 0.312 | 0.205 | ||
Note:
P < 0.05,
P < 0.01,
P < 0.001
In all of these models the sampled persons include only black adults age 18 and above. They include the household head, one adult selected randomly from every subfamily within the household that is unrelated to the head, and any other adult who is not related to another household member. Members of the same family or subfamily have interdependent locational choices, and where possible (measures of class standing in both years) the predictor is based on the member with the highest value. Unrelated adults are treated as separate cases. Standard errors reported here are corrected for clustering within households.
Findings in 1880
As shown in Table 4, in 1880 the single measure of social class, SEI, is unrelated to living in a black neighborhood of Chicago, but it is negatively associated with living in a black New York neighborhood. This effect, though significant, is small. The predicted probability for a person/family to live in a black neighborhood in New York, given SEI at the black mean of 15.8 and mean or modal values on other characteristics, is 0.636. Given 5 points higher SEI (at the 85th percentile of the black distribution), this probability declines very slightly to 0.630.
Place of birth is unrelated to race of neighborhood in Chicago, but there is a modest association in New York predicting Southern-born persons to be more likely to live in a black neighborhood than those born in New York or any other non-South location. A New York black adult with average/modal characteristics born in the South has a predicted probability of 0.636 of living in a black neighborhood, compared to 0.591 for New York-born and 0.611 for those born elsewhere.
Among the control variables, women and older persons are less likely to live in black neighborhoods in New York; widowed and divorced persons are more likely (compared to single persons). There is a very strong effect of being a servant in a white-headed household, demonstrating the importance of controlling for this situation in the 1880 sample. Otherwise household composition has one significant effect. Compared to living alone, those living with non-relatives are less likely to live in a black neighborhood in New York. This finding may reflect white families who live in less black tracts and who take in black lodgers, or it may reflect black employees who were not identified as live-in servants.
There is one other predictor in this model that is not available in later years. This is the distinction between mulatto and Negro. For persons with average or modal characteristics on other variables, the predicted probability of living in a black neighborhood is 0.876 for mulattos and 0.842 for Negroes in Chicago, 0.741 for mulattos and 0.636 for Negroes in New York. The latter is a particularly large difference. There has been some speculation in the literature that mulattos might be lighter skinned and therefore have locational advantages, but the result seems to be the opposite. An alternative interpretation would be that this racial distinction was a subjective judgment for an enumerator to make, and it is possible that light-skinned blacks outside black neighborhoods were simply assumed by the enumerator to be white, or they were presenting themselves as white, whereas those in black neighborhoods were judged to be mulatto.
Tables 5 and 6 present results of 1880 models where the dependent variable is the mean SEI of neighbors (not including the sampled person’s household) at these spatial scales: the building, street segment, first order and second order segment group. We found above that racial segregation is most evident at the finer scales, but there are no precedents for studying class composition at these different scales. We find that results vary between New York and Chicago.
Persons/families with higher SEI lived in higher SEI contexts at the building and street segment level in New York and Chicago, and also at the first-order segment group level in New York. Birthplace has no significant associations in Chicago, but at scale of second order segment groups those born in New York or other non-South places live in significantly lower SEI contexts. This is the opposite of the “Southern migrant disadvantage” that has been mentioned in the literature, and more consistent with the notion that migrants from the South at this early time were highly selected for education or other traits that are not measured in the 1880 census. Mulattos lived in lower SEI neighborhoods at the second-order segment scale in Chicago and at the street segment and first-order segment group scale in New York. Hence mulattos could be thought of as having a locational disadvantage both in terms of being constrained to black neighborhoods and also to living in the poorer sections of those neighborhoods. We cannot offer an interpretation of the variation in effects across scales.
Among control variables, women lived in higher SEI areas at every scale in New York; older age was associated positively with neighborhood SEI in Chicago (except at the building level), but lower SEI in New York (again except at the building level). In New York widowed persons (compared to single adults) lived in lower SEI settings at most scales. As we saw in the previous table, servants in white-headed households lived in very distinctive environments, evidently reflecting the class standing of their employers. Of other household composition measures, persons living with non-relatives (compared to single persons) lived in lower SEI areas at the level of second order segment group in Chicago, but in higher SEI areas at every scale except the building in New York.
Findings in 1940
Tables 7 and 8 report models for 1940 where the dependent variable is living in a black neighborhood (logistic regression) or neighbors’ class standing (SEI). None of the predictors has a significant effect on living in a black neighborhood in Chicago, and the model chi-square is not statistically significant. Simply put, black people lived in black neighborhoods regardless of their socioeconomic standing (measured with an SES index), their migrant or local origin, or any other measured attribute. In New York, the result is almost the same. Here women are more likely to live in a black neighborhood, as are those born in New York (vs. the South).
There are stronger effects on living in a tract with higher class standing (measured by median education of residents). First, and most relevant to this study, in both cities there is a significant difference between blacks with lower and higher values on the SES index. Second, in Chicago there is an advantage for those born in Illinois over Southern migrants. (Being a black servant in a white-headed household is so rare that we omitted it from the model.) The explained variance in these models is in the range of .20–.30.
VIII. Conclusion
Let us summarize the many findings presented above. Most previous research has relied on ward data to measure segregation (using D, the Index of Dissimilarity), which reached high levels (close to or above .60) in many Northern cities in the 1920–1940 period. Our data from 1880 show for the first time that even at the ward level and at this early time blacks experienced a high level of segregation in Chicago (the value of D is .663, well above the average metropolitan region in 2010, a level that most researchers consider high). We have also shown that reliance on ward data, especially in the period when blacks were less than 1.5% of the city population, misses substantial segregation at finer scales. Consider especially the New York case. Ward-level segregation in New York in 1880 (.455) was in the moderate range, but at the more commonly measured tract level it was .614, above the threshold of what is now considered high. At the level of the street segment, it was .829. And at the building level it was above .95 in both New York and Chicago. These results suggest that black-white segregation in New York and Chicago was intense already in 1880.
Whether high segregation had created isolated black neighborhoods at this time is a different question, whose answer also depends greatly on spatial scale. The usual way to address this question is by asking whether blacks lived in majority black settings. At the ward level the average black in New York lived in an area that was only 20% black in 1920, rising to 42% black in 1930 as the Great Migration nearly doubled the black share of the population. But at the ED level isolation reached 54% already in 1920. In Chicago isolation at the ward level jumped from 15% in 1910 to 38% in 1920 (already a large increase) and rose as high as 70% in 1930. But at the ED level the rise began earlier, with isolation reaching a majority-black level (62%) already in 1920, and then continuing to increase. Making use of finer resolution data in 1880 we found that blacks at that early time lived in predominantly black environments at the scale of buildings. We also noted that some street segments in the core of Chicago’s South Side were well above 50% black. Because multi-household buildings in 1880 required such dense personal interaction – before the era of the elevator-driven high-rise apartment house and private toilets in dwelling units – we argue that isolation at the building level actually mattered to people’s social networks. And highly segregated buildings suggest that there was some sort of steering process separating blacks from whites even when they lived on the same block.
The presence of a segregating process is as important to urban theory as the level of segregation. Using the terminology developed by Duncan and Duncan (1957) to describe this process, blacks tended to “invade” the worst white-occupied housing in many small Chicago and New York neighborhoods during the period when their population was growing slowly from 2% to 3% or 4% of the city total. Their demographic potential to “succeed” as the predominant group in much larger areas came only with the massive growth produced by the Great Migration, beginning on a small scale after the First World War and continuing well into the 1950s. As the black zone expanded, the better housing was found in areas recently abandoned by whites, and it was occupied by blacks of higher class standing. But in the 1940s higher class blacks did not typically move beyond the black zone. The ghettoization process in this respect refers to class differentiation within the black area but without opportunities to move outside of it. This is what we found in 1940. Our index of class position (including education, income, SEI, and home ownership) was associated with living in a “better” black neighborhood, but not with living in a non-black neighborhood in either city.
Results were similar in 1880. We found a significant tendency of blacks with higher SEI to live outside the boundaries of black neighborhoods only in New York, and this was a tiny effect. Yet there was already some evidence of class differentiation within the black zone – a significant effect of SEI on neighbors’ SEI in Chicago at the building and street segment levels and in New York at all but the 2nd order street segment level. To this extent it was true (more clearly true in New York) that blacks who could “achieve success in some profession or trade were generally able to improve their housing condition and acquire a residence befitting their status” (Massey and Denton 1993, p. 20). But such spatial mobility did not extend to living in outside the black zone.
Our approach to the history of black settlement in Northern cities is relevant to current debates about the use of the term “ghetto.” Like many scholars we examine both the levels of segregation and isolation and the processes that place blacks in disproportionately minority areas. For example Wacquant (1993) provoked considerable discussion through his contrast of Chicago’s ‘Black Belt’ with the French ‘Red Belt’ outside of Paris. The Black Belt today is a ghetto, in his view. But the Parisian case is not, he argues, first because of its lower level of segregation. He depicts France’s immigrant communities as ethnically heterogeneous, with most immigrants dispersed across neighborhoods where the majority of residents are native French. Many researchers rely only on this criterion in their assessment of U.S. cities, past and present. A second consideration is the set of processes that determine people’s location. Wacquant suggests that in France, unlike the United States, residential segregation is attributable to class differences rather than race or ethnicity. The immigrant second generation, he believes, is assimilating successfully in terms of culture, social position and living conditions, with a “closing of the economic, social and cultural distance between immigrants and the . . . native working class stuck in the banlieue” (1993, p. 379). Events in the last decade around Paris suggest that this conclusion may have been premature. But the theoretical insight here is to emphasize “the underlying and interrelated social processes that produce and maintain ghetto areas” (Chaddha and Wilson 2008, p. 384; see also Blokland 2008, Small 2008), rather than defining ghettos solely by the racial or class composition of neighborhoods.
By these criteria – the high level of segregation, the high degree of racial isolation evident at a fine spatial scale, the entrapment of middle class blacks within the black zone, and a degree of class separation within the black zone – we conclude that there was an emergent ghetto in both New York and Chicago in 1880. It is noteworthy that these two cities do not fit into a single mold. Our data at the tract level show that Chicago was the more segregated city by 1900, both in terms of evenness of distribution and in terms of black isolation. The differences were modest in 1880 and 1900, but became more pronounced in 1930–1940. Chicago stands out as a city with two black neighborhoods that were established early on in the South Side and West Side that then persisted into the future, while New York’s early black neighborhoods in lower Manhattan gave way to newer and larger black zones. It was not until 1920 that one neighborhood – Harlem – stood out as majority black and containing a near-majority of the city’s black residents.
Because both of these cities were so central in the Great Migration to the North, and because the South Side and Harlem play such prominent roles in our understanding of black ghettos, the real differences between them are a warning that there was not a single uniform template for black-white segregation in the North. Yet the experience of each city supports these conclusions: segregation was a powerful force in black residential patterns in Northern cities shortly after the Civil War and well before the Great Migration, and blacks’ individual socioeconomic mobility had little relevance to their residential assimilation with whites. These are features that became more salient as black populations in these cities irrupted in the 1930s and beyond, and they are features that remain recognizable today.
Acknowledgments
This research was supported by research grants from National Science Foundation (0647584) and National Institutes of Health (1R01HD049493-01A2) and by the staff of the research initiative on Spatial Structures in the Social Sciences at Brown University. The Population Studies and Training Center at Brown University (R24 HD041020) provided general support. We are indebted to Allison Shertzer (University of Pittsburgh) for sharing microdata and collaborating in the creation of GIS maps for 1900-1930.
Footnotes
One reviewer commented that “it is a bit of a stretch to apply the term ‘ghetto’ to blacks in NYC and Chicago in the 1880s, since they constituted such a minuscule fraction of the population in those cities.” We agree. But our point is that the absence of a fully developed ghetto should not be interpreted to mean that the fundamental segregating processes that created ghettos were not already in play. The ghetto was “emergent” in 1880 in the sense that blacks were already greatly restricted in where they could live, regardless of their social background, and the results were evident in residential patterns at both a micro and macro spatial scale.
For 1910–1930 the Census Bureau reported population at the census tract level for several cities, and these data are available for New York City in each of these decades (Laidlaw 1912, 1922, 1932) and for Chicago in 1920 and 1930 (Burgess 1931, 1933). Although the Chicago Commission on Race Relations obtained data at the finer level of enumeration districts in 1910 and 1920, we have been unable to locate the original data. Similarly although the 1910 tract data for Chicago were analyzed and mapped in several studies (Duncan and Duncan 1955, Wallace 1952), we have not located these data.
These ten cities are New York, NY; Chicago, IL; Philadelphia, PA; Detroit, MI; St. Louis, MO; Cleveland, OH; Newark, NJ; Pittsburgh, PA; Cincinnati, OH; and Indianapolis, IN.
Lorenz curves on racial composition are little used today but have previously been published for Chicago in 1910 (Wallace 1952) and in 1920–1950 (Duncan and Duncan 1957).
The local Moran’s i statistic (Anselin 1995) identifies EDs that have a statistically significant high concentration of a particular trait and whose adjacent EDs also have a high concentration (where “high” is based on the overall distribution in a given city and time). This same method was used earlier by Sampson, Morenoff and Earls (1999) to identify areas of Chicago with strong or weak adult-child relations as “local pockets of spatial association.” In our case the indicator is the percent black residents, and we interpret the “local pockets” as black neighborhoods.
Additional and more detailed color maps are available in the on-line supplement (LINK), showing variations in percent black at the ED level in both cities in 1880, 1900, 1910, 1920, and 1930.
A typical building in either city included 5–10 households, but there were also many small single family buildings in sections of each city including the black sections. Omitting these latter buildings from the analysis makes little difference in the results.
The authors have full responsibility for the findings and interpretations reported here.
Contributor Information
John R. Logan, Brown University
Weiwei Zhang, Brown University.
Miao Chunyu, University of Wisconsin, Stevens Point.
References
- Alba Richard D, Logan John R, Stults Brian. How Segregated Are Middle-Class African Americans? Social Problems. 2000 Nov;47:543–58. [Google Scholar]
- Anderson Elijah. Streetwise: Race, Class, and Changes in an Urban Community. Chicago: University of Chicago Press; 1992. [Google Scholar]
- Anselin Luc. Local Indicators of Spatial Association – LISA. Geographical Analysis. 1995;27:93–115. [Google Scholar]
- Blokland Talja. From the Outside Looking in: A ‘European’ Perspective on the Ghetto. City & Community. 2008;7:372–377. [Google Scholar]
- Board of Education of the City of Chicago. Proceedings July 13, 1898 to June 28, 1899. Chicago: John F. Higgins; 1899. [Google Scholar]
- Bodnar John, Simon Roger, Weber Michael P. Lives of Their Own: Blacks, Italians, and Poles in Pittsburgh, 1900–1960. Urbana: University of Illinois Press; 1982. [Google Scholar]
- Breckinridge Sophinisba P. The Color Line in the Housing Problem. The Survey. 1913;40(February 1):575–576. [Google Scholar]
- Burgess Ernest W. Census Data of the City of Chicago, 1920. Chicago: University of Chicago Press; 1931. [Google Scholar]
- Burgess Ernest W. Census Data of the City of Chicago, 1930. Chicago: University of Chicago Press; 1933. [Google Scholar]
- Chaddha Anmol, Wilson William Julius. Reconsidering the ‘Ghetto’. City and Community. 2008;7:384–388. [Google Scholar]
- Chicago Commission on Race Relations. The Negro in Chicago: A Study of Race Relations and a Race Riot. Chicago: University of Chicago Press; 1922. [Google Scholar]
- Comstock Alzada P. Chicago Housing Conditions, VI: The Problem of the Negro. American Journal of Sociology. 1912;18:241–257. [Google Scholar]
- Cutler David M, Glaeser Edward L, Vigdor Jacob L. The Rise and Decline of the American Ghetto. Journal of Political Economy. 1999;107:455–506. [Google Scholar]
- Drake St Clair, Clayton Horace. Black Metropolis. New York: Harcourt, Brace and Company; 1945. [Google Scholar]
- DuBois WEB. The Philadelphia Negro. Philadelphia: University of Pennsylvania Press; 1899. [Google Scholar]
- Duncan Otis D, Duncan Beverly. The Negro Population of Chicago: A Study of Residential Succession. Chicago: University of Chicago Press; 1957. [Google Scholar]
- Featherman David L, Hauser Robert M. Opportunity and Change. New York: Academic Press; 1978. [Google Scholar]
- Flamming Douglas. Bound for Freedom: Black Los Angeles in Jim Crow America. Berkeley: University of California Press; 2006. [Google Scholar]
- Frazier E Franklin. Negro Harlem: An Ecological Study. American Journal of Sociology. 1937;43:72–88. [Google Scholar]
- Gibson Campbell, Jung Kay. Historical Census Statistics On Population Totals By Race, 1790 to 1990, and By Hispanic Origin, 1970 to 1990, For Large Cities And Other Urban Places In The United States. Population Division Working Paper No. 76. Washington, DC: U.S. Census Bureau; 2005. [Accessed April 20, 2012]. at http://www.census.gov/population/www/documentation/twps0076/twps0076.html. [Google Scholar]
- Grannis Richard. From the Ground Up: How the Layered Stages of Neighbor Networks Translate Geography into Neighborhood Effects. Princeton, NJ: Princeton University Press; 2009. [Google Scholar]
- Greenberg Stephanie. Industrial Location and Ethnic Residential Patterns in an Industrializing City: Philadelphia, 1880. In: Hershberg Theodore., editor. Philadelphia: Work, Space, Family, and Group Experience in the Nineteenth Century. New York: Oxford University Press; 1981. pp. 204–232. [Google Scholar]
- Hershberg Theodore, Burstein Alan N, Ericksen Eugene P, Greenbergand Stephanie, Yancey William L. A Tale of Three Cities: Blacks and Immigrants in Philadelphia: 1850–1880, 1930 and 1970. Annals of the American Academy of Political and Social Science. 1979;441:55–81. [Google Scholar]
- Hodge Robert W. The Measurement of Occupational Status. Social Science Research. 1981;10:396–415. [Google Scholar]
- Hunter Albert. Symbolic Communities. Chicago: University of Chicago Press; 1974. [Google Scholar]
- Kusenbach Margarethe. A Hierarchy of Urban Communities: Observations on the Nested Character of Place. City and Community. 2008;7:225–249. [Google Scholar]
- Laidlaw Walter. Statistical Sources for Demographic Studies of Greater New York, 1910. New York: New York Federation of Churches; 1912. [Google Scholar]
- Laidlaw Walter. Statistical Sources for Demographic Studies of Greater New York, 1920. New York: Cities Census Committee; 1922. [Google Scholar]
- Laidlaw Walter. Population of the City of New York, 1890–1930. New York: Cities Census Committee; 1932. [Google Scholar]
- Lee BA, Reardon SF, Firebaugh G, Farrell CR, Matthews SA, O’Sullivan D. Beyond the census tract: patterns and determinants of racial residential segregation at multiple geographic scales. American Sociological Review. 2008;73:766–791. doi: 10.1177/000312240807300504. [DOI] [PMC free article] [PubMed] [Google Scholar]
- Logan John R, Zhang Wenquan. Identifying Ethnic Neighborhoods with Census Data: Group Concentration and Spatial Clustering. In: Goodchild Michael, Janelle Donald., editors. Spatially Integrated Social Science. Oxford University Press; 2004. pp. 113–126. [Google Scholar]
- Marcuse Peter. The enclave, the citadel, and the ghetto: what has changed in the postfordist U.S. city? Urban Affairs Review. 1997;33(2):228–264. [Google Scholar]
- Massey Douglas, Denton Nancy. American Apartheid. Cambridge, MA: Harvard University Press; 1993. [Google Scholar]
- Osofsky Gilbert. Harlem: The Making of a Ghetto. Negro New York, 1890–1930. New York: Harper and Row; 1963. [Google Scholar]
- Philpott Thomas Lee. The Slum and the Ghetto: Neighborhood Deterioration and Middle-Class Reform, Chicago, 1880–1930. New York: Oxford University Press; 1978. [Google Scholar]
- Reardon Sean F, Farrell Chad R, Matthews Stephen A, O’Sullivan David, Bischoff Kendra, Firebaugh Glenn. Race and space in the 1990s: Changes in the geographic scale of racial residential segregation, 1990–2000. Social Science Research. 2009;38:55–70. doi: 10.1016/j.ssresearch.2008.10.002. [DOI] [PMC free article] [PubMed] [Google Scholar]
- Sampson R, Morenoff J, Earls F. Beyond social capital: spatial dynamics of collective efficacy for children. American Sociological Review. 1999;64:633–660. [Google Scholar]
- Small Mario. Four Reasons to Abandon the Idea of ‘the Ghetto’. City & Community. 2008;7:389–398. [Google Scholar]
- Sobek Matthew. Work, Status, and Income: Men in the American Occupational Structure since the Late Nineteenth Century. Social Science History. 1996;20:169–207. [Google Scholar]
- South Scott, Crowder Kyle. Escaping Distressed Communities: Individual, Community, and Metropolitan Influences. American Journal of Sociology. 1997;4:104–1084. [Google Scholar]
- Spear Allen. Black Chicago: The Making of a Negro Ghetto 1890–1920. Chicago: University of Chicago Press; 1967. [Google Scholar]
- Spielman Seth, Logan John R. Using High-Resolution Population Data to Identify Neighborhoods and Establish Their Boundaries. Annals of the Association of American Geographer. 2013;103(1):67–84. doi: 10.1080/00045608.2012.685049. [DOI] [PMC free article] [PubMed] [Google Scholar]
- Suttles Gerald D. The Social Construction of Communities. Chicago: University of Chicago Press; 1972. [Google Scholar]
- Tolnay Stuart, Crowder Kyle, Adelman Robert. Race, Regional Origin and Residence in Northern Cities at the Beginning of the Great Migration. American Sociological Review. 2002;67:456–75. [Google Scholar]
- Tolnay Stuart. The African American ‘Great Migration’ and Beyond. Annual Review of Sociology. 2003;29:209–232. [Google Scholar]
- Wacquant Loic. Urban outcasts: Stigma and division in the black American ghetto and the French urban periphery. International Journal of Urban and Regional Development. 1993;17:366–83. [Google Scholar]
- Wallace David. PhD dissertation. Harvard University; 1952. Residential Concentration of Negroes in Chicago. [Google Scholar]
- Wilson William Julius., Jr . The Truly Disadvantaged: The Inner City, the Underclass, and Public Policy. Chicago: University of Chicago Press; 1987. [Google Scholar]