Abstract
♦ Objective:
To explore the effect of glycated hemoglobin (HbA1c) and albumin-corrected glycated serum proteins (Alb-GSP) on the mortality of diabetic patients receiving continuous peritoneal dialysis (PD).
♦ Methods:
In this single-center retrospective cohort study, incident diabetic PD patients from January 1, 2006, to December 31, 2010, were recruited, and followed up until December 31, 2011. The effect of HbA1c and Alb-GSP on mortality was evaluated by Cox proportional hazards models.
♦ Results:
A total of 200 patients (60% male, mean age 60.3 ± 10.6 years) with a mean follow-up of 29.0 months (range: 4.3 – 71.5 months) were recruited. Sixty-four patients died during the follow-up period, of whom 21 died of cardiovascular disease (CVD). Mean values for HbA1c, GSP and Alb-GSP were 6.7% (range: 4.1 – 12.5%), 202 μmol/L (range: 69 – 459 μmol/L), and 5.78 μmol/g (range: 2.16 – 14.98 μmol/g), respectively. The concentrations of GSP and Alb-GSP were closely correlated with HbA1c (r = 0.41, p < 0.001 and r = 0.45, p < 0.001, respectively). In multivariate Cox proportional hazards models, patients with HbA1c ≥ 8% were associated with increased risk of all-cause mortality (hazard ratio [HR] = 2.29, 95% confidence interval [CI]: 1.06 – 4.96, p = 0.04), but no increased mortality in patients with 6.0% ≤ HbA1c ≤ 7.9%. Patients with Alb-GSP ≤ 4.50 μmol/g had increased all-cause and non-cardiovascular mortality (HR = 2.42, 95% CI: 1.13 – 5.19, p = 0.02; and HR = 2.98, 95% CI: 1.05 – 8.48, p = 0.04 respectively).
♦ Conclusions:
Increased HbA1c and decreased Alb-GSP may be associated with poorer survival in diabetic PD patients, with a non-significant trend observed for poorer survival with the highest level of Alb-GSP.
Keywords: Diabetes, peritoneal dialysis, glycated hemoglobin, glycated serum proteins, mortality
The prevalence of diabetes is increasing worldwide. It was reported that the overall prevalence of diabetes was 11.6% and the prevalence of pre-diabetes was 50.1% in China (1). Diabetes is the leading cause of end-stage renal disease (ESRD) in the United States (2), and the second cause of ESRD in China (3). Dialysis patients with diabetes are at high risk of mortality compared with non-diabetic patients (4–7). High glucose concentration peritoneal dialysis (PD) solutions may exacerbate metabolic abnormalities and increase mortality in diabetic patients treated with PD (8–10). Glycemic control, based on monitoring hyperglycemia, is fundamental for managing diabetes. Many studies have shown that intensive glycemic control can prevent or delay progression of the micro-vascular and macro-vascular complications of diabetes and reduce cardiovascular disease (CVD) morbidity and mortality in diabetic patients (11–13). However, the association between glycemic control and survival in diabetic patients receiving hemodialysis is still under debate (14–17). In patients on hemodialysis, some (14–16), but not all observational studies (17,18), found that glycated hemoglobin (HbA1c) levels of < 7% or 9% were associated with better patient survival. The limited previous results in peritoneal dialysis settings also are inconsistent (19–21).
Glycated hemoglobin is currently the preferred standard for detecting mean glycemic measurements over a 2 – 3 month period based on the average red blood cell lifespan (22). However, anemia, usage of erythropoietin, and shortened red blood cell lifespan are very common in dialysis patients and in these situations, inaccuracy of the HbA1c measurement must be considered in the assessment of glycemic control (23). Thus, HbA1c may not be an ideal measurement of glycemic control in ESRD patients. Other markers such as glycated albumin (GA) that reflect glycemic control over a shorter period may be of greater value for predicting clinical outcomes in hemodialysis patients (14,23–25). Glycated serum proteins (GSP) are formed by the glycation of serum proteins, most of which is albumin, and are not affected by shortened red blood cell lifespan, anemia, and usage of erythropoietin (22). The concentrations of GA and GSP were closely correlated with each other, as well as with the level of HbA1c (22,26). Thus, GSP provide an index of glycemic status over the preceding 1 – 2 weeks based on the half-life of serum albumin, and may be helpful for assessment of glycemic control in situations where HbA1c may not be appropriate (22,26). However, little information is available regarding the association of GSP levels and mortality in PD patients with diabetes. In this study, we investigated the effect of HbA1c and GSP on all-cause and cardiovascular mortality in diabetic patients receiving PD therapy.
Methods
Study Setting and Patients
This was a retrospective observational cohort study. Patients were recruited from the PD center at The First Affiliated Hospital, Sun Yat-sen University, from January 1, 2006, to December 31, 2010. The inclusion criteria were: patients received stable PD therapy at least 3 months, were between 18 and 80 years old, HbA1c and GSP data were available, and had no malignant diseases. All patients were followed up until December 31, 2011. The historical medical files of the patients who reported current use of insulin or oral hypoglycemic agents and/or who had a clinical diagnosis of type 1 or type 2 diabetes mellitus before starting PD were evaluated and those meeting the diagnostic criteria of the American Diabetes Association were considered to have diabetes mellitus (27). The diagnosis of diabetic nephropathy as the primary renal disease of the patients was mainly based on clinical experience. The study protocol was approved by the Ethics Committee of The First Affiliated Hospital, Sun Yat-sen University. All participants provided written informed consent before enrollment.
Data Collection and Laboratory Measurements
Baseline demographic data and clinical information, including age, gender, blood pressure, and history of CVD were collected at the initiation of PD. Body mass index was calculated as weight (kg) divided by height (m) squared. A history of CVD was defined as angina pectoris, myocardial infarction, angioplasty, coronary artery bypass, heart failure, and stroke. Hypertension was recorded if the patient was taking antihypertensive drugs or had 2 separate blood pressure measurements ≥ 140/90 mmHg.
Biochemical parameters were collected 3 months after PD was initiated. All parameters were measured in the center laboratory of The First Affiliated Hospital of Sun Yat-sen University. Glycated hemoglobin was measured by the high-performance liquid chromatography [VARIANT II hemoglobin A1c Program, Bio-Rad, USA, reference: 4.4 – 6.4%). Glycated serum proteins were measured with a specific enzymatic method (Genzyme, UK, catalog number 950-0608-00, reference: 122 – 236 μmol/L). The method of correction of GSP by albumin was described as follows: albumin-corrected glycated serum proteins (Alb-GSP) = GSP (μmol/L)/serum albumin (g/L) (28).
Results
Clinical Outcomes
The primary outcome of this study was all-cause, cardiovascular mortality, and non-cardiovascular mortality. Cardiovascular mortality was defined as death due to acute myocardial infarction, atherosclerotic heart disease, cardiomyopathy, cardiac arrhythmia, cardiac arrest, congestive heart failure, intracranial hemorrhage, cerebral infarction, and peripheral vascular disease. If the patients died in any hospital, death certificates were referred to for the exact cause of death, and if the death occurred outside any hospital, experts would obtain a consensus about the cause of death after a comprehensive consideration of the history, recent situations, signs, and symptoms before and after death from the patient's medical records in our center and descriptions provided by family members. In this study, 44 of 64 (69%) patients died in hospital.
Statistical Analysis
Data were presented as mean ± standard deviations or median (inter-quartile range) for continuous variables and number (percentages) for categorical variables. Patients were divided into 4 categories based on HbA1c concentration with 1% increase: ≤ 5.9%, 6.0 – 6.9%, 7.0 – 7.9%, and ≥ 8%. Also, participants were stratified into quartiles of GSP and Alb-GSP levels. Characteristic differences between the HbA1c, GSP, and Alb-GSP groups were tested using Chi-square test for categorical variables, One-Way ANOVA for approximately normally distributed continuous variables, and Kruskal-Wallis test for skewed continuous variables. Correlations were reported as the Pearson correlation coefficient. Cox proportional hazard models were performed to estimate association between HbA1c, GSP and Alb-GSP categories and all-cause, cardiovascular and non-cardiovascular mortality. Besides HbA1c, GSP, and Alb-GSP, covariates with p values < 0.05 in the univariate analysis were used for multivariable Cox proportional models. Multivariable models are presented as case mix results (age, gender, pre-existing CVD, hypertension) and case mix + laboratory-adjustment (hemoglobin, albumin, hyper-sensitive C-reactive protein [hsCRP]). These statistical analyses were performed with SPSS version 13.0 (SPSS, Chicago, IL, USA). Statistical significance was defined as p < 0.05.
Clinical Characteristics and Patient Survival
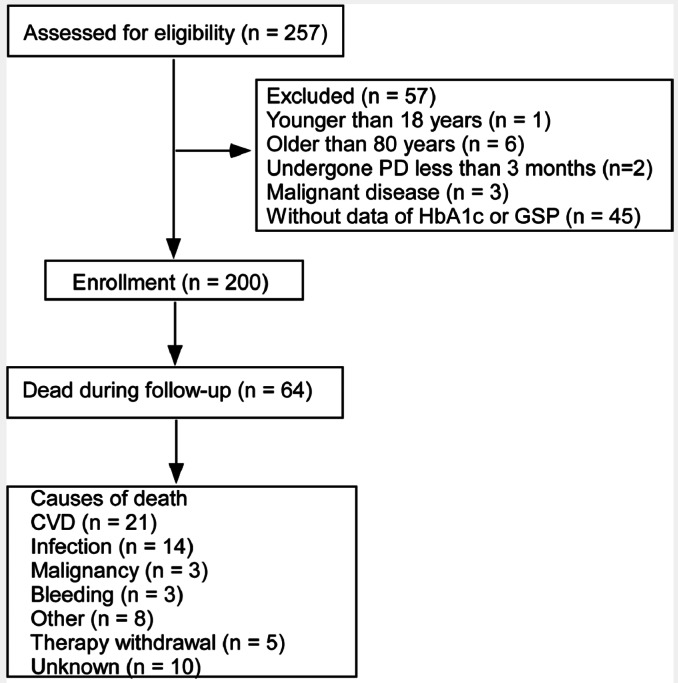
Two hundred patients were recruited in this study (Figure 1). One hundred and ninety-seven (99%) patients had ESRD due to diabetic nephropathy. There were no statistically significant differences in demographic, clinical, and laboratory characteristics between patients with or without HbA1c or GSP data (Supplemental Table 1).
Figure 1 —
Study flow, including patient enrollment, outcomes and causes of death. PD = peritoneal dialysis; HbA1c = glycated hemoglobin; GSP = glycated serum proteins; CVD = cardiovascular disease.
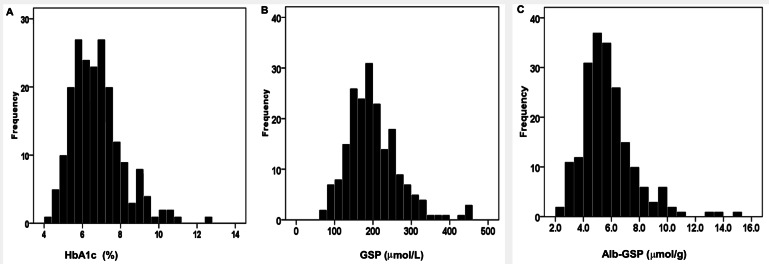
The baseline characteristics of the patients are shown in Table 1. The mean age was 60.3 years (range: 30 – 79 years), 119 (60%) patients were male, and the mean follow-up duration was 29.0 ± 14.6 months (range: 4.4 – 71.5 months). The baseline HbA1c, GSP and Alb-GSP distribution of patients are given in Figure 2 (A – HbA1c, B – GSP, and C – Alb-GSP). Mean values for HbA1c, GSP and Alb-GSP were 6.7%, (range: 4.1 – 12.5%), 202 μmol/L (range: 69 – 460 μmol/L), and 5.78 μmol/g (range: 2.16 – 14.98 μmol/g), respectively. Characteristics of individuals in strata of HbA1c, GSP, and Alb-GSP are shown in Supplemental Tables 2, 3, and 4. There were no statistically significant differences in demographic, clinical, and laboratory characteristics among HbA1c or GSP, or Alb-GSP categories of patients, except that the patients with HbA1c ≥ 8% had a lower rate of hypertension and lower GSP levels were associated with lower serum albumin.
TABLE 1.
Baseline Characteristics of All Patients
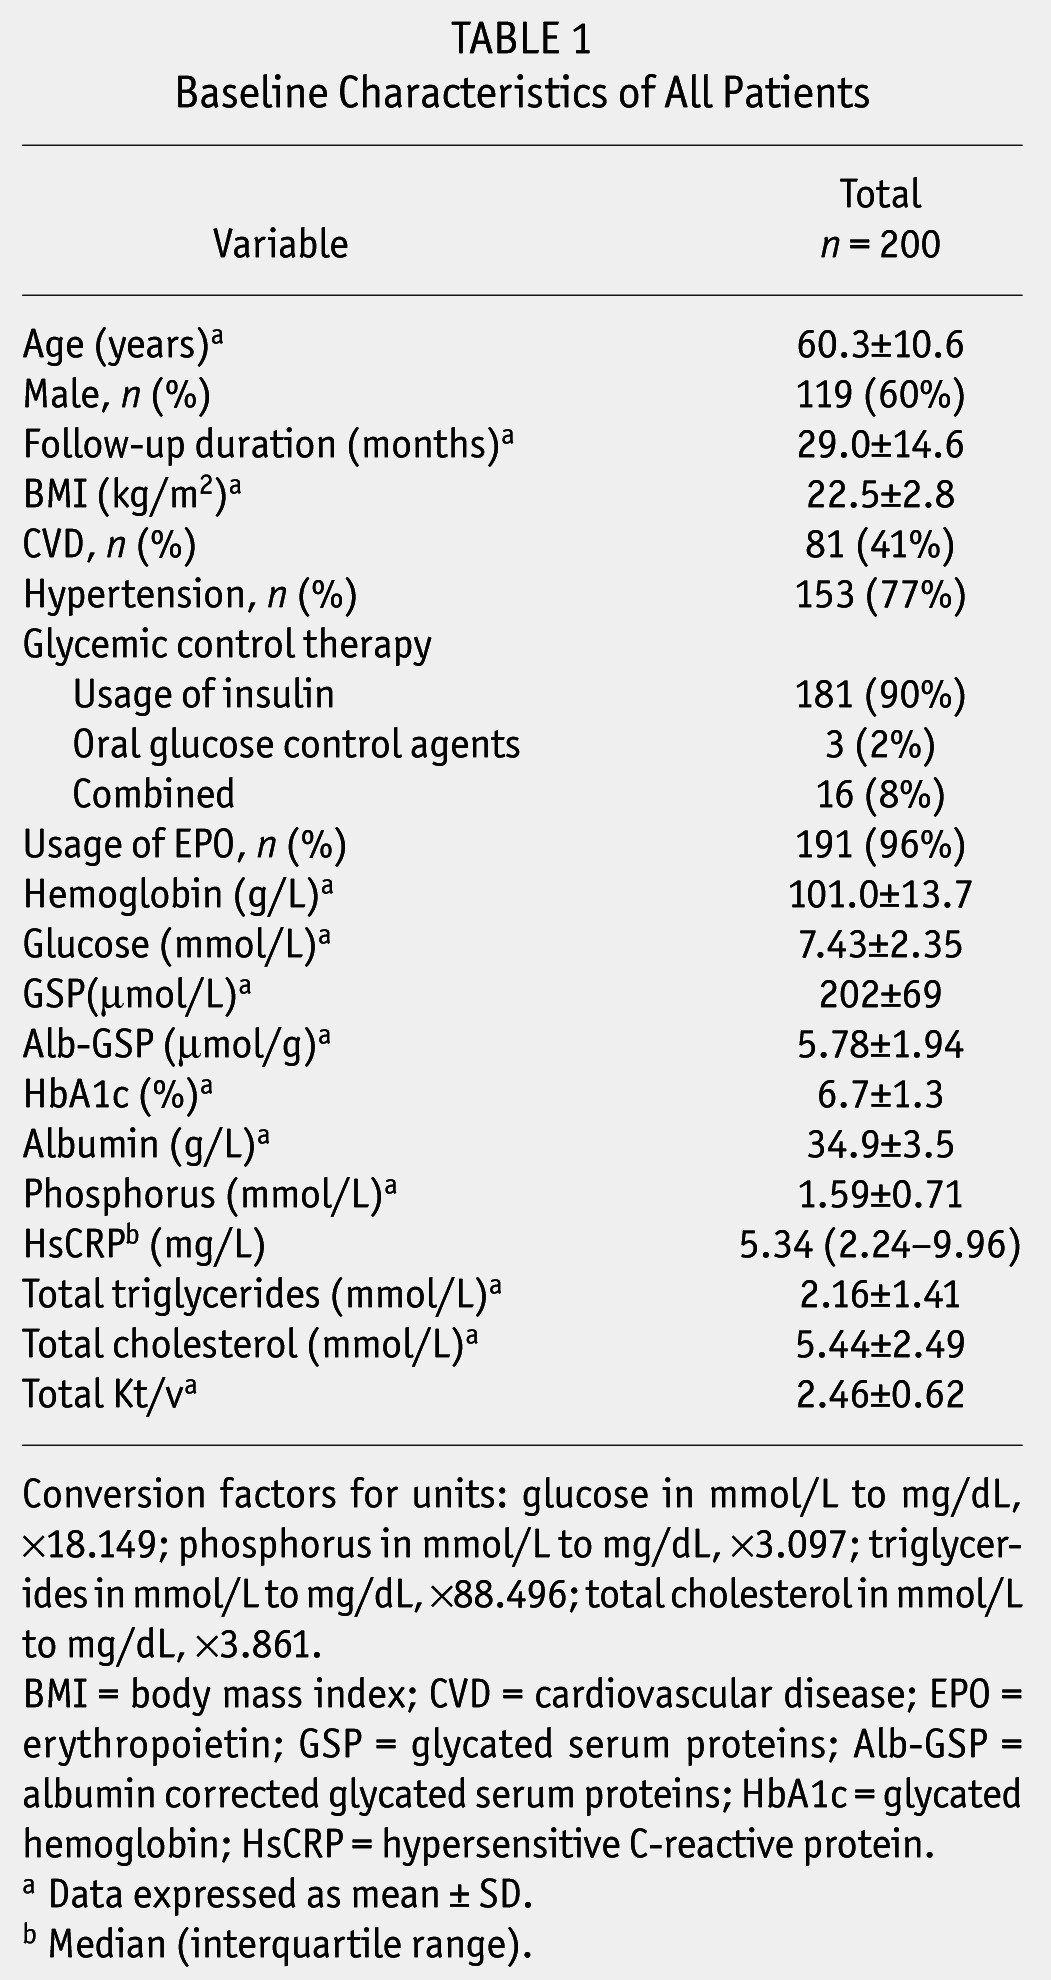
Figure 2 —
Frequency distribution of HbA1c, GSP and Alb-GSP values in diabetic patients receiving peritoneal dialysis. (A) Frequency distribution of glycated hemoglobin. (B) Frequency distribution of glycated serum proteins. (C) Frequency distribution of albumin corrected glycated serum proteins. HbA1c = glycated hemoglobin; GSP = glycated serum proteins; Alb-GSP = albumin-corrected GSP.
During the follow-up period, 64 (32%) patients died, 13 (7%) transferred to hemodialysis, 4 (2%) received kidney transplantation, and 2 (1%) were lost to follow-up. The cumulative survival rates for all patients at 1, 3, and 5 years were 95%, 71%, and 39%, respectively.
The Relationship Between GSP, ALB-GSP and HbA1c
There was a close correlation between GSP and albumin (r = 0.31, p < 0.001, as shown in Figure 3A). Close relationships were observed between the value of GSP, Alb-GSP, and HbA1c values (r = 0.41, p < 0.001 and r = 0.45, p < 0.001, respectively, as shown in Figure 3B, C).
Figure 3 —
Correlation of albumin and glycated hemoglobin with GSP. Relationship between albumin and (A) GSP (correlation coefficient r = 0.31, p < 0.001). Relationship between glycated hemoglobin and (B) GSP (correlation coefficient r = 0.41, p < 0.001) and (C) Alb-GSP (correlation coefficient r = 0.45, p < 0.001). GSP = glycated serum proteins; Alb-GSP = albumin-corrected GSP.
Patient Survival and HbA1c, GSP, ALB-GSP Levels
The causes of death are shown in Figure 1. Overall, CVD (21, 33%) and infection (14, 22%) were the most common causes of death.
Hazard ratios of possible predictive variables for survival for all of the participating patients with diabetes were explored by univariate Cox proportional hazards analysis (Table 2). Age, hemoglobin, hsCRP, albumin, and previous CVD were significant predictive variables for patient survival by univariate analysis.
TABLE 2.
Predicator of Survival with Univariate Cox Proportional Model

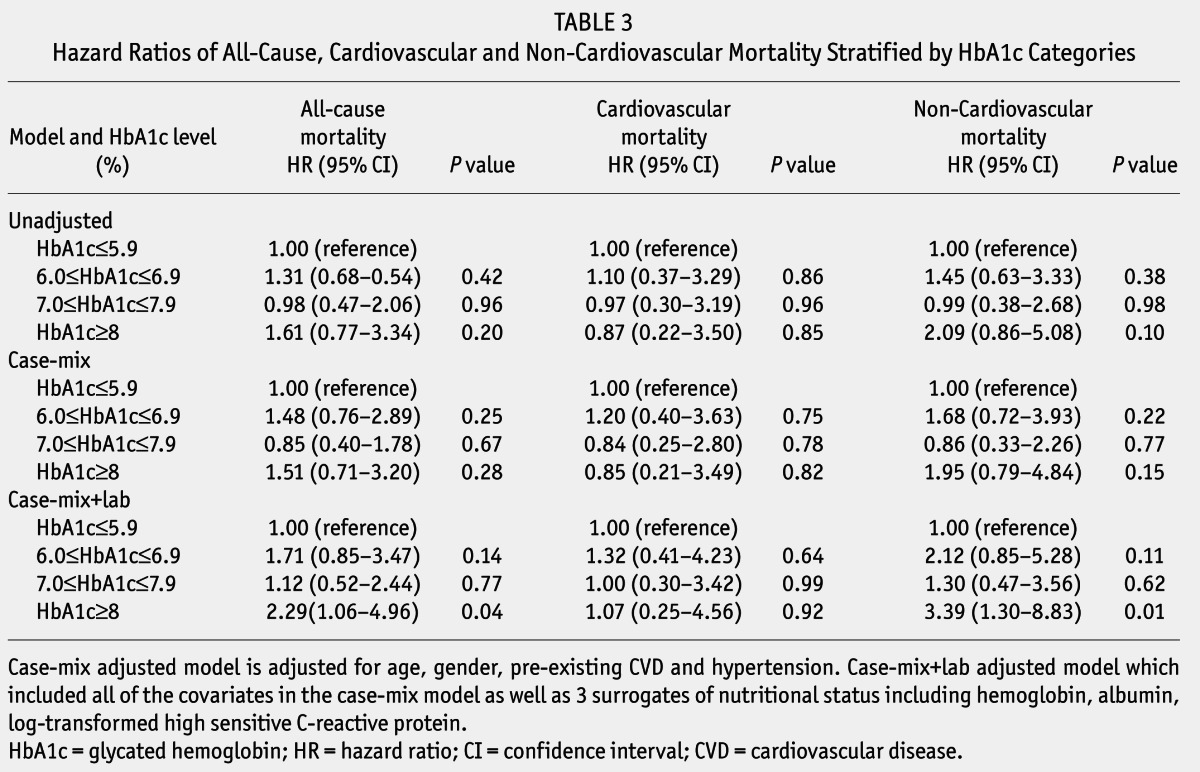
Unadjusted and adjusted HRs of all-cause, CVD, and non-cardiovascular mortality among categories of baseline HbA1c are listed in Table 3. In the unadjusted model, all-cause, CVD and non-cardiovascular mortality were similar among varied levels of baseline HbA1c with no significant difference. After adjustment for age, gender, CVD, and hypertension history in the case-mix model, there was also no statistical significance among all-cause, CVD, and non-cardiovascular mortality of different levels of HbA1c. Additionally, adjustment for hemoglobin, albumin, and log-transformed hsCRP, HRs of all-cause and non-cardiovascular mortality for HbA1c ≥ 8%, were 2.29 (95% confidence interval [CI]: 1.06 – 4.96, p = 0.04), and 3.39 (95% CI: 1.30 – 8.83, p = 0.01), compared with HbA1c ≤ 5.9%. No significant difference in cardiovascular death risk was found among HbA1c categories.
TABLE 3.
Hazard Ratios of All-Cause, Cardiovascular and Non-Cardiovascular Mortality Stratified by HbA1c Categories
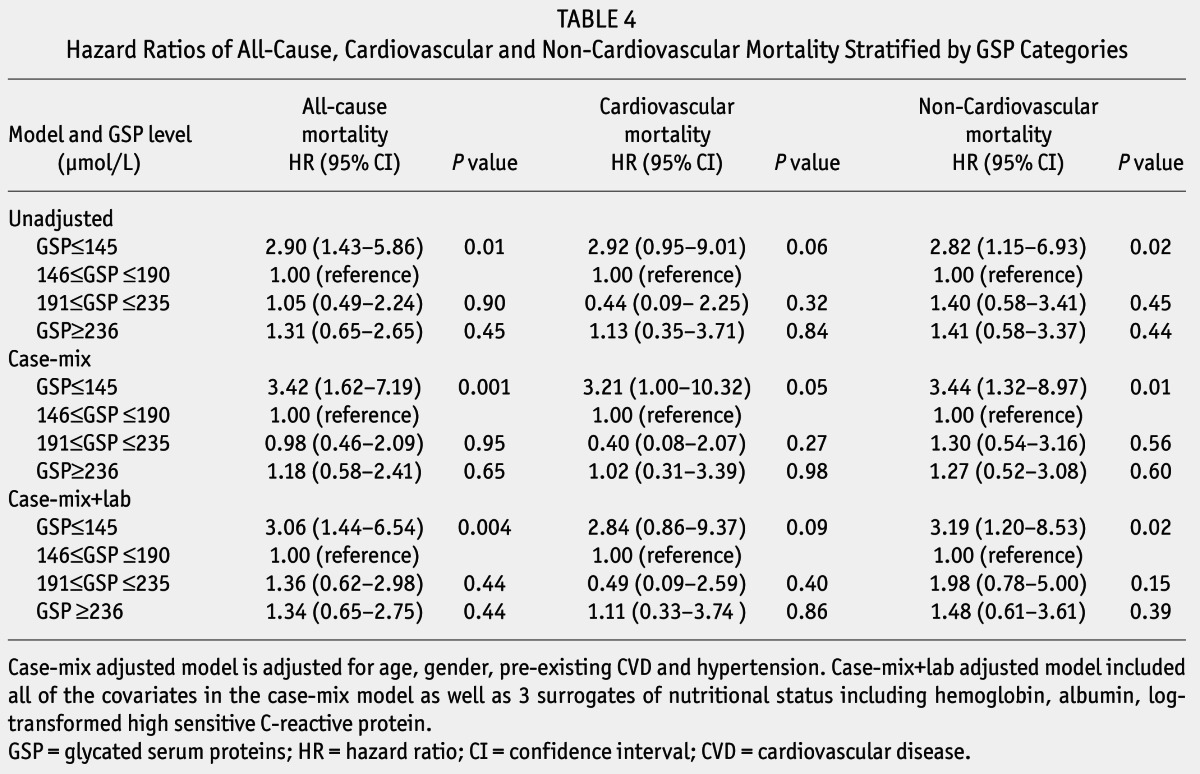
Unadjusted and adjusted HRs of all-cause, CVD, and non-cardiovascular mortality among categories of baseline GSP are listed in Table 4. Adjustment for age, gender, CVD and hypertension history, hemoglobin, albumin, and log-transformed hsCRP in case-mix+lab model, HRs of all-cause and non-cardiovascular mortality for GSP ≤ 145 μmol/L were 3.06 (95% CI: 1.44 – 6.54, p = 0.004), and 3.19 (95% CI: 1.20 – 8.53, p = 0.02), compared with 146 ≤ GSP ≤ 190 μmol/L.
TABLE 4.
Hazard Ratios of All-Cause, Cardiovascular and Non-Cardiovascular Mortality Stratified by GSP Categories
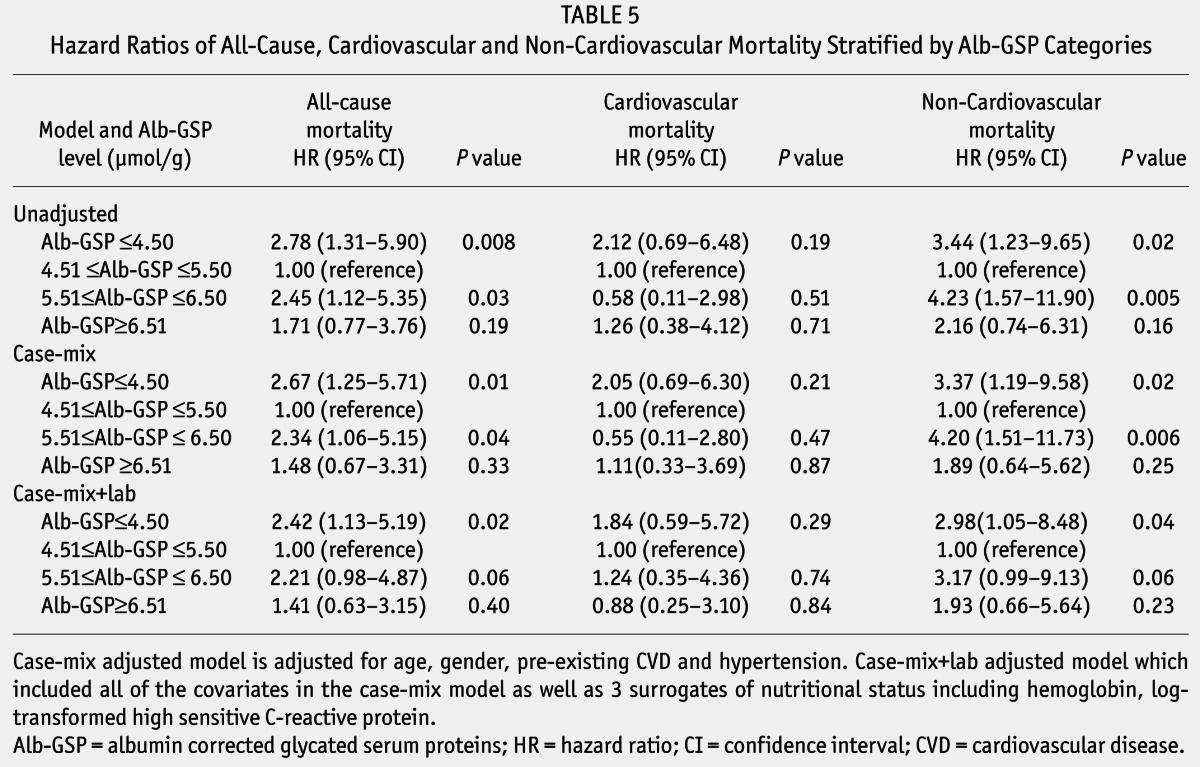
Unadjusted and adjusted HRs of all-cause, CVD, and non-cardiovascular mortality among categories of baseline Alb-GSP are listed in Table 5. In the unadjusted model, all-cause mortality increased in patients with lower (Alb-GSP ≤ 4.50 μmol/g) and higher (Alb-GSP ≥ 5.51 to ≤ 6.50 μmol/g) levels of baseline Alb-GSP, compared with the middle category of Alb-GSP ≥ 4.51 to ≤ 5.50 μmol/g (HR = 2.78, 95% CI: 1.31 – 5.90, p = 0.008, HR = 2.45, 95% CI: 1.12 – 5.35, p = 0.03, respectively). The non-cardiovascular mortality also increased in patients with lower (Alb-GSP ≤ 4.50 μmol/g) and higher (Alb-GSP ≥ 5.51 to ≤ 6.50 μmol/g) levels of baseline Alb-GSP, compared with the middle category of Alb-GSP ≥ 4.51 to ≤ 5.50 μmol/g (HR = 3.44, 95% CI: 1.23 – 9.65, p = 0.02, and HR = 4.23, 95% CI: 1.57 – 11.90, p = 0.005, respectively). After adjustment for age, gender, CVD, and hypertension history in the case-mix model, the difference of all-cause and non-cardiovascular mortality among these 3 groups remained significant. Additionally adjustment for hemoglobin, log-transformed hsCRP, HRs of all-cause and non-cardiovascular mortality for the lower group (Alb-GSP ≤ 4.50 μmol/g) were 2.42, (95% CI: 1.13 – 5.19, p = 0.02), and 2.98 (95% CI: 1.05 – 8.48, p = 0.04) compared with the middle category of Alb-GSP ≥ 4.51 to ≤ 5.50 μmol/g. However, the risk of all-cause mortality and non-cardiovascular mortality in the higher category (Alb-GSP ≥ 5.51 to ≤ 6.50 μmol/g) showed no apparent increase compared with the middle category of Alb-GSP ≥ 4.51 to ≤ 5.50 μmol/g (HR = 2.21, 95% CI: 0.98 – 4.87, p = 0.06 and HR=3.17, 95% CI: 0.99 – 9.13, p = 0.06, respectively). No significant difference in cardiovascular death risk were found among Alb-GSP categories in unadjusted and adjusted models.
TABLE 5.
Hazard Ratios of All-Cause, Cardiovascular and Non-Cardiovascular Mortality Stratified by Alb-GSP Categories
Discussion
In this single-center retrospective observational study, we found that HbA1c ≥ 8% or GSP ≤ 145 μmol/L or Alb-GSP ≤ 4.50 μmol/g was closely related to increased risk of all-cause and non-cardiovascular mortality, after adjustment for confounding factors. These results suggested that risk of death increased in PD patients with severe hyperglycemia (HbA1c ≥ 8%) but no increased mortality in patients with moderate hyperglycemia (7.0% ≤ HbA1c ≤ 7.9%). Moreover, Alb-GSP ≤ 4.50 μmol/g was significantly associated with increased risk of all-cause mortality. However, no significant difference in cardiovascular mortality was found in patients with different levels of glycemic control assessed by HbA1c, GSP and Alb-GSP.
The relationship between glycemic control at baseline and during follow-up and survival in the ESRD population remains debatable. Some studies were unable to detect any association between glycemic control measured by HbA1c and survival (11,17,24,29,30). However, several other studies showed conflicting results that both poor and intensive glycemic control were associated with increased mortality (13,15,18). Conflicting results may be attributed to differences in the race of the study populations, definitions of HbA1c thresholds, and adjustment for confounders. Recently, a meta-analysis including 10 studies showed increased mortality in hemodialysis patients with diabetes who had an HbA1c ≥ 8.5% or ≤ 5.4% (31). The conventional glucose-based solutions with high concentrations of glucose have a well-established role in PD therapy (32). However, the literature is limited to report the relationship between glycemic control and patient survival in diabetic PD patients. Duong et al. studied 2,798 diabetic PD patients and reported increased all-cause mortality in the patients who had time-averaged HbA1c ≥ 8% and non-significant difference in cardiovascular death risk across HbA1c increments (20). Similarly, Yoo et al. showed increased all-cause and non-cardiovascular mortality in 140 diabetic PD patients who had a mean value of quarterly HbA1c ≥ 7.6% (19). In our study, baseline HbA1c ≥ 8% was associated with increased all-cause mortality. The findings reported herein are consistent with these 2 previous findings. However, a retrospective study of 91 diabetic PD patients was unable to demonstrate any associations between baseline or time-averaged HbA1c and patient or PD technique survival (21). This inconsistent result may be due to the relatively small sample size, simple definition of HbA1c groups (< 6.5% and ≥ 6.5%), and no adjustment for laboratory index confounders. Besides, glycemic control was not associated with cardiovascular mortality, the most common cause of death in ESRD patients undergoing dialysis. Consistent with these results, most previous studies had failed to demonstrate that good glycemic control improves cardiovascular survival in patients with a long duration of diabetes (33–35). Most diabetic ESRD patients already have advanced micro-vascular and macro-vascular complications, which may have weakened the effects of glycemic control after initiation of dialysis on cardiovascular mortality. However, glycemic control was closely related to non-cardiovascular death in our study and infection accounted for 33% of the non-cardiovascular death, which is similar to the results reported by Yoo et al. (19). Yet, due to the limited cases of infection-related death in each HbA1c, GSP, and Alb-GSP group, a further relationship between infection-related death and HbA1c, GSP, and Alb-GSP levels was not determined.
Another alternative glycemic index, GSP, was also measured in our study and showed that GSP correlated well with HbA1c. As GSP levels were directly affected by serum albumin concentration, GSP values were corrected for serum albumin. Albumin-corrected glycated serum proteins also correlated well with HbA1c. Moreover, it was found that Alb-GSP ≤ 4.50 μmol/g was significantly associated with increased risk of all-cause and non-cardiovascular mortality. In addition, lower Alb-GSP concentrations were not associated with poorer nutrition, since there was no significant difference in serum albumin levels among Alb-GSP categories (34.0 ± 3.6g/L, 35.1 ± 3.5g/L, 35.4 ± 3.6g/L, and 35.1 ± 3.2g/L in each category respectively, p = 0.21) and other nutrition indexes, such as phosphorus and total triglycerides and cholesterol (Supplemental Table 4). Thus, the measurement of Alb-GSP may provide additional prognostic information beyond HbA1c. It is worth mentioning that Alb-GSP did not show the same direction of effect on the mortality as HbA1c. Though p values were p = 0.06 for all-cause mortality and non-cardiovascular mortality with higher Alb-GSP (Alb-GSP ≥ 5.51 to ≤ 6.50 μmol/g) in case-mix+lab model, the HRs of higher Alb-GSP were greater than 2 and 3, respectively. Higher Alb-GSP may be associated with increased risk of all-cause and non-cardiovascular mortality given a larger sample size. Moreover, some published data may also suggest some potential explanations. Characteristics of Alb-GSP and HbA1c in assessment of glycemic control in dialysis patients may be somewhat different. It was reported that HbA1c significantly underestimated glycemic control in peritoneal and hemodialysis patients (36). However, Mittman et al. showed that albumin-corrected fructosamine was an advantage for patients with lower serum glucose (28). However, there is no research on whether Alb-GSP is more sensitive in patients with lower serum glucose level. Fasting glucose was measured only once in our study, and hypoglycemia reaction and the dose of insulin was not recorded, so it was unknown whether lower Alb-GSP meant intensive glycemic control.
This is the first study to evaluate the relationship between Alb-GSP and patient survival in diabetic ESRD patients. There is literature concerning this issue on other alternative glycemic indices, GA and albumin-corrected fructosamine; these 3 indices all have shorter half-lives than HbA1c and reflect more recent glycemic control (22,37). In addition, these assays are not affected by hemoglobin levels and are minimally affected by shortened red blood cell survival, which are known to influence the levels of HbA1c (22,23). Some data have suggested GA or albumin-corrected fructosamine equal or even superior alternatives to HbA1c in dialysis patients with diabetes (18,19,23,37), but some concluded that HbA1c was the most reliable index and a superior marker of glycemic control (25,38,39). Moreover, the cost of GSP assays was about half that of the A1c test. However, values for GSP vary with changes in the synthesis or clearance of serum proteins that can occur with acute systemic illness or with liver disease (18). The method of correction of GSP by albumin is still under debate, since albumin only accounted for about 70% of serum proteins. More studies are needed to further explore the assessment of glycemic control in GSP on survival in dialysis patients with diabetes.
There were some limitations to our study. First, the number of patients was relatively small and the deaths were few in the cohort. Second, only baseline HbA1c, GSP and Alb-GSP values 3 months after starting PD were used in the analysis, which did not reflect the change of glycemic control during the observation period. Third, all the recruited patients were from a single center in Southern China, so, there may be limited value to other ethnic populations. Fourth, we did not exclude the influences of peritoneal transport rate and dialysis prescription. Large multi-center prospective studies are required to evaluate these findings.
Conclusion
In conclusion, this retrospective observational cohort study of PD patients with diabetes suggested that higher HbA1c and lower Alb-GSP appears to be significantly associated with increased all-cause and non-cardiovascular mortality, with a non-significant trend observed for increased all-cause and non-cardiovascular mortality with the highest levels of Alb-GSP. This association might have reached significance given a larger sample size. Non-significant differences in cardiovascular death risks were found across varied HbA1c or Alb-GSP levels. The target HbA1c levels and multiple indices for assessment of glycemic control need to be further defined in large and multicenter clinical trials to achieve better outcomes in PD patients with diabetes.
Disclosures
The authors have no conflicts of interest to declare.
Supplementary Material
Acknowledgments
We thank all the participants including research PD nurses and patients in our peritoneal dialysis center.
This work was supported by grants from National Natural Science Foundation of China (Grant No. 81170765; 81370908), Guangdong Natural Science Foundation (Grant No. S2011020002359; S2011010005077), National Key Basic Research Program of China (Grant No. 2011CB504005), and National Key Technology Research and Development Program, Ministry of Science and Technology of China (Grant No. 2011BAI10B05).
Footnotes
Supplemental material available at www.pdiconnect.com
REFERENCES
- 1. Xu Y, Wang L, He J, Bi Y, Li M, Wang T, et al. Prevalence and control of diabetes in Chinese adults. JAMA 2013; 310:948–59. [DOI] [PubMed] [Google Scholar]
- 2. de Boer IH, Rue TC, Hall YN, Heagerty PJ, Weiss NS, Himmelfarb J. Temporal trends in the prevalence of diabetic kidney disease in the United States. JAMA 2011; 305:2532–9. [DOI] [PMC free article] [PubMed] [Google Scholar]
- 3. Zuo L, Wang M. Current burden and probable increasing incidence of ESRD in China. Clin Nephrol 2010; 74(Suppl 1):S20–2. [PubMed] [Google Scholar]
- 4. Yang X, Yi C, Liu X, Guo Q, Yang R, Cao P, et al. Clinical outcome and risk factors for mortality in Chinese patients with diabetes on peritoneal dialysis: a 5-year clinical cohort study. Diabetes Res Clin Pract 2013; 100:354–61. [DOI] [PubMed] [Google Scholar]
- 5. Kim YL. Can we overcome the predestined poor survival of diabetic patients? Perspectives from pre- and post-dialysis. Perit Dial Int 2007; 27(Suppl 2):S171–5. [PubMed] [Google Scholar]
- 6. Han SH, Lee JE, Kim DK, Moon SJ, Kim HW, Chang JH, et al. Long-term clinical outcomes of peritoneal dialysis patients: single center experience from Korea. Perit Dial Int 2008; 28(Suppl 3):S21–6. [PubMed] [Google Scholar]
- 7. Chung SH, Noh H, Ha H, Lee HB. Optimal use of peritoneal dialysis in patients with diabetes. Perit Dial Int 2009; 29(Suppl 2):S132–4. [PubMed] [Google Scholar]
- 8. Wu HY, Hung KY, Huang TM, Hu FC, Peng YS, Huang JW, et al. Safety issues of long-term glucose load in patients on peritoneal dialysis—a 7-year cohort study. PLoS One 2012; 7:e30337. [DOI] [PMC free article] [PubMed] [Google Scholar]
- 9. Burkart J. Metabolic consequences of peritoneal dialysis. Semin Dial 2004; 17:498–504. [DOI] [PubMed] [Google Scholar]
- 10. Paniagua R, Ventura MD, Avila-Diaz M, Cisneros A, Vicente-Martinez M, Furlong MD, et al. Icodextrin improves metabolic and fluid management in high and high-average transport diabetic patients. Perit Dial Int 2009; 29:422–32. [PubMed] [Google Scholar]
- 11. McMurray SD, Johnson G, Davis S, McDougall K. Diabetes education and care management significantly improve patient outcomes in the dialysis unit. Am J Kidney Dis 2002; 40:566–75. [DOI] [PubMed] [Google Scholar]
- 12. Nichols GA, Joshua-Gotlib S, Parasuraman S. Glycemic control and risk of cardiovascular disease hospitalization and all-cause mortality. J Am Coll Cardiol 2013; 62:121–7. [DOI] [PubMed] [Google Scholar]
- 13. Shurraw S, Hemmelgarn B, Lin M, Majumdar SR, Klarenbach S, Manns B, et al. Association between glycemic control and adverse outcomes in people with diabetes mellitus and chronic kidney disease: A population-based cohort study. Arch Intern Med 2011; 171:1920–7. [DOI] [PubMed] [Google Scholar]
- 14. Freedman BI, Andries L, Shihabi ZK, Rocco MV, Byers JR, Cardona CY, et al. Glycated albumin and risk of death and hospitalizations in diabetic dialysis patients. Clin J Am Soc Nephrol 2011; 6:1635–43. [DOI] [PubMed] [Google Scholar]
- 15. Kalantar-Zadeh K, Kopple JD, Regidor DL, Jing J, Shinaberger CS, Aronovitz J, et al. A1C and survival in maintenance hemodialysis patients. Diabetes Care 2007; 30:1049–55. [DOI] [PubMed] [Google Scholar]
- 16. Oomichi T, Emoto M, Tabata T, Morioka T, Tsujimoto Y, Tahara H, et al. Impact of glycemic control on survival of diabetic patients on chronic regular hemodialysis: a 7-year observational study. Diabetes Care 2006; 29:1496–500. [DOI] [PubMed] [Google Scholar]
- 17. Shurraw S, Majumdar SR, Thadhani R, Wiebe N, Tonelli M. Glycemic control and the risk of death in 1,484 patients receiving maintenance hemodialysis. Am J Kidney Dis 2010; 55:875–84. [DOI] [PubMed] [Google Scholar]
- 18. Williams ME, Lacson EJ, Wang W, Lazarus JM, Hakim R. Glycemic control and extended hemodialysis survival in patients with diabetes mellitus: comparative results of traditional and time-dependent Cox model analyses. Clin J Am Soc Nephrol 2010; 5:1595–601. [DOI] [PMC free article] [PubMed] [Google Scholar]
- 19. Yoo DE, Park JT, Oh HJ, Kim SJ, Lee MJ, Shin DH, et al. Good glycemic control is associated with better survival in diabetic patients on peritoneal dialysis: a prospective observational study. PLoS One 2012; 7:e30072. [DOI] [PMC free article] [PubMed] [Google Scholar]
- 20. Duong U, Mehrotra R, Molnar MZ, Noori N, Kovesdy CP, Nissenson AR, et al. Glycemic control and survival in peritoneal dialysis patients with diabetes mellitus. Clin J Am Soc Nephrol 2011; 6:1041–8. [DOI] [PMC free article] [PubMed] [Google Scholar]
- 21. Sekercioglu N, Dimitriadis C, Pipili C, Elias RM, Kim J, Oreopoulos DG, et al. Glycemic control and survival in peritoneal dialysis patients with diabetes mellitus. Int Urol Nephrol 2012; 44(6):1861–9. [DOI] [PubMed] [Google Scholar]
- 22. Goldstein DE, Little RR, Lorenz RA, Malone JI, Nathan DM, Peterson CM. Tests of glycemia in diabetes. Diabetes Care 2003; 26(Suppl 1):S106–8. [DOI] [PubMed] [Google Scholar]
- 23. Inaba M, Okuno S, Kumeda Y, Yamada S, Imanishi Y, Tabata T, et al. Glycated albumin is a better glycemic indicator than glycated hemoglobin values in hemodialysis patients with diabetes: effect of anemia and erythropoietin injection. J Am Soc Nephrol 2007; 18:896–903. [DOI] [PubMed] [Google Scholar]
- 24. Fukuoka K, Nakao K, Morimoto H, Nakao A, Takatori Y, Arimoto K, et al. Glycated albumin levels predict long-term survival in diabetic patients undergoing haemodialysis. Nephrology (Carlton) 2008; 13:278–83. [DOI] [PubMed] [Google Scholar]
- 25. Rocco MV, Berns JS. KDOQI Clinical Practice Guideline for Diabetes and CKD: 2012 Update. Am J Kidney Dis 2012; 60:850–86. [DOI] [PubMed] [Google Scholar]
- 26. Schleicher E, Wieland OH. Protein glycation: Measurement and clinical relevance. J Clin Chem Clin Biochem 1989; 27:577–87. [PubMed] [Google Scholar]
- 27. Report of the expert committee on the diagnosis and classification of diabetes mellitus. Diabetes Care 1997; 20:1183–97. [DOI] [PubMed] [Google Scholar]
- 28. Mittman N, Desiraju B, Fazil I, Kapupara H, Chattopadhyay J, Jani CM, et al. Serum fructosamine versus glycosylated hemoglobin as an index of glycemic control, hospitalization, and infection in diabetic hemodialysis patients. Kidney Int Suppl 2010:S41–5. [DOI] [PubMed] [Google Scholar]
- 29. Okada T, Nakao T, Matsumoto H, Shino T, Nagaoka Y, Tomaru R, et al. Association between markers of glycemic control, cardiovascular complications and survival in type 2 diabetic patients with end-stage renal disease. Intern Med 2007; 46:807–14. [DOI] [PubMed] [Google Scholar]
- 30. Shima K, Komatsu M, Kawahara K, Minaguchi J, Kawashima S. Stringent glycaemic control prolongs survival in diabetic patients with end-stage renal disease on haemodialysis. Nephrology (Carlton) 2010; 15:632–8. [DOI] [PubMed] [Google Scholar]
- 31. Hill CJ, Maxwell AP, Cardwell CR, Freedman BI, Tonelli M, Emoto M, et al. Glycated hemoglobin and risk of death in diabetic patients treated with hemodialysis: a meta-analysis. Am J Kidney Dis 2013. [DOI] [PubMed] [Google Scholar]
- 32. Garcia-Lopez E, Lindholm B, Davies S. An update on peritoneal dialysis solutions. Nat Rev Nephrol 2012; 8:224–33. [DOI] [PubMed] [Google Scholar]
- 33. Gerstein HC, Miller ME, Byington RP, Goff DJ, Bigger JT, Buse JB, et al. Effects of intensive glucose lowering in type 2 diabetes. N Engl J Med 2008; 358:2545–59. [DOI] [PMC free article] [PubMed] [Google Scholar]
- 34. Duckworth W, Abraira C, Moritz T, Reda D, Emanuele N, Reaven PD, et al. Glucose control and vascular complications in veterans with type 2 diabetes. N Engl J Med 2009; 360:129–39. [DOI] [PubMed] [Google Scholar]
- 35. Patel A, MacMahon S, Chalmers J, Neal B, Billot L, Woodward M, et al. Intensive blood glucose control and vascular outcomes in patients with type 2 diabetes. N Engl J Med 2008; 358:2560–72. [DOI] [PubMed] [Google Scholar]
- 36. Freedman BI, Shenoy RN, Planer JA, Clay KD, Shihabi ZK, Burkart JM, et al. Comparison of glycated albumin and hemoglobin A1c concentrations in diabetic subjects on peritoneal and hemodialysis. Perit Dial Int 2010; 30:72–9. [DOI] [PubMed] [Google Scholar]
- 37. Peacock TP, Shihabi ZK, Bleyer AJ, Dolbare EL, Byers JR, Knovich MA, et al. Comparison of glycated albumin and hemoglobin A(1c) levels in diabetic subjects on hemodialysis. Kidney Int 2008; 73:1062–8. [DOI] [PubMed] [Google Scholar]
- 38. Nunoi K, Kodama T, Sato Y, Iwase M, Yoshizumi H, Kurimoto H, et al. Comparison of reliability of plasma fructosamine and glycosylated hemoglobin assays for assessing glycemic control in diabetic patients on hemodialysis. Metabolism 1991; 40:986–9. [DOI] [PubMed] [Google Scholar]
- 39. Browner WS, Pressman AR, Lui LY, Cummings SR. Association between serum fructosamine and mortality in elderly women: the study of osteoporotic fractures. Am J Epidemiol 1999; 149:471–5. [DOI] [PubMed] [Google Scholar]
Associated Data
This section collects any data citations, data availability statements, or supplementary materials included in this article.


