

Abstract
Racial disparity in family incomes remained remarkably stable over the past 40 years in the United States despite major legal and social reforms. Previous scholarship presents two primary explanations for persistent inequality through a period of progressive change. One highlights continuity: because socioeconomic status is transmitted from parents to children, disparities created through histories of discrimination and opportunity denial may dissipate slowly. The second highlights change: because family income results from joining individual earnings in family units, changing family compositions can offset individuals’ changing economic chances. I examine whether black-white family income inequality trends are better characterized by the persistence of existing disadvantage (continuity) or shifting forms of disadvantage (change). I combine cross-sectional and panel analysis using Current Population Survey, Panel Study of Income Dynamics, Census, and National Vital Statistics data. Results suggest that African Americans experience relatively extreme intergenerational continuity (low upward mobility) and discontinuity (high downward mobility); both helped maintain racial inequality. Yet, intergenerational discontinuities allow new forms of disadvantage to emerge. On net, racial inequality trends are better characterized by changing forms of disadvantage than by continuity. Economic trends were equalizing but demographic trends were disequalizing; as family structures shifted, family incomes did not fully reflect labor-market gains.
Keywords: inequality, mobility, race, demography
In 1968, just following the height of the civil rights struggle and the year of Martin Luther King Jr.’s assassination, African American families’ median income was 60 percent as large as white families’ median income. In 2008, it remained 60 percent as large (U.S. Census Bureau 2010). Despite the introduction of affirmative action in education and hiring and anti-discrimination policies in the private and public sectors, median black family income remained around two-thirds the size of median white family income throughout the twentieth century and into the twenty-first (Isaacs 2008; Loury 1977). While racial disparity at the center of the income distribution endured through a period of progressive reforms, important shifts occurred in the bottom half. A rising African American middle class appeared, leaving a persistent yet proportionately smaller lower class (Landry 1988; Wilson 1987).
Previous scholarship presents two leading explanations for inequality’s maintenance despite improved opportunities for the black middle class: the persistence of low income across generations, and the development of countervailing trends promoting labor-market equality but family-structure inequality. The first explanation highlights continuity: families’ socioeconomic situations persist because the cultural and material resources available to children shape their labor- and marriage-market prospects. Historical legacies of disadvantage may linger because “rags to riches” feats are rare. However, inequality can also be maintained by discontinuity. If economic advantages dissipate across generations—leaving children downwardly mobile—then broad-based trends in the economy and family may exert more pressure on racial inequality trends than does continuity within families. Thus, the second explanation highlights change: because family income results from joining individual earnings in family units, changes in family composition can offset shifts in individuals’ economic chances. Racial inequality may have persisted because the share of single-parent families rose especially quickly among African Americans; as the pooling of men’s and women’s resources became less frequent, family incomes may not have fully reflected labor-market gains.
This article examines whether recent trends in black-white family income inequality are better characterized by the persistence of existing disadvantage (continuity) or shifting forms of disadvantage (change), attending to racial differences across the economic spectrum. The analysis makes four primary contributions. First, in examining the role of continuity in black-white inequality trends, the analysis moves beyond micro-level insights to investigate macro-level dynamics. Previous scholarship on intergenerational continuity has focused almost exclusively on individual-level associations between parents and children (Mare 2011); this article explores the implications of these associations for aggregate racial inequality trends. Second, in examining the role of change, the analysis formalizes and quantifies how countervailing economic and demographic trends prolong racial disparities. While social demographers have recognized that trends in family income inequality can be traced to changes in how workers earn wages and pool their wages in families (Martin 2006), this perspective has not been applied to study recent racial inequality trends. Third, while previous research has summarized racial inequality by comparing the central tendencies (means or medians) or lower tails (poverty) of income distributions, this article compares across the economic spectrum to obtain more detailed pictures of black and white Americans’ relative well-being.
Finally, by exploring models of both continuity and change, this study provides insight into the relative contributions of intergenerational transmission patterns and broad-based labor-market and family-structure shifts to racial inequality trends over the past 40 years. These models provide descriptive demographic representations of how populations evolve; they do not provide direct insight into the many complex causal relationships sustaining racial inequality. Instead, they provide stylized facts about the population dynamics underlying observed inequality trends, facts with both theoretical and policy implications. Theoretically, a large intergenerational contribution to persistent racial disparity should steer sociologists to better understand how inequality is reproduced within families. Previous research has documented the magnitudes of intergenerational associations without unpacking how their drivers differ by race (Breen and Jonsson 2005; Hertz 2004). If offsetting trends are the hallmark of enduring racial inequality, future investigations should explore feedbacks between labor-market and family changes. The current analysis examines their joint impact, but future research might explicitly examine how they shape one another, breaking with current sociological practice of examining stratification domains independently (Reskin 2012). Politically, if intergenerational legacies play a large role in maintaining inequality, policies aimed at promoting opportunities should focus on family dynamics. If not, policies should be pitched broadly, addressing the opportunities of children from disadvantaged demographic groups regardless of family background. Jointly considering continuity and change also reveals important differences in the speed of economic and demographic change. Income may persist across generations while family structure shifts more rapidly.
This article studies the maintenance of racial disparities in family income over a period of major social change. Using Panel Study of Income Dynamics data, I examine intergenerational income and family-structure transmission. I add fertility and mortality data from decennial Censuses and National Vital Statistics to explore how micro-level transmission patterns shaped macro-level population trends. Using March Current Population Survey data, I examine how changing family structures and changing income distributions within family structures contributed to inequality trends. Together these analyses reveal how continuity and change in economic and demographic processes helped maintain racial disparities.
RACIAL INEQUALITY TRENDS
Median and mean income disparity between black and white families remained remarkably stable in the four decades after 1968 (see Figure 1). Yet, this lack of convergence in central tendencies hides non-negligible change elsewhere in the income distribution. Racial disparities persisted or slightly increased at the top (black families at the 80th and 95th income percentiles lost some ground relative to their white counterparts). Yet progress is evident toward the bottom. The 20th and 40th percentiles of black family income pulled closer to the corresponding white percentiles. At all percentiles, substantial racial inequality remains, and it is greatest among the worst-off (black-white income ratios decline as you move down the distribution; see Figure 1). However, slow and uneven progress in the lower half of the distribution reflects improvements in some African Americans’ relative economic well-being.
Figure 1.
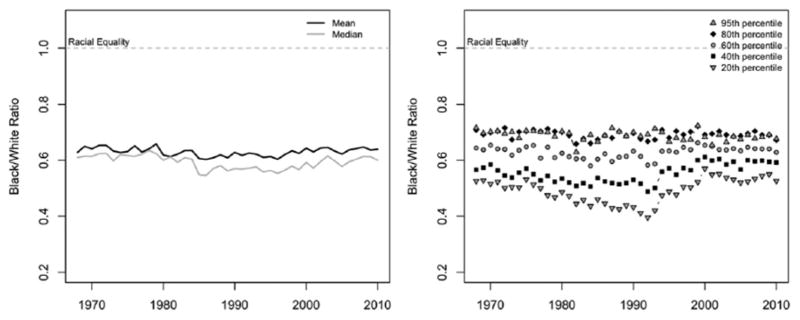
Black Family Income as a Share of White Family Income, Comparing Means and Medians (left) and Percentiles across the Family Income Distribution (right)
Source: March Current Population Survey data.
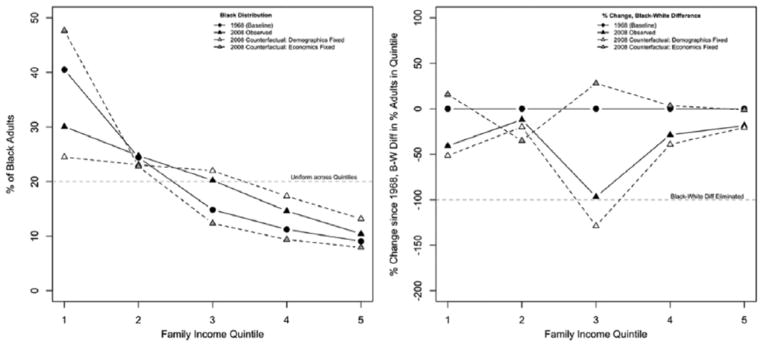
The burgeoning black middle class increased inequality among African Americans, reducing their concentration in the lower income quintiles. In 1968, African Americans composed a greatly disproportionate share of the poorest 20 percent of U.S. adults, but over time their share declined. Between 1968 and 2008, the percentage of black adults with family incomes in the lowest quintile dropped about 10 points, from about 40 to 30 percent (see Figure 2). Most of the shift accumulated to the third quintile, although small gains also appeared in the upper quintiles. These changes eliminated racial disparities in the probability of being middle income (a member of the middle income quintile) and reduced disparities in the probability of being lower income (a member of the bottom income quintile) by about 40 percent. Disparities were reduced by only about 18 percent at the top, in terms of the difference in black and white adults’ probabilities of falling into the highest income quintile. Within each quintile, African American income is, on average, lower than white income. Thus, substantial inequality remains despite nonnegligible convergence in the relative economic standings of black and white adults. Are these racial inequality trends better characterized by the intergenerational persistence of income and family structure (prolonging historical forms of disadvantage through processes of continuity) or by economic and demographic changes (prolonging inequality through shifting forms of disadvantage)?
Figure 2.
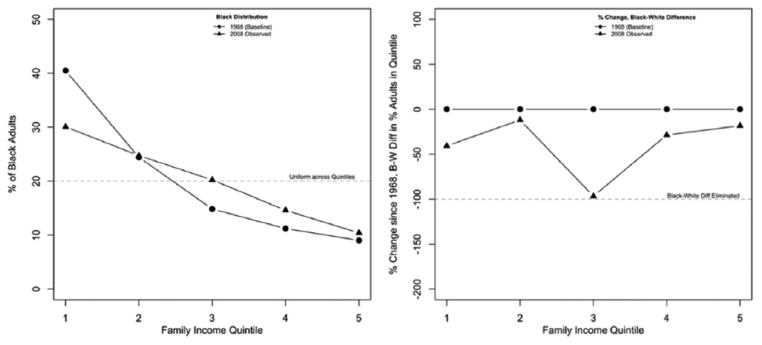
Observed Distribution of Black Adults across Family Income Quintiles (left) and Observed Percent Change between 1968 and 2008 in the Distributional Differences between Black and White Adults (right)
Source: March Current Population Survey data.
INTERGENERATIONAL CONTINUITY: SOCIOECONOMIC MOBILITY AND POPULATION DYNAMICS
How inequality between demographic groups persists—even as the individuals composing these groups change and the social environment evolves—constitutes a fundamental sociological puzzle. For over a century, scholars have studied how socioeconomic status endures across generations on the hypothesis that family dynamics reproduce inequality (Ganzeboom, Treiman, and Ultee 1991; Hout 2004). While intergenerational research emphasizes continuity, discontinuity may also reproduce racial inequality if class advantages disappear more rapidly among African American than white families. Because intergenerational research remains largely disconnected from research on inequality trends (Mare 2001), scholars have not explored how intergenerational continuity and discontinuity slowed racial convergence in family income in recent decades. Addressing this issue, I examine how the micro-level processes linking parents and children shaped macro-level inequality dynamics.
Moving from Micro to Macro
Moving from micro- to macro-level inference requires studying (1) the initial distribution of socioeconomic positions and (2) how these positions endure. Historical disparities may persist due to the large proportion of African American children born into poverty combined with the low probability of “rags to riches” feats. Disparities may also persist through intergenerational discontinuity, if the black middle class struggles to maintain its advantages.
Past discrimination and opportunity denial created large differences between black and white families’ incomes. When parents’ resources affect children’s ability to accumulate resources, intergenerational continuity reproduces inequality, because proportionately more black children inherit poor backgrounds, reducing their chances of high income as adults (Loury 1977). The degree of mobility governs how long initial inequalities endure. If upward mobility is high, then initial racial disparities dissipate quickly. If not, disparities linger due to the continuity of low income. Conversely, if downward mobility is high, then disparities among black families may disappear quickly while disparities between blacks and whites persist.
Group differences in initial socioeconomic positions join with group differences in how these positions endure to perpetuate racial inequality. The former differences reflect historical discrimination while the latter may reflect ongoing discrimination (Lieberson and Fuguitt 1967). Three factors determine how family income endures: income mobility, family formation, and demographic metabolism (fertility and mortality).
How Positions Endure
Income mobility
Racial income disparities may be especially persistent when income mobility patterns vary by race, for two reasons. First, if it is particularly difficult for African American children to escape low incomes, then the frequency of low-income African American adults will be higher than expected based on racial inequality in family background alone. In fact, about half of black children but only one-fourth of white children raised in the bottom income quintile remain there as adults; African Americans’ upward percentile gains are also smaller (Isaacs 2008; Mazumder 2008). These intergenerational dynamics prolong inequality.
Second, if upper- or middle-class income is especially difficult to maintain across generations for African Americans, then racial inequality may persist because advantages do not build easily over time. In this case, the role of family continuity in maintaining inequality might be small. As Wilson (1978) predicted, class has become an important factor differentiating African Americans’ life chances. The first Occupational Change in a Generation (OCG) survey showed that as of 1962, family background had almost no relationship with adult socioeconomic status among African Americans (Blau and Duncan 1967). As Hout (1984:308) states, “blacks were poor not because they were born into poverty but because they were born black.” By the 1973 OCG survey, family background effects had emerged (Featherman and Hauser 1976; Hout 1984). Children from relatively well-off families drove black progress, increasing income persistence. Nevertheless, today’s class differentiation is less stable among blacks than among whites. Black children are about three times more likely than white children to be downwardly mobile from the middle class, and asymmetry in the size of upward and downward moves—making downward mobility more costly on average than upward mobility is beneficial—is more pronounced for blacks than for whites (Hertz 2004; Isaacs 2008). These differences suggest that, although intergenerational continuity shapes how racial inequality trends evolve, discontinuity is also prevalent. Continuity may be less important than trends affecting African Americans broadly, regardless of family background.
Family formation
Family structure has historically been ignored in intergenerational mobility studies, which typically compare fathers and sons. Today, we must consider it for two reasons. First, to accurately define children’s backgrounds when spouses increasingly sort on socioeconomic characteristics (Mare and Schwartz 2006), we cannot ignore mothers’ incomes (Beller 2009; see also Preston and Campbell 1993). Like Musick and Mare (2004), who examine poverty transmission with family income-to-needs, I account for marital sorting by considering total family income.
Second, we should study family formation if it shapes income transmission. Evidence suggests that single-parent families’ low incomes may persist because marital status persists across generations (Amato 1996; Musick and Mare 2006) and because parental absence weakens the processes that reproduce socioeconomic advantages (Björklund and Chadwick 2003; Martin 2012). Overall mobility rates are higher for children from one-parent families because they experience more downward mobility (Biblarz and Raftery 1993). Family structure partially explains racial gaps in income mobility (DeLeire and Lopoo 2010; Mazumder 2008). African American children’s disproportionate residence outside two-parent homes may undermine progress toward income equality. Yet, as with racial differences in downward income mobility, family structure differences may make continuity across generations less important for maintaining income disparities than are forces that broadly affect African Americans.
Demographic metabolism
Finally, at the population level, intergenerational socioeconomic persistence depends on forces of demographic metabolism such as fertility and mortality (not only micro-level income and family-structure associations). Crudely, we can attribute social classes’ changing demographic compositions to migration, birth, and death.1 Intergenerational transmission rates govern migration (in closed populations). The population impact of these transmission rates depends on the number of children exposed to each rate who survive into adulthood. This number is jointly determined by adults’ initial socioeconomic positions, fertility (incorporating new entrants via birth), and mortality.
Fertility differentials by race and class might slow progress toward racial equality in family incomes because proportionately more African American children are born into low-income households and thus experience low upward mobility rates.2 However, the magnitude of these fertility effects may be small, due to generally high mobility (Garfinkel et al. 1991; Preston 1974).3 Although mortality is a fundamental demographic force akin to fertility, few studies have incorporated it into models of evolving population distributions (Mare 1996 and 1997 are exceptions). The great majority of U.S. residents survive through their childbearing years. Consequently, even large racial differences in mortality through most of the lifespan fail to generate important differences in survival (due to low baseline mortality rates at young ages), and survival is the quantity of interest for population transformations.
Inevitably Slow Convergence?
In summary, initial racial differences in socioeconomic positions combine with racial differences in these positions’ intergenerational persistence—driven by differences in income transmission, family formation, and demographic rates—to determine how black-white family income inequality evolves. From this perspective, the speed of racial convergence in family incomes depends on the pace of intergenerational advancement. I explore the extent to which slow socioeconomic convergence in the post-civil rights era can be understood as the outgrowth of economic and demographic continuity across generations.
POPULATION CHANGE: ECONOMIC AND DEMOGRAPHIC TRENDS
Rather than historical patterns of disadvantage slowly dissipating across generations, large changes in these patterns may better characterize recent trends in black-white family income inequality. Differential shifts in the labor market and the family, where workers earn and combine their earnings, could generate moderate change in aggregate black-white family income inequality but substantial change in the underlying inequality patterns. Prior research on trends in economic inequality between races has principally focused on men’s earnings (e.g., Semyonov and Lewin-Epstein 2009; Smith and Welch 1989) and employment (e.g., Holzer 1994; Western 2006). I extend prior work by capturing how trends in men’s labor-market experiences joined with trends in the family—including women’s labor-market experiences and the pooling of men’s and women’s earnings in different family structures—to shape black-white disparities in total economic well-being.
Labor Market Shifts among Men and Women
Research on black men’s relative economic standing reveals a generally progressive, although uneven, trend. Prior to the late 1960s, legalized racial inequality circumscribed opportunities for African American advancement and ensured economic disparities. Nevertheless, men’s wages converged across races between 1940 and 1960, although convergence speed increased after 1960 compared to the prior decade (Smith and Welch 1989). The dismantling of inequality’s legal basis generated occasions for African Americans to improve their circumstances. However, shifts in the country’s economic base and reduced government commitment to anti-discrimination initiatives hindered progress toward economic parity (Wilson 2012). Black-white gaps in men’s wages and employment fell through 1970 but rose again from the mid-1970s to the late-1980s (Jaynes and Williams 1989; Welch 2003). In the 1970s, the economy began polarizing; jobs for mid-skilled employees gave way to low-skilled service positions and high-skilled positions requiring college education (Autor, Katz, and Kearny 2006). Industries where many black men earned stable wages declined, and long histories of oppression ensured that many were ill-prepared to compete in the new (and still racialized) economy (Wilson 1978, 1996). Government retreat from anti-discrimination initiatives in the 1980s also undermined equality, as these programs benefited black workers via public-sector employment and equal-opportunity statutes (Cancio, Evans, and Maume 1996; Pomer 1986).
Simultaneously, women’s labor-market positions shifted substantially, although this is often overlooked in sociological explanations of trends in economic inequality by race (Eggebeen and Lichter 1991 provide an exception). Labor-force participation increased, notably among women traditionally least-attached to paid labor, married mothers of young children (Cohany and Sok 2007). Within married-couple families, wives’ earnings contribution rose (Burtless 1999), potentially offsetting some of black men’s stalled economic progress. Understanding trends in the relative economic well-being of African Americans and whites thus requires considering men’s and women’s experiences jointly. While some research documents wage differences by race and gender (Browne and Misra 2003), rigorous documentation of racial disparity in family income has been scarce. This is surprising for two reasons. First, family income is a better indicator of material well-being than are individual wages, given joint labor-supply decisions and intrafamilial resource sharing. Second, studying families constitutes an important sociological contribution to standard labor-market theories of inequality (Esping-Andersen 2007). By studying wages instead of family income, sociologists have not fully documented how the labor market and family together maintain racial inequality.
Family Change and Economic Consequences
Black and white men’s wages converged through the 1960s and 1970s before stalling; women’s increased labor-force participation and wages could have bolstered black families’ economic progress. However, demographic trends may have interfered, as marriage prevalence declined.
Men’s and women’s economic experiences intersect in the family unit. Marriage rates fell as female labor-force participation rose (Kearney 2006). Fewer families gained income from dual earners than otherwise might have and, given high poverty rates among female-headed households, more fell into low-income demographic groups. The decline in married-parent families’ prevalence over the past 40 years was steeper for African American children than for white children (McLanahan and Percheski 2008). Diverging family structures may have exacerbated family-income disparities despite some progressive labor-market trends. These demographic and economic trends were not independent. Family structures may have changed in response to changing economic fortunes. For example, women’s incentive to marry or remain married to low-earning men may have declined (Edin and Kefalas 2005; Ellwood and Jencks 2004; Hannan and Tuma 1990). If so, demographic change would be responsible in a proximate rather than fundamental sense for slowing racial convergence in family income.
This study documents how economic and demographic trends worked together to maintain black-white family income inequality, potentially changing the form of racial disadvantage even as the level remained high. To capture how changes in men’s and women’s incomes and their pooling in families of changing compositions influenced inequality trends, I draw on two simple facts. First, for any race at any time point, the population income distribution depends on the income distributions within family-type subgroups (economic effects). Second, the larger a subgroup’s population share, the larger its impact on the overall population income distribution (demographic effects). Demographers have harnessed these facts to study economic and demographic contributions to trends in earnings inequality (Karoly and Burtless 1995), family income inequality (Martin 2006), and poverty (Lichter, Qian, and Crowley 2005). While several studies examine trends by race, few analyze their implications for racial disparities. Notable exceptions include the work of Daniel Lichter and his coauthors (e.g., Eggebeen and Lichter 1991; Lichter and Eggebeen 1994; Qian, Lichter, and Crowley 2010). These studies focus on disparities in child poverty, rather than overall adult economic well-being, and generally cover a short period (1990 to 2000, although Eggebeen and Lichter [1991] study child poverty from 1960 to 1988). In this study, I examine how racially differentiated shifts in the economy and family changed the form of racial inequality since the late 1960s.
DATA, MEASURES, AND METHODS
I combine March Current Population Survey (CPS) (King et al. 2010), Panel Study of Income Dynamics (PSID 2010), decennial Census (Ruggles et al. 2010), and National Vital Statistics (NVS) (National Vital Statistics System 2010a, 2010b, 2010c) data to study whether recent trends in black-white family income inequality are better characterized by intergenerational continuity or period-specific change in the economy and family. The basic logic of the analysis follows: I begin with information on black and white family incomes from the baseline year of 1968. I then model how these income distributions are expected to evolve, employing different assumptions about the roles of continuity and change. Finally, I compare the simulated income distributions with the observed distributions from 2008 to assess how well each model characterizes the true racial inequality trends. Different assumptions about the roles of continuity and change require different data and models; models differ in how they simulate the evolution of the black and white distributions. Yet, the continuity and change models share the same logic and measures. Their findings can thus be compared easily. I next introduce the data and measures used to describe observed inequality trends and then detail the continuity and change models.
Describing Inequality Trends with the CPS
The CPS furnishes information on black and white Americans’ economic and demographic situations via annual nationally representative samples of approximately 50,000 U.S. households.4 Survey years 1969 to 2010 provide income information on calendar years 1968 to 2009. I sort adults into family income quintiles annually.5 Family income is the sum of income from labor, assets, and transfers accruing to the family head and co-residents related by marriage, birth, or adoption. It does not account for non-cash transfers or taxes, although imputing taxes does not alter the results.6 By recalculating the quintile boundaries annually, I study trends in black and white Americans’ relative well-being. I examine whether black Americans became more or less likely to be among the poorest or the most affluent members of society, relative to white Americans. These concerns are central to racial stratification scholarship, which emphasizes the relative positions of different racial groups. However, results are robust to specifications accounting for the income distributions’ changing shapes and locations.7 In addition to family income, I capture four family structures based on marital and parental status: unmarried/married and living with/without one’s own children.8 The unit of analysis is the individual adult (not the family) to ensure comparability between the change and continuity models; continuity models follow individuals from their parental families of origin to their adult families of destination.
To characterize racial disparity in family income, I compare quintile-based distributions across races. This approach provides a more detailed picture of black-white differences in economic well-being, compared to studies that examine only mean income differences. To simplify the presentation of the results, I also provide a summary racial disparity measure. This measure, the Kullback-Leibler divergence or DKL, equals zero when the two distributions are the same and increases as they diverge; higher values indicate greater inequality.9 Because racial inequality studies rarely compare entire distributions, this measure has not been widely applied in this context. Yet, it is commonly used in computer science and is closely related to familiar entropy-based measures of inequality like the Theil index (Cover and Thomas 2006; see p. 1206 of current manuscript for further discussion). Here, DKL is a useful measure not only because it captures multiple distributional features, but also because it allows the intergenerational analysis to capture mobility asymmetries when moving between quintiles, and it allows the change analysis to decompose economic and demographic contributions to inequality.
CPS data describe observed racial inequality trends. They also provide baseline distributions for models that project the population forward over time using different assumptions about continuity and change. Comparing projected and observed trends helps reveal whether the persistence of historical forms of disadvantage or the development of new forms better characterize recent racial inequality.
Projecting Inequality Trends Using Intergenerational Dynamics
To explore how well observed racial inequality trends can be characterized by the persistence of historical inequality patterns via intergenerational dynamics, I supplement CPS data with PSID, decennial Census, and NVS data. I use these data to produce “transition matrices,” which govern projected population change. Different transition matrices determine how black-white inequality would have evolved over the past 40 years under different scenarios (different rates of fertility, mortality, and intergenerational migration across economic and demographic classes). Formally, Markov chain-based subgroup projection models transform race R’s population (R = W, B) from year t, when it is distributed across groups according to the vector Pt,R, into a projected population in the next year, Pt+1,R, with the matrix MR,
Iterating this multiplication moves from 1968 to 2008. Because the matrix can be asymmetric, this method ideally captures the population-level effects of differential upward and downward mobility by race. Initial population vectors {P1968,R} contain baseline CPS data. Predicted population vectors {P2008,R} help quantify model-projected racial inequality (considering the full quintile-based distributions and the summary DKL). Comparisons between projected and CPS-observed inequality reveal whether the proposed intergenerational dynamics (captured in the transition matrix) could have driven recent inequality trends.
To complete the projection, we must first define the initial population groups and then create the transition matrix that shifts the population across groups. Groups are defined by income quintile, family structure, and age. Dividing by single-year age improves projection realism. (In each step, individuals age one year; in contrast, projection models ignoring age assume the entire population turns over in each step, making the step not one historical year but an ahistorical generation length.) After completing the projections, I aggregate over age to compare socioeconomic groups across races.10
After defining the groups, we must encode the rules for moving across groups into the transition matrix. I use a variety of matrices (exploring different rules), but all incorporate intergenerational socioeconomic persistence, fertility, mortality, and generation lengths using age-stratified populations. Similar subgroup projection models have been used to study geographic mobility (Rogers 1975), education (Mare 1997), and Brazilian inequality (Lam 1986). By comparing predicted and observed inequality using many different transition rules, I can determine if a given set of rules could have contributed to recent racial inequality trends.
One transition rule is encoded on the main subdiagonals of the transposed MR′ matrices: individuals move from age a to a+1 with probability sa,R, the group-specific survival probability. The second rule, encoded in the transposed matrices’ top rows (top five rows for age-by-quintile projections and top 10 rows for age-by-quintile-by-family structure projections), determines how individuals enter the population. This entrance depends on mothers’ fertility and children’s economic and family transitions. Elsewhere, the matrices are all zeros. Children transition to their adult socioeconomic class at age zero. Future work could relax this significant simplifying assumption by incorporating intragenerational dynamics.
The probability of children entering into income quintile j (and marital status s) depends on their parents’ income quintile (and marital status) and their group’s average fertility. Ignoring fertility, we capture the conditional probability distributions of children’s adult income (and family structure) given parents’ income (and family structure). Incorporating fertility, we account for the different number of children born to mothers from different racial and socioeconomic groups.11 Generally, Markov models assume that transitions remain constant over time. I test time-varying and time-invariant models to examine how changing transition rates influence racial inequality trends.12 Because the transition rules involve vital rates that vary by sex, I follow demographic tradition and focus on women. For consistency, I also present results from the change-focused model for women only, in addition to men and women. These results are similar, and explorations of simpler intergenerational models show that stratifying by sex leaves my conclusions unchanged. Moreover, because women head most single-parent families, and married women’s family incomes equal married men’s, this restriction does not dramatically alter the object of interest.
Given these general rules for transitioning across groups, we must assign them numerical values in order to use the Markov models to project racial inequality trends. I assign both factual and counterfactual values. I estimate factual values from population data. I use PSID data to predict intergenerational income and marital status persistence using multinomial and binomial logit models,13 and NVS and Census data to calculate fertility and survivorship using standard demographic formulas.14 (Additional details on the transition matrices and factual transition parameters are available upon request.)
I explore four counterfactual regimes to disentangle how demographic and economic differences helped sustain inequality via intergenerational dynamics. First, I expose black children to white children’s factual transition rates. Second, I assume that adult attainment is independent of family background, exposing children to marginal race-specific transition rates. Third, I assume perfect mobility, assigning equal probability to attaining any status. Fourth, I assume no mobility, assigning children their parents’ status. Comparing projected and observed racial inequality under different projection scenarios helps reveal how the intergenerational transmission of income and family structure shaped racial inequality trends.
Projecting Inequality Trends Using Economic and Demographic Shifts
To study how changing forms of inequality contributed to recent racial inequality trends, I use decomposition methods. While these methods differ from the Markov chain-based projection methods used in the intergenerational analysis, the two analyses share the same logic. Like the intergenerational analysis, this analysis starts with the population distributed across income and family types as observed in 1968 from the CPS. It then projects the population forward using different assumptions about population change. Also like the intergenerational analysis, the black and white populations are projected separately, generating predicted 2008 distributions that can be compared using the same measures as before (quintile comparisons and DKL). Finally, I compare predicted and observed inequality to determine how economic and demographic shifts shaped racial inequality trends.
I project the population forward by first decomposing inequality into components representing demographics (distributions of individuals across family structures) and economics (distributions of incomes within family structures), then examining different factual and counterfactual scenarios of demographic and economic change. Formally, for members of race R divided into subgroups g = 1 … G—here, four family types distinguished by marital and parental status—inequality, defined by Shannon entropy HR, can be decomposed as the sum of between-group entropy, HRbt, and a weighted average of within-group entropies, HRwg,
Between-group entropy depends on the distribution of individuals across family types and within-group entropy describes the income distribution within each race-by-family type group.15 Entropy is a measure of inequality or variance, indicating how evenly responses are spread across possible values (Theil 1972). Zero entropy corresponds to assigning unit probability to one outcome and zero to all others (like zero variance). Larger numbers indicate greater spread (maximum entropy corresponds to equal probability of each outcome). Shannon entropy belongs to the same class of generalized entropy measures as the Theil index (mathematically, the analogy requires only a change of variables). The Theil index has been widely used in sociological studies of income inequality (e.g., Breen and Salazar 2011). Shannon entropy is appropriate for the current analysis because it can be used to decompose discrete distributions and because the summary measure of racial inequality, DKL, can be defined in terms of Shannon entropy. The DKL equals the difference between the white and black distributions’ cross-entropy and the white distribution’s entropy.
Once each race-specific distribution is summarized and decomposed, I compare them using quintile distributions and DKL. I use weighted CPS data to obtain unbiased estimates of population proportions. Because my quantities of interest are complicated functions of these estimates, I obtain confidence regions around the point estimates via a type of Bayesian posterior simulation (Gelman et al. 2004). I repeatedly draw probabilities from multinomial distributions parameterized by the maximum likelihood estimates and calculate the quantities of interest, generating distributions for each. I characterize uncertainty with 95 percent credible intervals, bounded by the simulated distributions’ 2.5th and 97.5th quantiles.
By fixing either the economic or family inequality components in an early year, we can calculate counterfactual entropies in later years and counterfactual black-white inequality trends. These counterfactual trends suggest how inequality might have evolved if within-group income distributions had remained as they were in 1968 or if the prevalence of certain family types had not changed. They illuminate how economic and demographic changes worked together to shape racial inequality trajectories.16 This approach does not explore micro-level links between demographic and economic change. Causal interpretations of the results are unwarranted (the assumptions required are too strong; e.g., that fixing demographic distributions would not affect changes in economic distributions). Yet, decomposition analyses are useful because they pinpoint the major contributors to inequality (Martin 2006; Western, Bloome, and Percheski 2008). Like the intergenerational analysis, this change-focused analysis provides a demographic explanation for inequality trends, centered on population dynamics rather than individual-level causal relationships.
RESULTS
Intergenerational Continuity
Despite large-scale legal and social reforms, family income inequality between black and white Americans declined quite slowly in the decades following the late 1960s. To what extent can this slow convergence be characterized by processes of continuity, specifically the processes connecting parents’ resources and their children’s resources later in life? To address this question, I first examine racial differences in the intergenerational persistence of socioeconomic positions and then examine the implications for aggregate inequality trends.
How Positions Endure
Table 1 shows micro-level comparisons between parents’ and children’s incomes, assessing how far children move away from their parents’ economic status during adulthood.17 Family income mobility is higher among black children than among white children, and somewhat higher among children whose parents were not stably married than among children of stably married parents. Within family type, mobility is generally higher for black children than for white children. Assuming that the income transition matrices are fixed over time—and thus considering equilibrium matrices makes sense—Table 1 shows that in the long run, mobility will be higher than observed today.18 Mobility rises because “class-stickiness” disappears (children from the lowest- and highest-income families lose their high likelihood of remaining in their quintiles as adults). Yet, mobility remains higher for black children than for white children in equilibrium.19
Table 1.
Bartholomew’s Index of Intergenerational Family Income Mobility by Race, Parents’ Marital Status, and Cohort
| White
|
Black
|
|||||||
|---|---|---|---|---|---|---|---|---|
| All | Child Born Pre-1968 | Child Born Post-1968 | Equilibrium | All | Child Born Pre-1968 | Child Born Post-1968 | Equilibrium | |
| Men and Women | ||||||||
| All | 1.246 | 1.245 | 1.252 | 1.584 | 1.411 | 1.481 | 1.253 | 1.675 |
| Parents Unmarried | 1.287 | 1.276 | 1.330 | 1.588 | 1.389 | 1.348 | 1.545 | 1.693 |
| Parents Married | 1.222 | 1.226 | 1.214 | 1.579 | 1.446 | 1.586 | 1.190 | 1.646 |
| Women Only | ||||||||
| All | 1.289 | 1.281 | 1.318 | 1.594 | 1.510 | 1.548 | 1.391 | 1.709 |
| Parents Unmarried | 1.336 | 1.334 | 1.341 | 1.616 | 1.434 | 1.368 | 1.666 | 1.729 |
| Parents Married | 1.270 | 1.265 | 1.293 | 1.578 | 1.552 | 1.636 | 1.320 | 1.692 |
Source: Panel Study of Income Dynamics data.
Should we expect African Americans’ higher mobility to help reduce racial income inequality over time? No, according to the transition matrices plotted in Figures 3 and 4. Black children are not especially upwardly mobile out of low-income positions; in fact, they are more likely than whites to remain in the lowest income quintile (see also Hertz 2004). High African American mobility is driven by substantial downward mobility (see also Isaacs 2008). African Americans are much less likely than whites to remain in upper-income quintiles. Considering joint transitions between quintiles and family structures, Figure 4 shows that downward income mobility is especially prevalent among children whose parents were not stably married and among individuals who themselves were not stably married in adulthood. Because African Americans are less likely than whites to come from two-parent families and to be stably married in young adulthood, these differences could slow black economic progress. Table 2 shows that marital probabilities are patterned by parents’ marriage (children of stably married parents are more likely to be stably married themselves) and time (children born more recently have lower probabilities of being stably married at the same ages as children from earlier cohorts). Yet, the most striking pattern is the racial marital divide. Intergenerational transmission is weaker for family structure than for income (see also Musick and Mare 2006).
Figure 3.

Intergenerational Family Income Transition Matrices by Race, Women Only
Source: Panel Study of Income Dynamics data.
Figure 4.

Intergenerational Transitions between Family Income Quintiles and Family Structures by Race, Women Only
Source: Panel Study of Income Dynamics data.
Table 2.
Children’s Probabilities of Being Stably Married between Ages 30 and 34 Given Parents’ Marital Status during Children’s Teens (Ages 13 to 17) by Race and Cohort
| White
|
Black
|
|||||
|---|---|---|---|---|---|---|
| All | Child Born Pre-1968 | Child Born Post-1968 | All | Child Born Pre-1968 | Child Born Post-1968 | |
| Men and Women | ||||||
| Parents Unmarried | 63.78 | 66.85 | 54.04 | 30.92 | 33.13 | 24.01 |
| Parents Married | 68.16 | 70.00 | 63.92 | 36.57 | 37.71 | 33.33 |
| Women Only | ||||||
| Parents Unmarried | 64.74 | 66.15 | 60.79 | 27.52 | 28.43 | 24.55 |
| Parents Married | 71.62 | 73.60 | 66.61 | 29.19 | 31.71 | 21.28 |
Source: Panel Study of Income Dynamics data.
Together, African Americans’ high downward income mobility (compounded in the short run by low upward mobility out of the bottom quintile) and large racial differences in family structure could help explain persistent racial disparities in income. Downward mobility suggests that family background may be less salient in perpetuating inequality than economic and demographic trends that shape the prospects of children from many backgrounds. But, the implications of microlevel parent–child comparisons for aggregate inequality depend on how they combine with initial group differences in socioeconomic positions and the forces of demographic metabolism (fertility and mortality).
Moving from Micro to Macro
Figure 5 suggests that recent racial inequality trends are not very well characterized by processes of intergenerational continuity. Figure 5 plots how black adults were distributed across income quintiles in 1968 and 2008 according to CPS data, revealing how racial inequality evolved over 40 years. These distributions, marked with solid lines, reproduce the information in Figure 2. Figure 5 also plots how black adults are predicted to be distributed across quintiles, according to the Markov-based projection models that transform the 1968 distribution using factual transition rates (calculated from PSID, Census, and NVS data) to move the population forward 40 years via the forces of fertility, mortality, and intergenerational income and family-structure persistence. This distribution is marked with a dashed line and white triangle. Like the observed 2008 distribution, the predicted 2008 distribution shows some racial convergence toward the bottom, as black adults’ probability of falling into the lowest income quintile declined. However, predicted lower-tail convergence is smaller than observed. Moreover, at the top, where CPS data reveal slight racial convergence, the model predicts divergence, with declining proportions of black adults projected to reach the top two income quintiles. These predictions of slow lower-tail convergence and upper-tail divergence result in over-prediction of the share of black adults with family incomes in the middle quintile. These predictions are driven, primarily, by the slow progress of low-income children out of the bottom quintile combined with high rates of downward mobility from upper quintiles (discussed further below). High downward mobility, in particular, makes the predicted African American distribution more bottom-heavy than actually observed, and it leads predicted racial inequality to be somewhat higher than observed.
Figure 5.
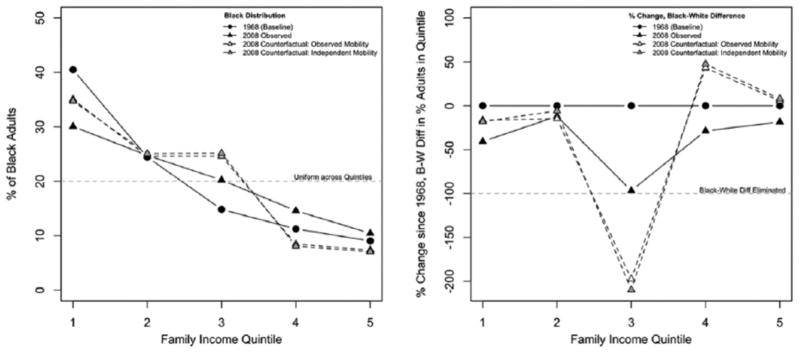
Observed and Counterfactual Distributions of Adults across Family Income Quintiles
Source: March Current Population Survey, Panel Study of Income Dynamics, National Vital Statistics, and decennial Census data.
Note: Counterfactuals from intergenerational continuity models (see text for details). Left panel shows black adults only; right panel shows percent change between 1968 and 2008 in the distributional differences between black and white adults.
These prediction errors suggest that while processes of intergenerational socioeconomic continuity may have slowed racial convergence in family income, these processes are insufficient to characterize this convergence. To better understand why, we must explore which aspects of the Markov model aid prediction and which hinder it. Aspects aiding prediction may represent important social processes contributing to persistent racial inequality, while aspects hindering it suggest errors in our conception of how inequality is maintained.
Figure 6 illustrates the accuracy of racial inequality projections generated under a wide range of assumptions. Each point in the figure compares the observed racial inequality in 2008 to one projection model’s predicted racial inequality in 2008 (Table S1 in the online supplement shows the underlying numerical comparisons; Table S2 shows the projected inequality levels and Figure S1 illustrates them [http://asr.sagepub.com/supplemental]). The closer the point lies to the vertical line at zero, the better the given model’s prediction (i.e., the closer predicted inequality is to observed inequality). Points are distinguished by the model assumptions used to generate the predictions. Looking down the rows of Figure 6, points differ in the transition rates’ assumed magnitudes. In the first row, points reflect predictions using factual magnitudes (observed in PSID, Census, and NVS data; see also Figure 5). In other rows, points reflect predictions using counter-factual magnitudes; for example, in the second row, trends for African Americans are predicted using whites’ factual transition rates. Looking within each row of Figure 6, points differ in the assumptions about how transition rates change over time and how income and marriage persist. Circular points indicate that transition magnitudes remain stable over time; triangular points indicate that they change. White points indicate that only income persists across generations, not family structure. Grey points indicate that both persist, but as independent processes (the probability of transitioning between income quintiles does not differ by parents’ marital status). Black points indicate that income and marriage persist as dependent processes. By comparing points within and across rows, we can assess how intergenerational continuities may have shaped racial inequality trends.
Figure 6.

Comparison of Markov Population Projection Estimates of Black-White Family Income Inequality and Observed Black-White Family Income Inequality
Source: Panel Study of Income Dynamics, National Vital Statistics, decennial Census, and March Current Population Survey data.
Note: Fertility by race only in top panel and fertility by race, class, and marital status in bottom panel.
Intergenerational dynamics may contribute to slow racial convergence in family incomes due to initial racial differences in socioeconomic positions alone, or due to initial differences combined with racial differences in how these positions endure. If initial differences were sufficient to maintain inequalities, then predictions from models using equal white and black transition rates should be as accurate as predictions from models using different rates (like Figure 6, row 1). In fact, predictions using equal transition rates are much less accurate, severely underestimating racial inequality. When applying white income transmission, marital transmission, and fertility rates to project both black and white populations, the models predict racial inequality to be about 100 percent smaller than observed in 2008 (Figure 6, row 5). The black and white distributions would have almost completely converged. Likewise, other scenarios assuming equal transition rates across races fail to generate inequality patterns consistent with those observed, whether mobility is assumed to be perfect or nonexistent.20 If intergenerational stability of socioeconomic positions were identical across races, it appears that economic progress would have been sufficient for initial racial differences in family income to have dissipated as the children who came of age over the past 40 years replaced their parents in different socioeconomic positions. Given that substantial inequality remains, racial differences in mobility appear to have helped perpetuate inequality.
Both economic and demographic forces contribute to racial differences in mobility between socioeconomic positions. Yet, economic forces appear somewhat more consequential from an intergenerational perspective. Two findings support this conclusion. First, comparing predictions within rows of Figure 6 across models that allow economic and demographic transitions to vary over time (represented by triangles) versus those that do not (represented by circles), we see the predictions are quite close. These comparisons generally favor time-varying models, but the differences are small. From an intergenerational perspective, stable racial differences in how positions persist are more important than recent changes in persistence. Changes in family-structure persistence have been much larger than changes in income persistence (see Tables 1 and 2). Consequently, economic transmission processes appear more important in terms of how microlevel associations shape macro-level trends.
Second, predictive accuracy is generally lower when using counterfactual economic rates than when using counterfactual marital or fertility rates (as illustrated by comparing down Figure 6’s rows within each symbol). This indicates that economic transmission rates exert greater influence on inequality trends. Of course, black-white differences in family-structure transmission and its interaction with income transmission also contributed to the persistence of racial inequality. Predictions from models allowing children’s incomes and marital statuses to jointly depend on those of their parents are more accurate than predictions from models assuming income and marital status persist independently. In turn, independent-transmission models fit the data better than models assuming only income persists intergenerationally. Yet, economic rates are somewhat more important.21 Enduring racial differences in income transmission appear to have helped maintain racial inequality over the past 40 years.
However, relatively high downward mobility indicates that class background is less informative about adult class destination among African Americans than among whites. Consequently, family background may be less salient in perpetuating inequality than are racially patterned economic trends shared by children from many backgrounds. Markov model results confirm this hypothesis. Racial inequality predictions are just as accurate when Markov transition rules depend only on children’s race as when they depend on both race and parents’ socioeconomic positions (comparing Figure 6 row 1 with rows 6, 7, and 8). These “independent mobility” models suggest that the most important differences driving the slow convergence in family incomes are cross-race rather than cross-class. Figure 5 shows that projections using counterfactual “independent” transition rates (which depend on race only) are almost identical to projections using factual transition rates (which depend on race and class; compare Figure 5’s grey and white triangles). Both under-predict racial convergence in the lowest and highest income quintiles. These results suggest that, although studying microlevel associations between parents’ and children’s socioeconomic positions is important for understanding the process of stratification, these associations may not significantly shape population-level inequality trends. Not only do factual transition rates fail to accurately characterize recent inequality trends, but transition rates that ignore versus incorporate class background are equally predictive. These findings suggest that racial inequality may be better understood using a cross- sectional lens, not an intergenerational lens.
Economic and Demographic Change
Because intergenerational continuity cannot adequately predict the slow racial convergence in family income since the late 1960s, we must turn to alternative explanations. Rather than historical forms of inequality slowly dissipating across generations, persistent inequality may reflect large changes in inequality’s form driven by offsetting shifts in the economy and family.
Figure 7 reveals important changes in both incomes and families. African Americans experienced increasing income entropy since 1968 (at least through the late 1990s, when entropy plateaued). Income differentiation rose as African Americans left the lowest quintiles and joined the middle and upper classes at higher rates. Contemporaneously, family-structure diversity rose more among whites than among African Americans. The shift away from two-parent, male-breadwinner households increased family-structure differentiation within both racial groups, but African Americans moved more uniformly toward a single family type (single-parent households). Economic and demographic shifts generated some racial convergence in family incomes. The Kullback-Leibler divergence between the two distributions (defined by income and family type) was .313 in 1968 and declined about 26 percent to .230 by 2008 (see Table 3). Among women only, black-white disparity was a bit higher 40 years ago, with DKL about .323 in 1968, and it only declined about 11 percent by 2008. Family-structure differences and associated income disparities are more pronounced among women.
Figure 7.
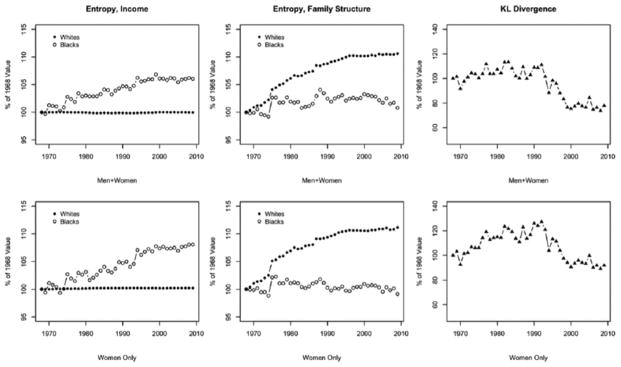
Income and Family Structure Inequality Trends within and between Races, All Adults and Women Only
Source: March Current Population Survey data.
Note: Entropy summarizes within-race inequality (across income quintiles and across family structure groups); KL divergence summarizes between-race inequality.
Table 3.
Entropy and Kullback-Leibler Divergence of Observed and Counterfactual Family Income Distributions by Race and Year, Decomposed by Family Type (Marital Status by Parental Status Groups)
| Entropy, White
|
Entropy, Black
|
KL Divergence
|
||||||
|---|---|---|---|---|---|---|---|---|
| Between Group | Within Group | Total | Between Group | Within Group | Total | Level | % Change from 1968 | |
| Men and Women | ||||||||
| Observed Distributions | ||||||||
| 1968 | 1.667 (1.663, 1.671) | 2.254 (2.251, 2.257) | 3.921 (3.916, 3.925) | 1.812 (1.799, 1.825) | 2.023 (2.003, 2.040) | 3.835 (3.813, 3.853) | .313 (.293, .338) | 0 |
| 2008 | 1.842 (1.838, 1.845) | 2.214 (2.211, 2.217) | 4.056 (4.051, 4.060) | 1.843 (1.833, 1.854) | 2.116 (2.104, 2.125) | 3.959 (3.942, 3.973) | .230 (.217, .246) | −26.528 (−33.112, −19.669) |
| Counterfactual Distributions | ||||||||
| 2008, demographics fixed to 1968 | 1.667 (1.663, 1.671) | 2.214 (2.211, 2.217) | 3.881 (3.876, 3.886) | 1.812 (1.799, 1.825) | 2.172 (2.161, 2.179) | 3.983 (3.967, 3.998) | .167 (.154, .183) | −46.664 (−51.054, −42.183) |
| 2008, income distributions fixed to 1968 | 1.842 (1.838, 1.845) | 2.221 (2.215, 2.226) | 4.062 (4.057, 4.068) | 1.843 (1.833, 1.854) | 1.871 (1.841, 1.896) | 3.714 (3.683, 3.742) | (.353, .396) | 18.786 (8.202, 29.947) |
| Women Only | ||||||||
| Observed Distributions | ||||||||
| 1968 | 1.722 (1.717, 1.728) | 2.218 (2.213, 2.223) | 3.940 (3.934, 3.946) | 1.882 (1.866, 1.895) | 1.908 (1.879, 1.935) | 3.790 (3.758, 3.818) | .323 (.298, .362) | 0 |
| 2008 | 1.908 (1.905, 1.912) | 2.183 (2.178, 2.187) | 4.092 (4.085, 4.096) | 1.885 (1.873, 1.896) | 2.052 (2.036, 2.068) | 3.938 (3.915, 3.956) | .288 (.266, .311) | −10.794 (−22.023, −1.127) |
| Counterfactual Distributions | ||||||||
| 2008, demographics fixed to 1968 | 1.722 (1.717, 1.728) | 2.192 (2.189, 2.198) | 3.916 (3.909, 3.922) | 1.882 (1.866, 1.895) | 2.127 (2.111, 2.139) | 4.008 (3.986, 4.026) | .184 (.167, .207) | −42.990 (−48.736, −36.724) |
| 2008, income distributions fixed to 1968 | 1.908 (1.905, 1.912) | 2.159 (2.150, 2.167) | 4.068 (4.058, 4.076) | 1.885 (1.873, 1.896) | 1.677 (1.633, 1.717) | 3.561 (3.516, 3.604) | .425 (.399, .464) | 31.555 (16.774, 48.119) |
Source: March Current Population Survey data.
Note: 95% credible intervals in parentheses.
Racial differences in family incomes stem partly from differences in the distribution of incomes within family types (economic contributions to inequality) and partly from differences in the distribution of individuals across family types (demographic contributions). Economic contributions to inequality declined over time. Certainly, important racial differences remain within family types. All unmarried parents concentrate disproportionately in the lowest family income quintile, but this is especially true for African Americans (see Figure 8, top panel). Similarly, among married parents and unmarried adults without children, African Americans are more likely than whites to fall in the lowest income quintiles (not shown). Yet, racial differences in within-family type income distributions have narrowed. The black-white gap in the share of single parents in the lowest income quintile fell since 1968 (see Figure 8, top panel). This change, along with similar changes within other family types, reduced racial disparities in income. If income distributions within family type had remained as they were in 1968, racial disparities would have increased about 19 percent by 2008, all else being equal (see Table 3). In fact, these disparities declined 26 percent. Economic forces were equalizing. Among women only, these forces were especially strong. Without the economic progress witnessed over the past 40 years, black-white inequality is predicted to have increased by almost 32 percent, given the demographic shifts that occurred. Instead, labor-market changes, including mothers’ increased employment and wages, reduced disparity between black and white women’s family incomes.
Figure 8.

Economic Convergence and Demographic Divergence across Races
Source: March Current Population Survey data.
Note: Top panel shows percent with family income in lowest income quintile, among unmarried parents, by race and year. Bottom panel shows percent unmarried parents, among all adults, by race and year.
Given substantial (although incomplete) racial convergence in the economic domain, diverging trends in the family must underlie the slow decline in black-white family income inequality. African Americans’ overrepresentation in low-income family types increased over time (see Figure 8, bottom panel). Single-parent families became more prevalent for blacks and whites. But, the marked shift from married-parent to single-parent families among African Americans exacerbated racial disparities in income. If the distribution of family types had remained constant since 1968, we would expect racial disparities to have declined about 47 percent over 40 years, all else being equal (see Table 3). This reduction is almost double the reduction observed. Among women only, the reduction expected from fixing family structure is about four times larger than the reduction observed. While economic changes were equalizing, family changes were disequalizing, especially for women. Demographic changes were not large enough to completely offset economic progress. Racial inequality in family incomes declined somewhat. Yet, demographic changes appear to have slowed progress toward equality.
Figure 9 illustrates the predicted evolution of African Americans’ family income distribution under different assumptions about economic and demographic change, and the implications for black-white inequality. Like Figures 2 and 5, Figure 9 marks with solid lines the observed distributions in 1968 and 2008 along with the observed reduction in racial inequality. Additionally, Figure 9 marks predicted distributions with dashed lines, illustrating how economic and demographic shifts contributed to the observed convergence in family incomes in each part of the distribution. Economic progress, without the demographic changes observed, would have reduced African Americans’ probability of falling into the bottom quintile by about five additional percentage points. Progress in the top two quintiles would also have been larger than observed. Economic progress alone would have brought the black and white distributions closer together across the spectrum, especially in the third quintile. Conversely, demographic change alone would have driven the distributions further apart. However, this change would have concentrated in the lower quintiles. Relatively more African Americans would fall in the lowest quintile and relatively fewer in the middle.
Figure 9.
Observed and Counterfactual Distributions of Adults across Family Income Quintiles
Source: March Current Population Survey data.
Note: Counterfactuals from economic and demographic change models (see text for details). Left panel shows black adults only; right panel shows percent change between 1968 and 2008 in the distributional differences between black and white adults.
Together, these overlapping economic and demographic trends reveal that the slow convergence in family income across races obscures significant reorganization in the underlying forms of disadvantage over the past 40 years. Economic progress, which boosted substantial portions of African Americans out of the bottom quintile, was slowed by demographic trends, which pulled some down. Economic progress for the middle and upper classes was also slowed somewhat by demographic trends that tended to pull African American families out of the higher quintiles. Yet, most of the change occurred in the lower half of the distribution.
DISCUSSION
Following the civil rights movement, African Americans’ legal and social standing improved. Major reforms between 1964 and 1972 outlawed racial discrimination in voting, employment, education, labor unions, credit contracting, mortgages, and federally funded organizations. They also spurred the adoption of anti-discrimination policies in many other entities and were accompanied by large declines in public support for discriminatory activity. Many African American families joined the middle- and upper-income classes. Despite this progress, African Americans remain disproportionately concentrated in the lower family-income quintiles. Substantial racial disparity in family incomes lingers, and economic progress has been slow relative to the speed of other legal and social changes.
Previous research suggests two primary explanations for slow racial convergence in family incomes: the persistence of existing disadvantage or the emergence of new forms of disadvantage. The first explanation, focused on continuity with historical patterns of inequality, stresses how the intergenerational transmission of socioeconomic status sustains racial disparity, as children from poor families are more likely to become poor adults than are children from affluent families. The second explanation, focused on new inequality patterns, stresses how large changes in the labor market and family, taken together, can result in much smaller changes in family income inequality if they work in offsetting directions.
This article explored two demographic representations of how populations evolve to examine whether recent trends in black-white family income inequality are better characterized by intergenerational continuity or offsetting economic and demographic changes. It linked micro-level associations between parents and children to macro-level racial inequality trends. It also formalized the countervailing impacts of labor-market and family changes on these macro-level trends, providing information on inequality across different parts of the income distribution to assess white and black Americans’ relative well-being. These demographic models do not provide direct insight into the complex causal relationships generating inequality trends. Instead, they provide stylized facts about the population dynamics underlying these trends and the relative ability of different dynamics to characterize these trends.
The analysis yields two primary findings. First, racial inequality trends since the 1960s are not well-reproduced by Markov chain-based models of intergenerational income and family-structure persistence. These models predict that without racial differences in how socioeconomic positions endure, initial racial disparities across quintiles would have dissipated over the birth cohorts coming of age during the past 40 years. Yet, these models also show that observed racial differences in how socioeconomic positions endure were unable to generate the observed macro-level racial convergence. Micro-level models revealed high downward mobility rates among African Americans, which lead to overly bottom-heavy predicted distributions. This lack of fit indicates that important changes in the economy and the family (not reflected in intergenerational transmission rates) shaped racial inequality trends, boosting some African Americans up the income distribution. Moreover, the intergenerational models’ predictions were equally accurate whether or not they incorporated class-linked persistence patterns. Together, these findings suggest that recent trends in black-white family income disparity are not well-characterized by the forces of continuity that perpetuate historical forms of inequality from parents to children. Rather, discontinuity across generations within families, driven by downward mobility, undermines the accumulation of economic advantages and links racial inequality trends less closely to family background than to broad economic and demographic shifts affecting the population at large.
Second, substantial change in the labor market and the family reshaped incomes among both white and black families, but differential shifts by race characterized recent trends in racial inequality quite well. Rather than reflecting the slow diffusion of historical forms of inequality through intergenerational mechanisms, these trends reflect important changes in how family income emerges from the pooling of individual earnings in family units of changing composition. Economic trends were equalizing but demographic trends were disequilizing. While income distributions within each family structure became more similar across races, family-structure distributions became less similar. The equalizing trends dominated; racial disparity declined. However, inequality might have declined further if the prevalence of single-parent families had not risen especially quickly among African Americans. Demographic trends may have slowed progress toward racial equality.
Recent trends in black-white family income disparity are better characterized by changing forms of disadvantage than by intergenerational continuity of historical forms of disadvantage. As Wilson (2012) notes, economic and political shifts in the second half of the twentieth century increased the importance of class background in determining African Americans’ life chances. However, even as well-off African American parents’ chances of transmitting their advantages increased, the “perverse sort of egalitarianism” (Hogan and Featherman 1977:101) in African American children’s chances of becoming poor adults did not disappear. Downward mobility is still higher among African Americans than among whites, indicating that the (“positive”) constraints of class background are weaker and class positions are less secure. Consequently, trends in the economy and family reverberate more strongly throughout the African American population. In short, intergenerational transmission of socioeconomic status is part of how populations transform. Yet, populations also change because of the demographic forces of birth and death (as modeled) and period-specific changes such as economic restructuring and political, institutional, and cultural shifts that are not well-captured in intergenerational transmission matrices. Period-specific occurrences, broadly shared by individuals from many family backgrounds, appear more important for racial inequality trends than do intergenerational dynamics occurring within family settings.
These results demonstrate that offsetting trends in how individuals earn money in the labor market and how they pool their earnings in families generated relatively slow convergence in incomes across races. While previous research on black-white economic inequality trends focuses on men’s labor-market experiences, this analysis highlights how men’s and women’s labor-market experiences intersect in families. Some thoughtful reviews have noted that family-structure changes may affect racial inequality, but they focus on how children growing up in different family types are differentially equipped for adult success, highlighting intergenerational dynamics rather than period trends (e.g., McLanahan and Percheski 2008). The current results should push researchers to investigate the mechanisms linking changes in the economy and family, because large changes occurred in both that together resulted in relatively slow change in racial disparity in family income.22
While several sociological theories anticipate connections between economic and demographic decisions (e.g., Oppenheimer 1988; Wilson 1987), most focus on microlevel dynamics, such as how individuals’ economic situations shape their family formation decisions. Yet, as my results reveal, moving from individual-level associations to macro-level population dynamics can alter the apparent importance of different factors (e.g., while low upward and high downward mobility help predict black children’s relatively low socioeconomic status at the individual level, at the population level intergenerational continuity appears to play a smaller role in racial inequality trends). Future research could explore how micro-level dynamics aggregate to population trends, especially in the presence of social network effects and changing community standards that could feedback on individual-level decisions.
Micro-level models suggest two potentially countervailing ways that income affects family structure (locating the ultimate causes of racial inequality trends in the economy). First, economic progress may stabilize relationships or even cause individuals to marry, as the strain of financial hardship lessens and individuals reach the pecuniary markers associated with married life (Edin and Kefalas 2005; Ellwood and Jencks 2004). Second, economic progress may destabilize marriages and delay union formation, as women’s financial independence increases and their survival outside of marriage becomes more secure (Cancian and Meyer 2014; Hannan and Tuma 1990). These two processes may work on different margins; small income increases may generate incentives to dissolve partnerships, while large increases stabilize them (Hannan, Tuma, and Groeneveld 1978). It is tempting to conclude that destabilizing economic effects dominated in this period, because the African American middle class grew as African American families shifted away from marriage. But, drawing this conclusion from time-series coincidences is premature (Oppenheimer 1997).
Large literatures examine how income affects marriage (for a review, see Burstein 2007), although earnings and employment differences by race leave unexplained substantial racial differences in marriage (Raley and Sweeney 2009). New understanding may stem from studying not only how income affects marriage but also how relationship choices affect economic behavior, and how this individual-level behavior aggregates into macro-level population dynamics. Demographic changes might have been more than manifestations of economic forces, just as marriages are more than economic arrangements. They may have causally affected the speed of income convergence across races. Definitive proof requires further research; this analysis cannot support causal claims. Yet, it indicates that family formation patterns have potential as levers for changing racial inequality in family incomes.
Economic factors are often given primacy in explanations of inequality trends, but the current analysis suggests that demographic decisions might be understood as more than manifestations of labor-market positions. Both the continuity- and change-focused analyses reveal that demographic trends alone cannot explain the evolution of black-white inequality. However, both analyses also reveal that, over the past 40 years, the speed of demographic change was fast compared to economic change. Marital status persists less strongly across generations than does income, and family-structure changes were so large that they almost counteracted some of the most wide-ranging federal labor-market interventions of the past 50 years. The different time-scales of economic and demographic evolution suggest the utility of considering how exogenously-generated family changes could influence racial inequality.
This article takes a step toward synthesizing how legacies of disadvantage passed down over generations and period-specific trends contribute to persistent inequality. Both contribute, but recent racial inequality patterns are better understood by looking beyond socioeconomic background. Moving forward, to better understand how racial inequalities persist in the face of rapidly changing legal and social institutions and constantly shifting populations, we must consider how the labor market and family shape one another in terms of individual-level dynamics, and how these dynamics aggregate to macro-level trends.
Supplementary Material
Acknowledgments
I gratefully acknowledge William Julius Wilson, Jennifer Glick, Christopher Jencks, Arthur Sakamoto, Bruce Western, and the American Sociological Review editors and reviewers who commented on earlier drafts. All supplemental analyses discussed are available from the author on request.
Funding
The collection of some of the data used in this study was partly supported by the National Institutes of Health under grant number R01 HD069609 and the National Science Foundation under award number 1157698.
Biography
Deirdre Bloome is an Assistant Professor of Sociology and a Faculty Associate of the Population Studies Center and the Survey Research Center at the University of Michigan, Ann Arbor.
Footnotes
This model is crude because it only allows factors reflected in socioeconomic transition rates or demographic rates to influence future income distributions. Period-specific shifts in supply or demand may change these distributions. Mismatches between model-projected and observed distributions suggest that period-specific forces are more important than intergenerational mechanisms in shaping these distributions.
Like others (Musick and Mare 2004; Preston 1974), I examine a “demographic” fertility effect. I assume that fertility’s importance stems from the number of children born to each group, not the association between fertility and mobility. This assumption is plausible; evidence suggests that additional siblings have no negative causal effect on children’s educational or economic outcomes (Angrist, Lavy, and Schlosser 2010; Black, Devereux, and Salvanes 2005; Caceres-Delpiano 2006; Guo and VanWey 1999). Parents may adjust to family-size increases without harming children’s attainment (e.g., by reducing leisure-related consumption).
When there is no socioeconomic persistence, black children’s disproportionate entrance into lower-class families does not shape the future socioeconomic distribution of black adults. Conversely, when there is no mobility, fertility differences completely determine the ultimate distribution. All settle in the highest-fertility class, although such convergence may take many generations.
The CPS excludes institutionalized individuals. Rising incarceration increasingly excludes economically marginal men from household surveys, understating black-white male wage inequality (Western 2006). Biases are much smaller here than in analyses of men’s wages, for two reasons. First, I study total family income (including women’s wages and non-wage income rarely accruing to prison-bound men [e.g., Aid to Families with Dependent Children]) and include unemployed men (whose exclusion understates wage inequality). Second, I study men and women together and women alone, never men alone. Although female incarceration grew, the proportion of women incarcerated remains small, meaning effects on complete distributions are small. Women-only samples should not suffer meaningful bias.
Family incomes could be compared without using discrete categories. However, the categorical approach allows the continuity and change models to produce comparable results while capturing differential asymmetries in black and white children’s intergenerational mobility. In contrast, mobility measures using continuous income (intergenerational correlations or elasticities) obscure differential upward and downward mobility.
One concern with excluding taxes involves the Earned Income Tax Credit (EITC), whose refunds through the tax system have grown since its 1975 introduction. However, including imputed EITC income (both estimated by the Census Bureau and calculated through the NBER’s TAXSIM module) generates results very similar to those presented here. EITC effects concentrate around the poverty line, as transfers are generally small (less than $1,800 in 2007, on average [Meyer 2010]). The tax credit pushes families out of poverty but does not appear to meaningfully alter black-white family income inequality trends that account for differences across the distribution, not only the bottom.
Income distributions shifted upward and widened since 1968 (McCall and Percheski 2010). However, black and white mean family incomes grew at the same rate; income redistribution across quintiles also evolved similarly (U.S. Census Bureau 2010). Consequently, alternative analyses using fixed-income boundaries (permitting broadly shared or differentially distributed income growth to redistribute the population across income groups) produce nearly identical results to analyses using variable-boundary quintiles (constraining one-fifth of the population to occupy each group). I study quintiles because they address racial stratification scholars’ central concern with relative group positions, and they are easier to interpret. Results are robust to this choice.
Using Casper and Cohen’s (2000) adjusted POSSLQ procedure for identifying cohabitors, I repeated the analysis including unmarried and married partners. These results are very similar, although inequality declines slightly less when including cohabitors. Cohabitation increased more quickly among whites than among blacks, leading to racial convergence in this family structure (Bumpass and Lu 2000), but black-white family income inequality is larger within cohabiting families than within married families (Manning and Lichter 1996). I focus on marriage due to evidence of significantly less stability and potentially less financial sharing within cohabiting families than within married families (Smock 2000). However, findings do not hinge on this decision.
Formally, where pWj and pBj are white and black adults’ probabilities of falling into family income quintile j. DKL captures the weighted average difference between the distributions’ log likelihoods, weighted by the importance of each mass point in the white income distribution. Generally, DKL is not symmetric, but my results are not sensitive to the reference distribution. Switching the distributions when calculating DKL leaves the conclusions unchanged.
When disaggregating by family structure in addition to quintile and age, I separate the stably married from those who were not. Comparing results from models ignoring versus incorporating marital status reveals how racial differences in family-structure persistence (and its interaction with income) shape racial inequality trends. The two family groups used in the intergenerational analysis differ from the four family groups used in the change analysis (which distinguishes families by marital status and parental status). In the intergenerational analysis, only parents contribute to the future population. Intergenerational models include group-specific fertility rates to account for different reproductive propensities.
Formally, top-row cell entries in the age-by-quintile analysis are PR,t(Yc = j | Yp = k)×f a,k,R,t. PR,t(Yc = j | Yp = k) is the probability that children of race R born in year t will attain adult income Yc in quintile j, given parental income Yp in quintile k; fa,k,R,t is the fertility rate of women age a, quintile k, and race R in year t. Other projections incorporate children’s marital status, Uc, and parents’ marital status, Up in two ways: assuming that marital status and income persist either independently or jointly. Formally, these assumptions correspond to cell entries PR,t(Yc = j | Yp = k)×PR,t(Uc = s | Up = l)×fa,k,l,R,t and PR,t(Yc = j,Uc = s | Yp = k,Up = l)×fa,k,l,R,t.
Time-varying models permit the possibility that the chain will not converge to a unique equilibrium distribution.
I use parents’ marital status and income quintile when their children were teens to predict these children’s marital status and income quintile in adulthood. Because of data sparsity, to populate time-varying transition matrices I use parametric smoothing across birth cohorts to predict cohort-specific transition rates.
I use two fertility data sources because each supplements the other’s weaknesses. The NVS provides more accurate estimates because it draws on administrative reports of all births; the Census relies on survey reports of children living with their mothers. However, in the years required for this analysis, the NVS distinguishes fertility only by race. The Census permits calculations of age-specific fertility by race, marital status, and income quintile.
Formally, between-group entropy is , where pRg is the probability of a member of race R falling into family type g. Within-group entropy is , where pRg,j is the probability of a member of race R and group g falling into quintile j.
To cleanly decompose demographic and economic components, I do not adjust income for family size. Adjusting confuses demographic trends in family composition with economic trends in total income when examining within-family type distributions. Moreover, in intergenerational analyses, size-adjusting mixes fertility, marriage, and labor-supply decisions. Nevertheless, results using size-adjusted income mirror results reported here, with two noteworthy deviations. First, black-white inequality’s original level and decline are larger when size-adjusting, as African American families were larger but shrunk faster than white families. Second, the role of demographic change is slightly smaller when size-adjusting, because married-couple families’ relative well-being declines.
Table 1 displays Bartholomew’s indices, which summarize children’s probabilities of switching income quintiles, weighing large moves more heavily than small moves. Higher values indicate more mobility. Formally, , where pkj represents children’s probability of moving from quintile k to quintile j.
The raw data suggest that African American income mobility may have declined, as black families became more likely to maintain economic advantages (see Table 1). However, the change was not large enough to be detected statistically, nor to shape predicted inequality trends. This finding aligns with other PSID analyses, which uncover little evidence of significant mobility changes (Hertz 2007; Lee and Solon 2009).
Family income mobility patterns are similar across the women-only and two-sex samples, suggesting that the projection models’ focus on women (to account for sex-specific fertility and mortality rates) should not affect the results’ generalizability.
Models assuming perfect mobility predict almost zero racial inequality (Figure 6, row 9). Perfect mobility rates alter predicted income distributions more among blacks than among whites; observed black mobility is farther from the perfect counterfactual. Perhaps surprisingly, eliminating transmission differences via extreme persistence also generates low predicted black-white inequality (Figure 6, row 12). This is because complete immobility eliminates African Americans’ substantial downward mobility. In the short run, the distributions do not become bottom-heavy, as they do when using observed mobility. (In the long run under this model, fertility drives population redistribution; all migrate to the highest-fertility group, that is, low-income married women.)
Like Preston (1974), I find small fertility effects on predicted racial inequality. Theoretically, black women’s steeper class-fertility gradient (especially among the unmarried; see Figure S2 in the online supplement) could perpetuate inequality by over-representing children in poor families; low-income, single African American mothers have proportionately more children, and proportionately fewer highly educated African American women marry (Bennett, Bloom, and Craig 1989). Consistent with this hypothesis, factual fertility rates (allowing racial differences) predict higher (and more accurate) inequality levels than do counterfactual rates using white fertility for both races (see Figure 6). However, compared to income and family-structure effects, fertility effects are small. Relatively high mobility offsets relatively small fertility differences (see also Mare 1997). Surprisingly, Census fertility data (which differentiate by class, marital status, and race) project somewhat less racial inequality than do NVS data (which differentiate only by race); thus, NVS data generate better predictions (comparing panels, Figure 6). This is because married women’s fertility rates far exceed unmarried women’s (the married population dominates when mixed with the unmarried), and racial differences in the class-fertility gradient are small among married women (creating greater racial convergence). Nevertheless, Census- versus NVS-based projections are fairly similar, again suggesting small fertility effects.
These results also highlight the importance of gender differences in work and pay in maintaining racial inequality. Rising wages among black women (particularly among black mothers) helped reduce inequality over time, but reliance on these wages still maintains substantial black-white family income inequality, because women generally earn less than men and mothers earn less than women without children.
References
- Amato Paul. Explaining the Intergenerational Transmission of Divorce. Journal of Marriage and the Family. 1996;58(3):628–40. doi: 10.1111/jomf.12384. [DOI] [PMC free article] [PubMed] [Google Scholar]
- Angrist Joshua, Lavy Victor, Schlosser Analia. Multiple Experiments for the Causal Link between the Quantity and Quality of Children. Journal of Labor Economics. 2010;28(4):773–823. [Google Scholar]
- Autor David H, Katz Lawrence F, Kearney Melissa S. The Polarization of the U.S. Labor Market. American Economic Review. 2006;96(2):189–94. [Google Scholar]
- Beller Emily. Bringing Intergenerational Social Mobility Research into the Twenty-first Century: Why Mothers Matter. American Sociological Review. 2009;74(4):507–528. [Google Scholar]
- Bennett Neil, Bloom David, Craig Patricia. The Divergence of Black and White Marriage Patterns. American Journal of Sociology. 1989;95(3):692–722. [Google Scholar]
- Biblarz Timothy J, Raftery Adrian E. The Effects of Family Disruption on Social Mobility. American Sociological Review. 1993;58(1):97–109. [Google Scholar]
- Björklund Anders, Chadwick Laura. Intergenerational Income Mobility in Permanent and Separated Families. Economics Letters. 2003;80(2):239–46. [Google Scholar]
- Black Sandra E, Devereux Paul J, Salvanes Kjell G. The More the Merrier? The Effect of Family Composition on Children’s Education. Quarterly Journal of Economics. 2005;120(2):669–700. [Google Scholar]
- Blau Peter, Duncan Otis Dudley. The American Occupational Structure. New York: Wiley; 1967. [Google Scholar]
- Breen Richard, Jonsson Jan. Inequality of Opportunity in Comparative Perspective. Annual Review of Sociology. 2005;31:223–43. [Google Scholar]
- Breen Richard, Salazar Leire. Educational Assortative Mating and Earnings Inequality in the United States. American Journal of Sociology. 2011;117(3):808–843. [Google Scholar]
- Browne Irene, Misra Joya. The Intersection of Gender and Race in the Labor Market. Annual Review of Sociology. 2003;29:487–513. [Google Scholar]
- Bumpass Larry, Lu Hsien-Hen. Trends in Cohabitation and Implications for Children’s Family Contexts in the United States. Population Studies. 2000;54(1):29–41. doi: 10.1080/713779060. [DOI] [PubMed] [Google Scholar]
- Burstein Nancy. Economic Influences on Marriage and Divorce. Journal of Policy Analysis and Management. 2007;26(2):387–429. [Google Scholar]
- Burtless Gary. Effects of Growing Wage Disparities and Changing Family Composition on the U.S. Income Distribution. European Economic Review. 1999;43(3):853–65. [Google Scholar]
- Caceres-Delpiano Julio. The Impacts of Family Size on Investment in Child Quality. Journal of Human Resources. 2006;41(4):722–37. [Google Scholar]
- Cancian Maria, Meyer Daniel. Testing the Economic Independence Hypothesis. Demography. 2014;51(3):857–80. doi: 10.1007/s13524-014-0295-8. [DOI] [PubMed] [Google Scholar]
- Cancio A Silvia, David Evans T, Maume David. Reconsidering the Declining Significance of Race. American Sociological Review. 1996;61(4):541–56. [Google Scholar]
- Casper Lynne, Cohen Philip. How Does POS-SLQ Measure Up? Demography. 2000;37(2):237–45. [PubMed] [Google Scholar]
- Cohany Sharon, Sok Emy. Trends in Labor Force Participation of Married Mothers with Infants. Monthly Labor Review. 2007;130(2):9–16. [Google Scholar]
- Cover Thomas, Thomas Joy. Elements of Information Theory. 2. Hoboken, NJ: Wiley-Interscience; 2006. [Google Scholar]
- DeLeire Thomas, Lopoo Leonard. Family Structure and the Economic Mobility of Children. Washington, DC: Pew Charitable Trusts; 2010. [Google Scholar]
- Edin Kathryn, Kefalas Maria. Promises I Can Keep: Why Poor Women Put Motherhood Before Marriage. Berkeley: University of California Press; 2005. [Google Scholar]
- Eggebeen David J, Lichter Daniel T. Race, Family Structure, and Changing Poverty among American Children. American Sociological Review. 1991;56(6):801–817. [Google Scholar]
- Ellwood David, Jencks Christopher. The Uneven Spread of Single-Parent Families. In: Neckerman K, editor. Social Inequality. New York: Russell Sage; 2004. pp. 3–78. [Google Scholar]
- Esping-Andersen Gøsta. Sociological Explanations of Changing Income Distributions. American Behavioral Scientist. 2007;50(5):639–58. [Google Scholar]
- Featherman David, Hauser Robert. Changes in the Socioeconomic Stratification of the Races, 1962–1973. American Journal of Sociology. 1976;82(3):621–51. [Google Scholar]
- Ganzeboom Harry, Treiman Donald, Ultee Wout. Comparative Intergenerational Stratification Research. Annual Review of Sociology. 1991;17:277–302. [Google Scholar]
- Garfinkel Irwin, Hoem Jan, McLanahan Sara, Meyer Dan. IRP Discussion Paper 957–91. University of Wisconsin; Madison, WI: 1991. Does a Growing Underclass Threaten to Undermine the Progress of Black Americans? [Google Scholar]
- Gelman Andrew, Carlin John, Stern Hal, Rubin Donald. Bayesian Data Analysis. 2. Boca Raton, FL: Chapman and Hall/CRC Press; 2004. [Google Scholar]
- Guo Gaung, VanWey Leah. Sibship Size and Intellectual Development. American Sociological Review. 1999;64(2):169–87. [Google Scholar]
- Hannan Michael, Tuma Nancy. A Reassessment of the Effect of Income Maintenance on Marital Dissolution in the Seattle-Denver Experiment. American Journal of Sociology. 1990;95(5):1270–98. [Google Scholar]
- Hannan Michael, Tuma Nancy, Groeneveld Lyle. Income and Independence Effects on Marital Dissolution. American Journal of Sociology. 1978;84(3):611–33. [Google Scholar]
- Hertz Tom. Rags, Riches, and Race. In: Bowles S, Gintis H, Osborne M, editors. Unequal Chances. New York: Russell Sage; 2004. pp. 165–91. [Google Scholar]
- Hertz Tom. Trends in the Intergenerational Elasticity of Family Income in the United States. Industrial Relations. 2007;46(1):22–50. [Google Scholar]
- Hogan Dennis, Featherman David. Racial Stratification and Socioeconomic Change in the American North and South. American Journal of Sociology. 1977;83(1):100–126. [Google Scholar]
- Holzer Harry. Black Employment Problems. Journal of Policy Analysis and Management. 1994;13(4):699–722. [Google Scholar]
- Hout Michael. Occupational Mobility of Black Men: 1962–1973. American Sociological Review. 1984;49(3):308–322. [Google Scholar]
- Hout Michael. How Inequality May Affect Intergenerational Mobility. In: Neckerman K, editor. Social Inequality. New York: Russell Sage; 2004. pp. 969–84. [Google Scholar]
- Isaacs Julia. Economic Mobility of Black and White Families. In: Isaacs J, Sawhill I, Haskins R, editors. Getting Ahead or Losing Ground. Washington, DC: Brookings; 2008. pp. 71–80. [Google Scholar]
- Jaynes Gerald, Williams Robin. A Common Destiny. Washington, DC: National Academy Press; 1989. [Google Scholar]
- Karoly Lynn, Burtless Gary. Demographic Change, Rising Earnings Inequality, and the Distribution of Personal Well-Being, 1959–1989. Demography. 1995;32(3):379–405. [PubMed] [Google Scholar]
- Kearney Melissa S. Intergenerational Mobility for Women and Minorities in the United States. Future of Children. 2006;16(2):37–53. doi: 10.1353/foc.2006.0016. [DOI] [PubMed] [Google Scholar]
- King Miriam, Ruggles Steven, Trent Alexander J, Flood Sarah, Genadek Katie, Schroeder Matthew B, Trampe Brandon, Vick Rebecca. Integrated Public Use Microdata Series, Current Population Survey: Version 3.0 [Machine-readable database] Minneapolis: University of Minnesota; 2010. [Google Scholar]
- Lam David. The Dynamics of Population Growth, Differential Fertility, and Inequality. American Economic Review. 1986;76(5):1103–1116. [Google Scholar]
- Landry Bart. The New Black Middle Class. Berkeley: University of California Press; 1988. [Google Scholar]
- Lee Chul-In, Solon Gary. Trends in Intergenerational Income Mobility. Review of Economics and Statistics. 2009;91(4):766–72. [Google Scholar]
- Lichter Daniel T, Eggebeen David J. The Effects of Parental Employment on Child Poverty. Journal of Marriage and Family. 1994;56(3):633–45. [Google Scholar]
- Lichter Daniel, Qian Zhenchao, Crowley Martha. Child Poverty among Racial Minorities and Immigrants. Social Science Quarterly. 2005;86(s1):1037–59. [Google Scholar]
- Lieberson Stanley, Fuguitt Glenn. Negro-White Occupational Differences in the Absence of Discrimination. American Journal of Sociology. 1967;73(2):188–200. doi: 10.1086/224459. [DOI] [PubMed] [Google Scholar]
- Loury Glenn. A Dynamic Theory of Racial Income Differences. In: Wallace P, LaMond A, editors. Women, Minorities and Employment Discrimination. Lexington, MA: Lexington Books; 1977. pp. 153–86. [Google Scholar]
- Manning Wendy, Lichter Daniel. Parental Cohabitation and Children’s Economic Wellbeing. Journal of Marriage and Family. 1996;58(4):998–1010. [Google Scholar]
- Mare Robert. Demography and the Evolution of Educational Inequality. In: Baron J, Grusky D, Treiman D, editors. Social Differentiation and Social Inequality. Boulder, CO: Westview Press; 1996. pp. 117–62. [Google Scholar]
- Mare Robert. Differential Fertility, Intergenerational Educational Mobility, and Racial Inequality. Social Science Research. 1997;26(3):263–91. [Google Scholar]
- Mare Robert. Observations on the Study of Social Mobility and Inequality. In: Grusky D, editor. Social Stratification. 2. Boulder, CO: Westview Press; 2001. pp. 477–88. [Google Scholar]
- Mare Robert. A Multigenerational View of Inequality. Demography. 2011;48(1):1–23. doi: 10.1007/s13524-011-0014-7. [DOI] [PMC free article] [PubMed] [Google Scholar]
- Mare Robert, Schwartz Christine. Educational Assortative Mating and the Family Background of the Next Generation. Sociological Theory and Methods. 2006;21(2):253–77. [Google Scholar]
- Martin Molly. Family Structure and Income Inequality in Families with Children, 1976–2000. Demography. 2006;43(3):421–45. doi: 10.1353/dem.2006.0025. [DOI] [PubMed] [Google Scholar]
- Martin Molly. Family Structure and the Intergenerational Transmission of Educational Advantage. Social Science Research. 2012;41(1):33–47. doi: 10.1016/j.ssresearch.2011.07.005. [DOI] [PMC free article] [PubMed] [Google Scholar]
- Mazumder Bhashkar. Upward Intergenerational Economic Mobility. Washington, DC: Pew Charitable Trusts; 2008. [Google Scholar]
- McCall Leslie, Percheski Christine. Income Inequality: New Trends and Directions. Annual Review of Sociology. 2010;36:329–47. [Google Scholar]
- McLanahan Sara, Percheski Christine. Family Structure and the Reproduction of Inequality. Annual Review of Sociology. 2008;34:257–76. [Google Scholar]
- Meyer Bruce. The Effects of the Earned Income Tax Credit and Recent Reforms. In: Brown J, editor. Tax Policy and the Economy. Vol. 24. Chicago: University of Chicago Press; 2010. pp. 153–80. [Google Scholar]
- Musick Kelly, Mare Robert. Family Structure, Intergenerational Mobility, and the Reproduction of Poverty. Demography. 2004;41(4):629–48. doi: 10.1353/dem.2004.0034. [DOI] [PubMed] [Google Scholar]
- Musick Kelly, Mare Robert. Recent Trends in the Inheritance of Poverty and Family Structure. Social Science Research. 2006;35(2):471–99. [Google Scholar]
- National Vital Statistics System. Detailed Cohort Fertility Files. 2010a. Public-use tables, files and documentation. [Google Scholar]
- National Vital Statistics System. Deaths by Single Years of Age, Race, and Sex. 2010b. Public-use tables and documentation. [Google Scholar]
- National Vital Statistics System. Bridged-Race Population Estimates. 2010c. Public-use data files and documentation. [Google Scholar]
- Oppenheimer Valerie. A Theory of Marriage Timing. American Journal of Sociology. 1988;94(3):563–91. [Google Scholar]
- Oppenheimer Valerie. Women’s Employment and the Gain to Marriage. Annual Review of Sociology. 1997;24:431–53. doi: 10.1146/annurev.soc.23.1.431. [DOI] [PubMed] [Google Scholar]
- Panel Study of Income Dynamics (PSID), public use dataset. Produced and distributed by the Survey Research Center, Institute for Social Research, University of Michigan; Ann Arbor, MI: 2010. [Google Scholar]
- Pomer Marshall. Labor Market Structure, Intergenerational Mobility, and Discrimination. American Sociological Review. 1986;51(5):650–59. [Google Scholar]
- Preston Samuel. Differential Fertility, Unwanted Fertility, and Racial Trends in Occupational Achievement. American Sociological Review. 1974;39(4):492–506. [PubMed] [Google Scholar]
- Preston Samuel, Campbell Cameron. Differential Fertility and the Distribution of Traits. American Journal of Sociology. 1993;98(5):997–1019. [Google Scholar]
- Qian Zhenchao, Lichter Daniel, Crowley Martha. Chinese Children among the Poor. Race and Social Problems. 2010;2(3):137–48. [Google Scholar]
- Raley R Kelly, Sweeney Megan M. Explaining Race and Ethnic Variation in Marriage: Directions for Future Research. Race and Social Problems. 2009;1(3):132–42. [Google Scholar]
- Reskin Barbara. The Race Discrimination System. Annual Review of Sociology. 2012;38:17–35. [Google Scholar]
- Rogers Andrei. Introduction to Multiregional Mathematical Demography. New York: Wiley; 1975. [Google Scholar]
- Ruggles Steven, Trent Alexander J, Genadek Katie, Goeken Ronald, Schroeder Matthew B, Sobek Matthew. Integrated Public Use Microdata Series: Version 5.0 [Machine-readable database] Minneapolis: University of Minnesota; 2010. [Google Scholar]
- Semyonov Moshe, Lewin-Epstein Noah. The Declining Racial Earnings’ Gap in the United States: Multi-level Analysis of Males’ Earnings, 1960–2000. Social Science Research. 2009;38(2):296–311. [Google Scholar]
- Smith James, Welch Finis. Black Economic Progress after Myrdal. Journal of Economic Literature. 1989;27(2):519–61. [Google Scholar]
- Smock Pamela. Cohabitation in the United States. Annual Review of Sociology. 2000;26:1–20. [Google Scholar]
- Theil Henri. Statistical Decomposition Analysis. Amsterdam: North Holland Publishing Co; 1972. [Google Scholar]
- U.S. Census Bureau. Historical Income Tables, F-2W/B, F-7W/B. 2010 ( http://www.census.gov/hhes/www/income/data/historical/families/index.html)
- Welch Finis. Catching Up: Wages of Black Men. American Economic Review. 2003;93(2):320–25. [Google Scholar]
- Western Bruce. Punishment and Inequality in America. New York: Russell Sage; 2006. [Google Scholar]
- Western Bruce, Bloome Deirdre, Percheski Christine. Inequality among American Families with Children, 1975–2005. American Sociological Review. 2008;73(6):903–920. [Google Scholar]
- Wilson William Julius. The Declining Significance of Race. Chicago: University of Chicago Press; 1978. [Google Scholar]
- Wilson William Julius. The Truly Disadvantaged. Chicago: University of Chicago Press; 1987. [Google Scholar]
- Wilson William Julius. When Work Disappears. New York: Alfred A. Knopf; 1996. [Google Scholar]
- Wilson William Julius. The Declining Significance of Race. 3. Chicago: University of Chicago Press; 2012. Afterword; pp. 183–210. [Google Scholar]
Associated Data
This section collects any data citations, data availability statements, or supplementary materials included in this article.