Abstract
Alzheimer's disease (AD) is the most common form of dementia, characterized by progressive loss of cognitive function. One of the pathological hallmarks of AD is the formation of neurofibrillary tangles composed of abnormally hyperphosphorylated tau protein, but global deregulation of protein phosphorylation in AD is not well analyzed. Here we report a pilot investigation of AD phosphoproteome by titanium dioxide enrichment coupled with high resolution liquid chromatography-tandem mass spectrometry (LC-MS/MS). During the optimization of the enrichment method, we found that phosphate ion at a low concentration (e.g. 1 mM) worked efficiently as a non-phosphopeptide competitor to reduce background. The procedure was further tuned with respect to peptide-to-bead ratio, phosphopeptide recovery and purity. Using this refined method and 9 h LC-MS/MS, we analyzed phosphoproteome in one milligram of digested AD brain lysate, identifying 5,243 phosphopeptides containing 3,715 non-redundant phosphosites on 1,455 proteins, including 31 phosphosites on the tau protein. This modified enrichment method is simple and highly efficient. The AD case study demonstrates its feasibility of dissecting phosphoproteome in a limited amount of postmortem human brain.
Keywords: Phosphorylation, phosphopeptide enrichment, LC-MS/MS, human brain, Alzheimer's disease
1. Introduction
Alzheimer's disease (AD) is a progressive neurodegenerative disorder, leading to the loss of memory [1]. There are ∼35.6 million AD patients worldwide. The AD brain is manifested by two pathological hallmarks, amyloid-β assembled plaques and tau-containing neurofibrillary tangles, raising the amyloid [2] and tau hypotheses [3] for AD pathogenesis. Dysregulation of protein phosphorylation has been long known in the AD brain, as exemplified by tau hyperphosphorylation, resulting in the formation of neurofibrillary tangles [4], as well as phosphorylation of neurofilaments [5] and microtubule-associated protein 1B [6]. A growing list of kinases and phosphatases may contribute to such an aberrant modification, such as GSK-3β, microtubule-affinity regulating kinase, cyclin-dependent kinase 5, mitogen-activated protein kinase, serine-arginine protein kinases 2, and protein phosphatase 2A [7, 8]. However, the global phosphorylation alteration in AD is not well characterized, partially due to technical issues in the analysis of human phosphoproteome.
Recent developments of mass spectrometry (MS)-based proteomics technology make it possible to profile phosphoproteome in a large scale [9]. Phosphoproteome is usually analyzed by coupling an enrichment strategy with liquid chromatography-tandem mass spectrometry (LCMS/MS). A number of phosphopeptide enrichment methods have been developed, including immobilized metal or metal oxide affinity chromatography such as Fe3+ ion [10, 11], titanium dioxide (TiO2) [12, 13], titanium nanopolymer [14], cation and anion exchange chromatography [15-17], antibody capture [18-20], calcium phosphate precipitation, chemical derivation [21, 22], and the combination of these methods [23]. TiO2 method gains popularity because of high selectivity, recovery, and reproducibility. Concurrently, the sensitivity of LCMS/MS system is dramatically improved upon the implementation of long columns packed with sub-2 μm resin, and the latest models of high resolution mass spectrometers [24].
Here we describe a simplified, efficient protocol for phosphopeptide enrichment and its application in analyzing postmortem AD brain. The TiO2 enrichment is dependent on affinity binding of a phosphate group to TiO2 through coordinate bonds, in which non-specific binding of carboxyl groups is reduced by the addition of competitors, such as 2,5-dihydroxybenzoic acid, glutamic acid and lactic acid [12, 25]. During the optimization of the method, we have found that free phosphate works as an effective competitor, and the peptide-to-bead ratio should vary upon different samples. Finally, we tested the revised method to analyze the phosphoproteome of one AD case by long gradient LC-MS/MS, identifying more than 5,000 phosphopeptides with false discovery rate of less than 0.5%.
2. Materials and Methods
2.1 Protein sample preparation
Human frozen tissues from prefrontal cortical regions were provided by the Brain and Body Donation Program at Banner Sun Health Research Institute. The AD case was clinically and pathologically characterized in accordance with established criteria [26], and had post-mortem interval of less than 3 h. This study was approved by Banner Sun Health Research Institute. Adult rat brain was purchased from Pel Freez Biologicals.
To extract proteins from brain tissues, the samples were cut with a razor blade and vortexed in the presence of a mixture of three different sizes of glass beads (0.5 mm, 1 mm and 5 mm in diameter, Sigma) in a fresh lysis buffer (50 mM HEPES, pH 8.5, 8 M urea, phosphatase inhibitor cocktail PhosphoSTOP, Roche, and a buffer-to-tissue ratio of ∼10:1 v/v). The lysate was centrifuged at 15,000 × g for 5 min, and the supernatant was quantified by the BCA protein assay (Thermo Fisher Scientific). The protein concentration was confirmed on a very short SDS gel followed by Coomassie staining with titrated BSA as a standard [27].The samples were digested with Lys-C (Wako, 1:100 w/w) at 21 °C for 2h, diluted to 2 M urea with 50 mM HEPES (pH 8.5), and further incubated with trypsin (Promega, 1:50 w/w) at 21 °C overnight. The resulting peptide samples were acidified by adding trifluoroacetic acid (TFA)to 1%, and centrifuged at 21,000 × g for 10 min to remove pellets. The supernatant was desalted with a Sep-Pak C18 cartridge (Waters), eluted by 60% acetonitrile (ACN) plus 1% formic acid, and dried by speedvac for storage at -80 °C.
2.2 Phosphopeptide enrichment
Phosphopeptide enrichment was carried out by TiO2 beads (GL sciences). The dried peptide samples were dissolved in binding buffer (65% ACN, 2% TFA, 1μg/μl). KH2PO4 was added to 1mM unless indicated. The TiO2 beads were washed twice with washing buffer (65%ACN, 0.1%TFA, 200 μl per mg beads), and mixed with the peptide solutions with a ratio of 4:1 (w/w) unless indicated. After 20 min end-over-end rotation at 21°C, the samples were briefly centrifuged to collect the beads at the bottom. For consecutive enrichment, the supernatant (equivalent to flowthrough) was transferred to incubate with another aliquot of TiO2 beads. After incubation, the phosphopeptide-bound beads were washed twice with wash buffer (200 μl per mg beads), resuspended into 50 μl of wash buffer and transferred to a C18StageTip (Thermo Fisher Scientific) on the top of a 2-ml centrifuge tube. The residual beads in the incubation tube were collected by another 50 μl of wash buffer and transferred to the StageTip. The StageTip was centrifuged to remove the buffer, and phosphopeptides were eluted under basic pH condition (15% NH4OH, 40% ACN, at least 10 μl per mg beads). The eluents were dried and dissolved in 5% formic acid for LC-MS/MS analysis.
2.3 Long gradient LC-MS/MS
Enriched phosphopeptide samples were loaded on a C18column (∼1 m × 75 μm ID) packed with 1.9 μm resin (Dr.Maisch GmbH, Germany), and eluted during a 9 h gradient (∼0.15 μl/min; 7% - 45%; buffer A: 0.2% formic acid, 5% DMSO; buffer B: buffer A plus 65% ACN). The column was heated at 65 °C by a butterfly portfolio heater (Phoenix S&T) to reduce backpressure. The eluted peptides were analyzed on Orbitrap Elite MS (Thermo Fisher Scientific) with one MS scan (240,000 resolution, 1 × 10⁶ automatic gain control, and 100 ms maximal ion time) and top 20 low resolution MS/MS scans (rapid collision-induced dissociation, 3,000 automatic gain control, 200 ms maximal ion time, 2 m/z isolation window, 35 normalized collision energy, and 45 s dynamic exclusion). Charge state screening was set to preclude precursor ions of single charge or unassigned charge.
Tandem MS raw files were converted into mz XML format and searched against Uniprot human database by Sequest algorithm (v28,revision 13). The target-decoy strategy was used to estimate false discovery rate (FDR) [28, 29]. Spectra were matched with a mass tolerance of ±10 ppm for precursor ions and ±0.5 Da for product ions, partially tryptic restriction and 3 maximal miscleavages. Dynamic mass shift parameters included oxidized Met (+15.9949), phosphorylated Ser/Thr/Tyr (+79.9663), and 5 maximal modification sites. Only b and y ions were scored. Matched peptides were filtered by linear discriminant analysis to reduce peptide false discovery rate of <0.5%, based on numerous parameters including XCorr, ΔCn, precursor mass error, and charge state [30]. The confidence of each phosphopeptide site assignment was determined by the Ascore program [31]. The minimal Ascore for an unambiguous site was 13 (p< 0.05).
The mass spectrometry-based proteomics data have been deposited to the ProteomeXchange Consortium (http://proteomecentral.proteomexchange.org) via the PRIDE partner repository [32] with the dataset identifier PXD001180.
3. Results and Discussion
Postmortem AD brain samples have been extensively investigated by numerous proteomics platforms [33-38], but systematic analysis of AD phosphoproteome has rarely reported [39]. In 2008, we reported a preliminary analysis of 466 phosphorylation sites in AD phosphoproteome [40]. With the maturation of phosphopeptide-enrichment and LC-MS/MS methods, we determined to revisit this project and evaluate the current technology to dissect AD phosphoproteome.
3.1 Optimization of TiO2 phosphopeptide enrichment using phosphate competitor
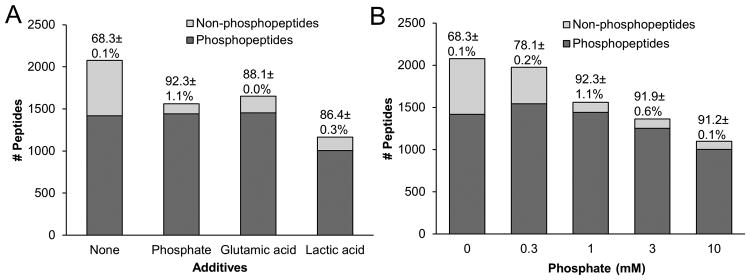
Because of the limitation of diseased human samples, we sought to optimize the method of phosphopeptide enrichment from a relatively low level of total protein. In contrast to ∼10 mg of protein usually reported in phosphoproteome studies, we used 0.5 mg of rat brain lysate as a test sample and selected the commonly used TiO2 method. During our tests of various additives in the method, we reasoned that a low concentration of free phosphate may function to reduce non-specific binding, as in coordinate bond-based Nickel affinity purification, a low level of imidazole (e.g. 5 mM) is recommended to decrease binding of contaminants, and a high level of imidazole (e.g. 500 mM) is used to elute His-tagged proteins. Indeed, when the incubation was performed without or with 1 mM of free phosphate, the percentage of phosphopeptides identified by LC-MS/MS increased from 68.3±0.1% to 92.3±1.1%, while the number of phosphopeptides also increased slightly (Fig. 1A). More importantly, compared to some widely used additives, such as glutamic acid [41] and lactic acid [25], free phosphate gave similar or even better result, with respect to purity (i.e. the percentage of phosphopeptides) and efficiency (i.e. the number of phosphopeptides identified, Fig. 1A).
Figure 1.
Optimization of TiO2 phosphopeptide enrichment using 0.5 mg of rat brain lysate and various additives to reduce the binding of non-phosphopeptides. Peptide-to-bead ratio is 1:4 (w/w). (A) The number and percentage of identified phosphopeptides without and with three additives:1 mM phosphate, saturated glutamic acid and 2 M lactic acid, respectively. The isolated peptides were analyzed by 1 h LC-MS/MS. (B) The effect of titrated levels of phosphate on phosphopeptide enrichment.
As phosphate is more convenient and affordable to use than highly concentrated glutamic acid or lactic acid, we determined to optimize the use of phosphate as the additive and characterized the effect of phosphate concentration on the output of phosphopeptide enrichment. With increasing levels of phosphate from 0, 0.3, 1, 3 to 10 mM, co-purified nonphosphopeptides decreased from 31.7% to 8.8% (Fig. 1B).The total number of detected phosphopeptides initially increased and then dropped with the high levels of phosphate. The results suggest dynamic competition of free phosphate and phosphopeptides for binding to TiO2 beads, which is a concentration-dependent process.
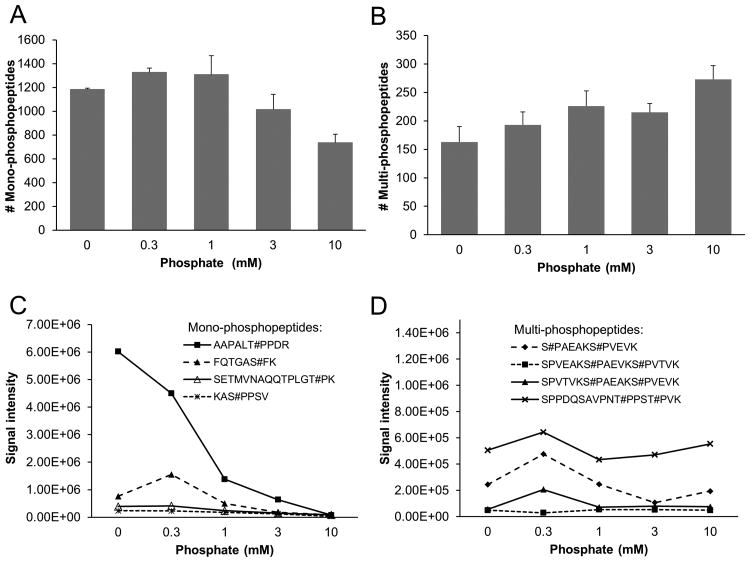
As mono- or multi-site phosphopeptides display different affinity to the TiO2 beads, we compared these peptides during the titration of phosphate. As anticipated, monophosphopeptide identification reached a plateau at 1 mM phosphate, and then decreased with the addition of more phosphate (Fig. 2A). In contrast, multi-site phosphopeptide identification was more resistant to the high levels of phosphate, with a minor increase at 10 mM phosphate (Fig. 2B). Overall, the level of 1 mM phosphate represented a reasonable balance between sensitivity and specificity.
Figure 2.
Comparison of mono- and multi-phosphopeptides during the titration of phosphate. (A-B) The total numbers of identified mono- and multi-site phosphopeptides. The LC-MS/MS experiments were repeated and the standard deviations are shown. (C-D) The recovery of representative mono- and multi-site phosphopeptides,shown by extracted ion currents during the LC-MS/MS runs.
In addition, we examined the recovery of a number of representative phosphopeptides during the phosphate titration by measuring extraction ion currents in LC-MS/MS. Consistent with the identification results, the mono-site phosphopeptides showed a sharp reduction along with high levels of phosphate, the multi-site phosphopeptides exhibited more steady levels, reflecting their strong affinity to the beads (Fig. 2C-D). As an example of the peptide (AAPALT#PPDR, Thr phosphorylated), its ion currents were 6E6, 4.5E6, 1.5E6, 8E5, and 2E5 at 0, 0.3, 1, 3, 10 mM phosphate, respectively, suggesting that a large portion of the peptide was not recovered at the condition of 1 mM phosphate.
3.2 Evaluation of peptide-to-bead ratio during phosphopeptide enrichment
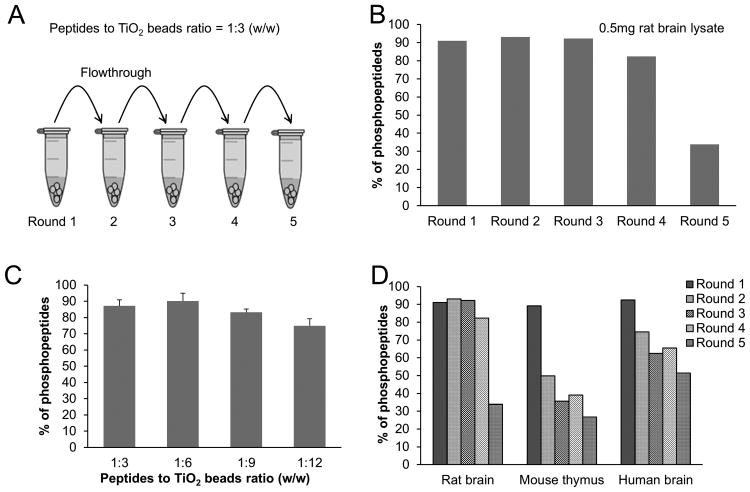
In recognition of limited recovery of phosphopeptides in the above one-step enrichment (peptideto-bead ratio of 1:4) [41], we systematically analyzed the relationship between samples and the TiO2 beads in three experiments. First, a serial depletion was performed with peptide-to-bead ratio of 1:3, in which the unbound peptides in flow through of the first incubation was reincubated with a new aliquot of beads, and so on (Fig. 3A). The percentage of identified phosphopeptides was not dramatically changed until the fifth incubation (Fig. 3B), implicating that sufficient phosphopeptides may be present in the sample during the first four incubations, and a maximal peptide-to-bead ratio of 1:12 might be used. Second, we carried out the enrichment analysis with different peptide-to-bead ratios of 1:3, 1:6, 1:9 and 1:12. As expected, the four datasets appeared to be similar, although a trend of reduction at the ratios of 1:9 and 1:12 was observed(Fig. 3C), suggesting a minor increase of background binding with the high amounts of beads. Third, we tested if different samples contained different levels of phosphopeptides by performing serial depletion experiments using rat brain, mouse thymus and human AD brain. Although all of the three samples showed reduced phosphopeptides after multiple rounds of incubation, the rate of depletion for each sample was different (Fig. 3D), suggesting that the phosphopeptide level was the highest in the rat brain sample, and the lowest in the mouse thymus sample. The difference among samples may be intrinsic to the selected tissues and may be also contributed by de-phosphorylation during sample preparation, as well as experimental variations in peptide recovery and quantification. Hence, the ideal peptide-to-bead ratio could vary from 1:6 (e.g. rat brain) to 1:3 (e.g. mouse thymus), depending on the content of phosphopeptides in the sample.
Figure 3.
Effect of peptide-to-bead ratio on the selectivity of phosphopeptide enrichment. The LCMS/MS analysis was repeated with the average of relative standard deviation <10%. (A) Schematic of consecutive phosphopeptide enrichment (peptide-to-bead ratio of 1:3). (B) Percentage of phosphopeptides identified in the five incubations of 0.5 mg rat brain. (C) Percentage of phosphopeptides when different peptide-to-bead ratios were applied. (D) Examining the total level of phosphopeptides in different samples by five consecutive incubations: 0.5 mg of rat brain, mouse thymus and human AD brain, with peptide-to-bead ratio of 1:3.
3.3 Analysis of AD phosphoproteome
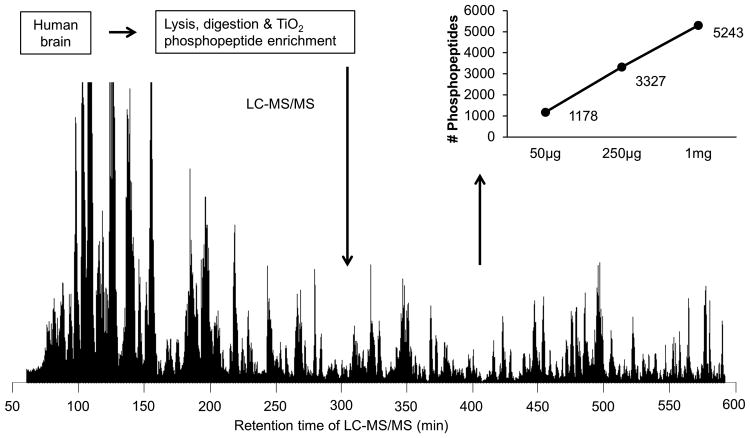
Finally, we used the optimized protocol to analyze the phosphoproteome in one AD case (Fig. 4). To evaluate the sensitivity of the pipeline, we started with three amounts of brain tissue protein (50 μg, 250 μg, and 1 mg) for phosphopeptide enrichment and long gradient LC-MS/MS (9 h). With 50 μg of protein, we identified 1,178 unique phosphopeptides containing 851 phosphosites on 465 proteins. When using 250 μg of protein, we detected 3,327 phosphopeptides consisting of 2,274 phosphosites on 1,007 proteins. In the case of 1 mg of protein, the long gradient run resulted in ∼80,000 MS/MS spectra, approximately 20% (∼16,000 spectra) of which were successfully matched to human database, leading to the identification of 5,243 phosphopeptides, including 3,715 phosphosites on 1,455 proteins (Supplemental Table S1).As the identified phosphopeptides increased almost linearly with the level of protein (Fig. 4), our data indicate that the amount of starting material is a limiting factor for profiling the phosphoproteome by a long gradient LC-MS/MS system.
Figure 4.
Phosphoproteome analysis of human AD brain. Human brain tissues were lysed, digested and enriched with the optimized TiO2 method (1 mM phosphate and peptide-to-bead ratio of 1:6). Three different levels of total protein were used. The enriched phosphopeptides were resolved during a long gradient (9 h) on a heated reverse phase column (∼1 m × 75 μm ID) and analyzed by tandem MS.
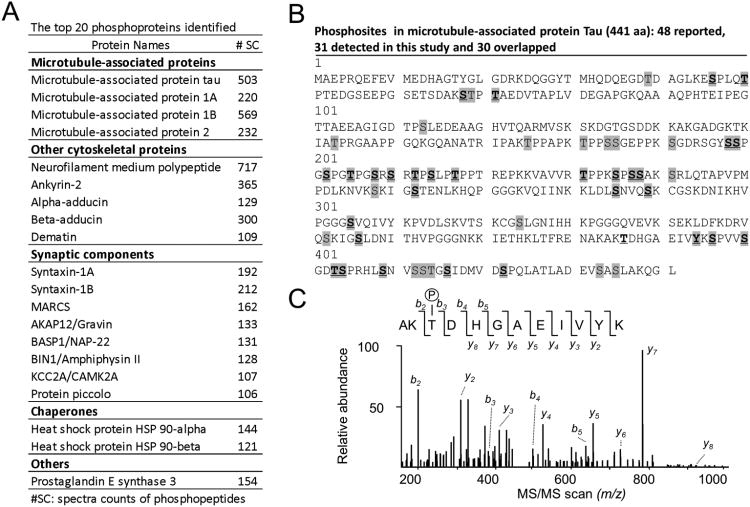
We then evaluated the abundance of identified phosphoproteins by spectral counts and categorized the top 20 proteins into functional groups, such as microtubule-associated proteins, other cytoskeletal proteins, synaptic components, and chaperones (Fig. 5A). This list of the most abundant phosphoproteins is highly similar to that in our previous analysis in which only 466 phosphosites were determined [40]. Interestingly, a large number of synaptic proteins were found to be highly phosphorylated, including syntaxin, MARCS, AKAP12, BASP1, BIN1, CAMK2A and piccolo. Genome-wide association studies recently identified BIN1 gene as an important genetic susceptibility locus in AD [42].Future quantitative analysis is required to address whether the phosphorylated states of these proteins are altered in AD.
Figure 5.
(A) The top 20 most abundant phosphoproteins identified in the AD case. The abundance was estimated by the sum of spectra counts of phosphopeptides assigned to individual proteins. (B) The mapping of phosphosites in tau (2N4R isoform of 441 residues). All previously reported sites were highlighted in grey, whereas the identified sites in this study was shown in bold and underlined. (C) The MS/MS scan matched to a phosphopeptide.
As an example, we examined the phosphorylation of tau in detail (Fig. 5B), as tau is the most characterized phosphoprotein in AD and its aberrant hyperphosphorylation is believed to contribute to neurodegeneration and dementia [8]. Tau is expressed from a single human gene but in six splicing isoforms. The longest form consists of 441 amino acids, including 85 Ser/Thr/Tyr putative phosphorylation sites. A total of 48 phosphosites in tau were previously detected by the approaches of immunodetection and/or mass spectrometric analysis of purified tau protein [8]. In this direct analysis without tau purification, we identified 31 phosphosites, out of which 30 sites overlapped with the reported list. The other site (T386) was supported by three independently detected phosphopeptides: AKT#DHGAEIVYK (Fig. 5C); T#DHGAEIVYKS#PVVS#GDTSPR; and T#DHGAEIVYKS#PVVSGDTSPR. We anticipate that an in-depth analysis using enhanced separation power (e.g. two dimensional LC) and a high level of sample (e.g. 10 mg protein) will increase the AD phosphoproteome coverage and thus reveal phosphosites missed in this pilot study.
4. Concluding Remarks
We present in this study the refinement of TiO2 enrichment using a low concentration of phosphate as an additive to improve selectivity. The protocol is simple, effective and robust. It becomes the standard protocol in our lab and proteomics facility and has been successfully applied in the analysis of a variety of biological samples. In the case of phosphoproteome investigation in AD, we show a pilot study to demonstrate the feasibility of extracting and recovering phosphopeptides from autopsy brain specimens, enabling the detection of over 5,000 phosphopeptides in 1 mg total protein in a single long gradient run. Quantitative phosphoproteome analysis including isobaric labeling methods of iTRAQ and TMT [43, 44], will enable the comparison of AD and other brain samples to probe phosphoprotein alterations associated with disease development.
Supplementary Material
Acknowledgments
The authors thank all lab members for helpful discussion, and Dr. Steven Gygi for data analysis. This work was partially supported by NIH grant R21AG039764, U24NS072026, P30AG19610, Arizona Department of Health Services (contract 211002), the Arizona Biomedical Research Commission (contracts 4001, 0011, 05-901 and 1001), the Michael J. Fox Foundation, and ALSAC (American Lebanese Syrian Associated Charities). The MS analysis was performed in the St. Jude Children's Research Hospital Proteomics Facility, partially supported by NIH Cancer Center Support Grant (P30CA021765).
Abbreviations
- LC
liquid chromatography
- MS
mass spectrometry
- AD
Alzheimer's disease
Footnotes
The authors have declared no conflicts of interest.
References
- 1.2012 Alzheimer's disease facts and figures. Alzheimers Dement. 2012;8:131–168. doi: 10.1016/j.jalz.2012.02.001. [DOI] [PubMed] [Google Scholar]
- 2.Hardy J, Selkoe DJ. The amyloid hypothesis of Alzheimer's disease: progress and problems on the road to therapeutics. Science. 2002;297:353–356. doi: 10.1126/science.1072994. [DOI] [PubMed] [Google Scholar]
- 3.Ballatore C, Lee VM, Trojanowski JQ. Tau-mediated neurodegeneration in Alzheimer's disease and related disorders. Nat Rev Neurosci. 2007;8:663–672. doi: 10.1038/nrn2194. [DOI] [PubMed] [Google Scholar]
- 4.Kosik KS, Joachim CL, Selkoe DJ. Microtubule-associated protein tau (tau) is a major antigenic component of paired helical filaments in Alzheimer disease. Proc Natl Acad Sci U S A. 1986;83:4044–4048. doi: 10.1073/pnas.83.11.4044. [DOI] [PMC free article] [PubMed] [Google Scholar]
- 5.Sternberger NH, Sternberger LA, Ulrich J. Aberrant neurofilament phosphorylation in Alzheimer disease. Proc Natl Acad Sci U S A. 1985;82:4274–4276. doi: 10.1073/pnas.82.12.4274. [DOI] [PMC free article] [PubMed] [Google Scholar]
- 6.Ulloa L, Montejo de Garcini E, Gomez-Ramos P, Moran MA, Avila J. Microtubule associated protein MAP1B showing a fetal phosphorylation pattern is present in sites of neurofibrillary degeneration in brains of Alzheimer's disease patients. Brain Res Mol Brain Res. 1994;26:113–122. doi: 10.1016/0169-328x(94)90081-7. [DOI] [PubMed] [Google Scholar]
- 7.Dolan PJ, Johnson GV. The role of tau kinases in Alzheimer's disease. Current opinion in drug discovery & development. 2010;13:595–603. [PMC free article] [PubMed] [Google Scholar]
- 8.Wang JZ, Xia YY, Grundke-Iqbal I, Iqbal K. Abnormal Hyperphosphorylation of Tau: Sites, Regulation, and Molecular Mechanism of Neurofibrillary Degeneration. J Alzheimers Dis. 2013;33:S123–S139. doi: 10.3233/JAD-2012-129031. [DOI] [PubMed] [Google Scholar]
- 9.Macek B, Mann M, Olsen JV. Global and site-specific quantitative phosphoproteomics: principles and applications. Annu Rev Pharm Toxicol. 2009;49:199–221. doi: 10.1146/annurev.pharmtox.011008.145606. [DOI] [PubMed] [Google Scholar]
- 10.Ficarro SB, McCleland ML, Stukenberg PT, Burke DJ, et al. Phosphoproteome analysis by mass spectrometry and its application to Saccharomyces cerevisiae. Nat Biotechnol. 2002;20:301–305. doi: 10.1038/nbt0302-301. [DOI] [PubMed] [Google Scholar]
- 11.Nuhse TS, Stensballe A, Jensen ON, Peck SC. Large-scale analysis of in vivo phosphorylated membrane proteins by immobilized metal ion affinity chromatography and mass spectrometry. Mol Cell Proteomics. 2003;2:1234–1243. doi: 10.1074/mcp.T300006-MCP200. [DOI] [PubMed] [Google Scholar]
- 12.Larsen MR, Thingholm TE, Jensen ON, Roepstorff P, Jorgensen TJ. Highly selective enrichment of phosphorylated peptides from peptide mixtures using titanium dioxide microcolumns. Mol Cell Proteomics. 2005;4:873–886. doi: 10.1074/mcp.T500007-MCP200. [DOI] [PubMed] [Google Scholar]
- 13.Olsen JV, Blagoev B, Gnad F, Macek B, et al. Global, In Vivo, and Site-Specific Phosphorylation Dynamics in Signaling Networks. Cell. 2006;127:635–648. doi: 10.1016/j.cell.2006.09.026. [DOI] [PubMed] [Google Scholar]
- 14.Iliuk A, Martinez JS, Hall MC, Tao WA. Phosphorylation assay based on multifunctionalized soluble nanopolymer. Anal Chem. 2011;83:2767–2774. doi: 10.1021/ac2000708. [DOI] [PMC free article] [PubMed] [Google Scholar]
- 15.Ballif BA, Villen J, Beausoleil SA, Schwartz D, Gygi SP. Phosphoproteomic analysis of the developing mouse brain. Mol Cell Proteomics. 2004;3:1093–1101. doi: 10.1074/mcp.M400085-MCP200. [DOI] [PubMed] [Google Scholar]
- 16.Beausoleil SA, Jedrychowski M, Schwartz D, Elias JE, et al. Large-scale characterization of HeLa cell nuclear phosphoproteins. Proc Natl Acad Sci U S A. 2004;101:12130–12135. doi: 10.1073/pnas.0404720101. [DOI] [PMC free article] [PubMed] [Google Scholar]
- 17.Motoyama A, Xu T, Ruse CI, Wohlschlegel JA, Yates JR., 3rd Anion and cation mixed-bed ion exchange for enhanced multidimensional separations of peptides and phosphopeptides. Anal Chem. 2007;79:3623–3634. doi: 10.1021/ac062292d. [DOI] [PMC free article] [PubMed] [Google Scholar]
- 18.Steen H, Kuster B, Fernandez M, Pandey A, Mann M. Tyrosine phosphorylation mapping of the epidermal growth factor receptor signaling pathway. J Biol Chem. 2002;277:1031–1039. doi: 10.1074/jbc.M109992200. [DOI] [PubMed] [Google Scholar]
- 19.Pandey A, Podtelejnikov AV, Blagoev B, Bustelo XR, et al. Analysis of receptor signaling pathways by mass spectrometry: identification of vav-2 as a substrate of the epidermal and platelet-derived growth factor receptors. Proc Natl Acad Sci U S A. 2000;97:179–184. doi: 10.1073/pnas.97.1.179. [DOI] [PMC free article] [PubMed] [Google Scholar]
- 20.Rush J, Moritz A, Lee KA, Guo A, et al. Immunoaffinity profiling of tyrosine phosphorylation in cancer cells. Nat Biotechnol. 2005;23:94–101. doi: 10.1038/nbt1046. [DOI] [PubMed] [Google Scholar]
- 21.Zhou H, Watts JD, Aebersold R. A systematic approach to the analysis of protein phosphorylation. Nat Biotechnol. 2001;19:375–378. doi: 10.1038/86777. [DOI] [PubMed] [Google Scholar]
- 22.McLachlin DT, Chait BT. Analysis of phosphorylated proteins and peptides by mass spectrometry. Curr Opin Chem Biol. 2001;5:591–602. doi: 10.1016/s1367-5931(00)00250-7. [DOI] [PubMed] [Google Scholar]
- 23.Villen J, Beausoleil SA, Gerber SA, Gygi SP. Large-scale phosphorylation analysis of mouse liver. Proc Natl Acad Sci U S A. 2007;104:1488–1493. doi: 10.1073/pnas.0609836104. [DOI] [PMC free article] [PubMed] [Google Scholar]
- 24.Nagaraj N, Kulak NA, Cox J, Neuhauser N, et al. System-wide perturbation analysis with nearly complete coverage of the yeast proteome by single-shot ultra HPLC runs on a bench top Orbitrap. Mol Cell Proteomics. 2012;11:M111 013722. doi: 10.1074/mcp.M111.013722. [DOI] [PMC free article] [PubMed] [Google Scholar]
- 25.Kettenbach AN, Gerber SA. Rapid and reproducible single-stage phosphopeptide enrichment of complex peptide mixtures: application to general and phosphotyrosine-specific phosphoproteomics experiments. Anal Chem. 2011;83:7635–7644. doi: 10.1021/ac201894j. [DOI] [PMC free article] [PubMed] [Google Scholar]
- 26.Hyman BT, Trojanowski JQ. Consensus recommendations for the postmortem diagnosis of Alzheimer disease from the National Institute on Aging and the Reagan Institute Working Group on diagnostic criteria for the neuropathological assessment of Alzheimer disease. J Neuropathol Exp Neurol. 1997;56:1095–1097. doi: 10.1097/00005072-199710000-00002. [DOI] [PubMed] [Google Scholar]
- 27.Xu P, Duong DM, Peng J. Systematical optimization of reverse-phase chromatography for shotgun proteomics. J Proteome Res. 2009;8:3944–3950. doi: 10.1021/pr900251d. [DOI] [PMC free article] [PubMed] [Google Scholar]
- 28.Peng J, Elias JE, Thoreen CC, Licklider LJ, Gygi SP. Evaluation of multidimensional chromatography coupled with tandem mass spectrometry (LC/LC-MS/MS) for large-scale protein analysis: the yeast proteome. J Proteome Res. 2003;2:43–50. doi: 10.1021/pr025556v. [DOI] [PubMed] [Google Scholar]
- 29.Elias JE, Gygi SP. Target-decoy search strategy for increased confidence in large scale protein identifications by mass spectrometry. Nat Methods. 2007;4:207–214. doi: 10.1038/nmeth1019. [DOI] [PubMed] [Google Scholar]
- 30.Jedrychowski MP, Huttlin EL, Haas W, Sowa ME, et al. Evaluation of HCD- and CID-type Fragmentation Within Their Respective Detection Platforms For Murine Phosphoproteomics. Mol Cell Proteomics. 2011;10 doi: 10.1074/mcp.M111.009910. [DOI] [PMC free article] [PubMed] [Google Scholar]
- 31.Beausoleil SA, Villen J, Gerber SA, Rush J, Gygi SP. A probability-based approach for high-throughput protein phosphorylation analysis and site localization. Nat Biotechnol. 2006;24:1285–1292. doi: 10.1038/nbt1240. [DOI] [PubMed] [Google Scholar]
- 32.Vizcaino JA, Deutsch EW, Wang R, Csordas A, et al. ProteomeXchange provides globally coordinated proteomics data submission and dissemination. Nat Biotechnol. 2014;32:223–226. doi: 10.1038/nbt.2839. [DOI] [PMC free article] [PubMed] [Google Scholar]
- 33.Liao L, Cheng D, Wang J, Duong DM, et al. Proteomic characterization of postmortem amyloid plaques isolated by laser capture microdissection. J Biol Chem. 2004;279:37061–37068. doi: 10.1074/jbc.M403672200. [DOI] [PubMed] [Google Scholar]
- 34.Gozal YM, Duong DM, Gearing M, Cheng D, et al. Proteomics analysis reveals novel components in the detergent-insoluble subproteome in Alzheimer's disease. J Proteome Res. 2009;8:5069–5079. doi: 10.1021/pr900474t. [DOI] [PMC free article] [PubMed] [Google Scholar]
- 35.Thomas SN, Cripps D, Yang AJ. Proteomic analysis of protein phosphorylation and ubiquitination in Alzheimer's disease. Methods in molecular biology. 2009;566:109–121. doi: 10.1007/978-1-59745-562-6_8. [DOI] [PMC free article] [PubMed] [Google Scholar]
- 36.Bai B, Hales CM, Chen PC, Gozal Y, et al. U1 small nuclear ribonucleoprotein complex and RNA splicing alterations in Alzheimer's disease. Proc Natl Acad Sci U S A. 2013;110:16562–16567. doi: 10.1073/pnas.1310249110. [DOI] [PMC free article] [PubMed] [Google Scholar]
- 37.Andreev VP, Petyuk VA, Brewer HM, Karpievitch YV, et al. Label-free quantitative LC-MS proteomics of Alzheimer's disease and normally aged human brains. J Proteome Res. 2012;11:3053–3067. doi: 10.1021/pr3001546. [DOI] [PMC free article] [PubMed] [Google Scholar]
- 38.Begcevic I, Kosanam H, Martinez-Morillo E, Dimitromanolakis A, et al. Semiquantitative proteomic analysis of human hippocampal tissues from Alzheimer's disease and age-matched control brains. Clinical proteomics. 2013;105 doi: 10.1186/1559-0275-10-5. [DOI] [PMC free article] [PubMed] [Google Scholar]
- 39.Zahid S, Oellerich M, Asif AR, Ahmed N. Phosphoproteome profiling of substantia nigra and cortex regions of Alzheimer's disease patients. J Neurochem. 2012;121:954–963. doi: 10.1111/j.1471-4159.2012.07737.x. [DOI] [PubMed] [Google Scholar]
- 40.Xia Q, Cheng D, Duong DM, Gearing M, et al. Phosphoproteomic analysis of human brain by calcium phosphate precipitation and mass spectrometry. J Proteome Res. 2008;7:2845–2851. doi: 10.1021/pr8000496. [DOI] [PMC free article] [PubMed] [Google Scholar]
- 41.Li QR, Ning ZB, Tang JS, Nie S, Zeng R. Effect of peptide-to-TiO2 beads ratio on phosphopeptide enrichment selectivity. J Proteome Res. 2009;8:5375–5381. doi: 10.1021/pr900659n. [DOI] [PubMed] [Google Scholar]
- 42.Guerreiro R, Bras J, Hardy J. SnapShot: genetics of Alzheimer's disease. Cell. 2013;155:968–968 e961. doi: 10.1016/j.cell.2013.10.037. [DOI] [PubMed] [Google Scholar]
- 43.Ross PL, Huang YN, Marchese JN, Williamson B, et al. Multiplexed protein quantitation in Saccharomyces cerevisiae using amine-reactive isobaric tagging reagents. Mol Cell Proteomics. 2004;3:1154–1169. doi: 10.1074/mcp.M400129-MCP200. [DOI] [PubMed] [Google Scholar]
- 44.Thompson A, Schafer J, Kuhn K, Kienle S, et al. Tandem mass tags: a novel quantification strategy for comparative analysis of complex protein mixtures by MS/MS. Anal Chem. 2003;75:1895–1904. doi: 10.1021/ac0262560. [DOI] [PubMed] [Google Scholar]
Associated Data
This section collects any data citations, data availability statements, or supplementary materials included in this article.


