Abstract
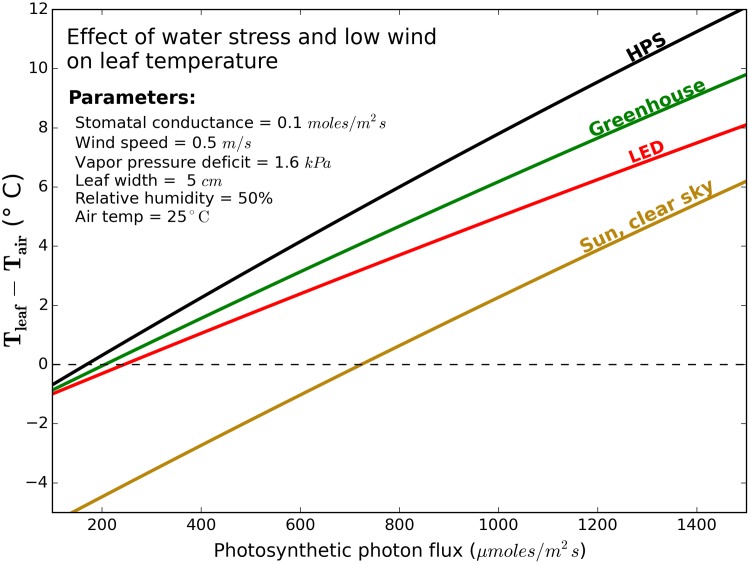
The use of LED technology is commonly assumed to result in significantly cooler leaf temperatures than high pressure sodium technology. To evaluate the magnitude of this effect, we measured radiation incident to and absorbed by a leaf under four radiation sources: clear sky sunlight in the field, sunlight in a glass greenhouse, and indoor plants under either high pressure sodium or light emitting diodes. We then applied a common mechanistic energy-balance model to compare leaf to air temperature difference among the radiation sources and environments. At equal photosynthetic photon flux, our results indicate that the effect of plant water status and leaf evaporative cooling is much larger than the effect of radiation source. If plants are not water stressed, leaves in all four radiation sources were typically within 2°C of air temperature. Under clear sky conditions, cool sky temperatures mean that leaves in the field are always cooler than greenhouse or indoor plants-when photosynthetic photon flux, stomatal conductance, wind speed, vapor pressure deficit, and leaf size are equivalent. As water stress increases and cooling via transpiration decreases, leaf temperatures can increase well above air temperature. In a near-worst case scenario of water stress and low wind, our model indicates that leaves would increase 6°, 8°, 10°, and 12°C above air temperature under field, LED, greenhouse, and HPS scenarios, respectively. Because LED fixtures emit much of their heat through convection rather than radiative cooling, they result in slightly cooler leaf temperatures than leaves in greenhouses and under HPS fixtures, but the effect of LED technology on leaf temperature is smaller than is often assumed. Quantifying the thermodynamic outputs of these lamps, and their physiological consequences, will allow both researchers and the horticulture industry to make informed decisions when employing these technologies.
Introduction
Light emitting diodes (LEDs) have shown to be a disruptive technology in all areas of illumination. Large (>200 watt) LED fixtures have become commercially available for both sole source (growth chamber) and supplemental (greenhouse) plant lighting. At the same time, the more traditional high pressure sodium (HPS) technology has also improved in efficiency by as much as 60% [1]. Though the spectral effects of different light sources have been studied, there have been few studies on the thermodynamics of these new lighting systems. The thermal properties of fixtures are of consequence both for researchers, as differences in leaf temperature and transpiration can change experimental outcomes, and for the horticulture industry, as heating and cooling costs may be different under different sources and hot lamps may damage plant tissue.
The energy balance of leaves has long been studied in field conditions and a well-developed family of models is used to determine transpiration and leaf temperature over a wide range of environmental conditions, including controlled environments [2–5]. These models are well developed, and are used to predict values that are hard to measure directly, such as leaf temperature and evapotranspiration [6]. Models also provide the opportunity to compare individual parameters while keeping all other environmental conditions exactly the same. This facilitates comparison of radiation sources.
Although linearization of energy balance models, such as the Penman-Monteith equation, has been widely used, modern computing allows for more precise numerical solutions of leaf temperature. Widmoser [7] discusses the advantages of using numerical solutions.
A recent analysis showed that the conversion efficiency of electricity to photosynthetic photons of the most efficient commercial scale LED fixtures was equal to the most efficient HPS fixtures at 1.7 μmol photosynthetic photos per joule of electrical input [1]. They thus generate the same amount of thermal energy per photosynthetic photon. LED fixtures, however, dissipate much of their heat away from the plane they illuminate, while HPS fixtures dissipate more heat toward the plane they illuminate.
Elevated temperature reduces the lifespan of LEDs, so they are thermally-bonded to heat sinks where the thermal energy is removed by natural or fan-assisted convection and directed away from the plants they illuminate.
Conversely, HPS lamps operate at higher temperatures and thus generate more longwave radiation in the same direction as the photosynthetic radiation. This thermal radiation can be reduced using a barrier such as glass, but this reduces the photosynthetic radiation by about 10% (S1 Fig) and thus lowers the efficiency of the fixture.
The difference in how LED and HPS technologies dissipate thermal energy indicates that use of HPS fixtures will result in higher leaf temperatures. It is easy to misjudge the magnitude of this effect because HPS lamps are a far more concentrated light source than LEDs. Comparisons need to be made on the basis of equal photosynthetic photon flux (PPF).
Compared to sunlight and HPS lamps, LED fixtures emit almost no near infrared radiation (NIR; 700–3000 nm), but this radiation is not well absorbed by plant leaves. Photosynthetic (400 to 700 nm) and longwave (3,000 to 100,000 nm) radiation are about 95% absorbed, but non-photosynthetic solar NIR is only about 20% absorbed, and has a smaller effect on leaf heating. Unabsorbed radiation is either transmitted or reflected.
Our objective was to use a well-established energy-balance model to compare the leaf-to-air temperature difference in four radiation scenarios across multiple environments.
Materials and Methods
Radiation sources
We measured the radiation from four sources: clear sky sun in the field, clear sky sun in a greenhouse, and either HPS or LED fixtures in indoor environments (devoid of sunlight). The most efficient commercially-available HPS and LED fixtures (1.7 μmol/J; [1]) were used. The HPS fixture included a double-ended, 1000 W lamp (MASTER GreenPower, Philips Lighting, The Netherlands) in an efficient (less then 10% losses) luminaire (ePapillon, Lights Interaction, The Netherlands). The LED fixture was a 400 W, Red-Blue, passively cooled fixture (VividGro, Lighting Science Group, FL, USA). In order to quantify radiation conditions where the thermal and photosynthetic components are most intense, clear sky sun measurements were made near solar noon on a clear summer day in Logan, UT, USA. Greenhouse sun measurements were made under clear sky conditions in a typical glass greenhouse. All measurements were scaled to PPF to account for differences in fixture height. As a canopy gets closer to the fixture all types of radiation increase.
Absorption of shortwave radiation
We measured shortwave absorption as the fraction of light that is neither transmitted nor reflected by a leaf.
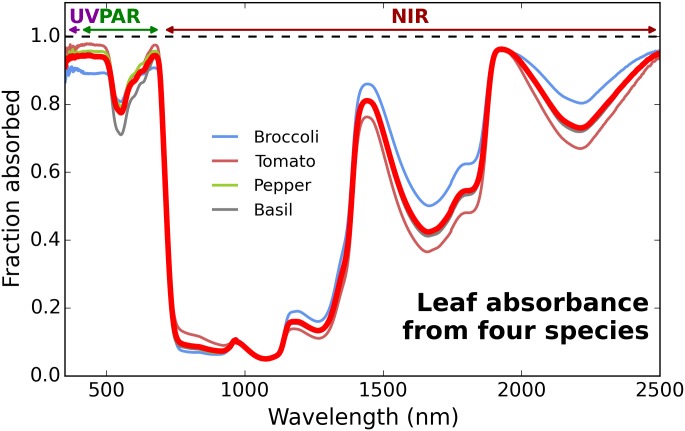
Leaf absorption was determined by measurement of reflection and transmission between 350–2500 nm using a spectroradiometer (FieldSpec Pro, ASD Inc., Boulder, CO, USA) and a halogen light source. Transmission was measured through a single leaf at 90° from the leaf surface. Reflectance was made over a large black cavity with a small hole to mimic a black body, again at 90° from the leaf surface. Absorption was averaged among four species: tomato (S. lycopersicum), pepper (C. annuum), basil (O. basilicum), and broccoli (B. oleracea) (Fig 1) to incorporate a range of leaf types. Three separate leaves were measured on for each species. Average absorption was nearly identical to previously published values from multiple species and a variety of environments [8, 9]. The presented average absorption confirmed those of Noda et al. [10], which included leaves from 22 species.
Fig 1. Average absorption (red line) of leaves from tomato, pepper, basil and broccoli.
Variation among species is due to differences in leaf reflectance. The broccoli leaf had slightly higher reflectance of PAR than the other species. All plants were grown in a greenhouse.
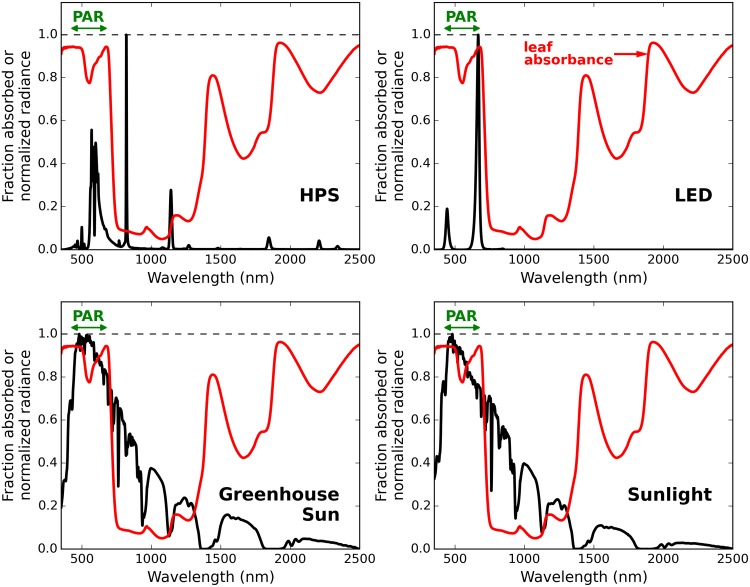
Relative spectral radiance of each radiation source was measured using the same spectroradiometer as above (Fig 2). Incoming shortwave (350–2,500 nm) and longwave (>3,000 nm) radiation measurements for each radiation scenario were made using a net radiometer (CNR1, Kipp & Zonen, the Netherlands). Photosynthetic photon flux (PPF; in moles per m2 per s) measurements were made using a recently calibrated quantum sensor (LI-190, LI-COR, Lincoln, NE, USA), and converted to photosynthetically active radiation (PAR; in watts per m 2) using spectral data for each light source and Planck’s equation (E = hc/λ). The absorbed radiation was normalized to equal incident PPF for each radiation source.
Fig 2. Radiance spectrum from four radiation sources (black line) and average leaf absorbance (red line).
Electric lights (HPS and LED) output most of their radiation in the photosynthetic regions. Sunlight has significant NIR radiation, but this is poorly absorbed by leaves.
Because UV and photosynthetic radiation have much higher absorption than NIR, shortwave radiation was divided into three bands: ultraviolet (UV, 350–400 nm), PAR (400–700 nm), and near-infrared (NIR, 700–2500 nm). UV radiation below 350 nm is a minimal component from all radiation sources, and was not included in the analysis.
Incoming and outgoing longwave radiation
Longwave radiation was separated into three components: sky longwave, source longwave, and emitted longwave. Sky longwave is the radiation emitted from either a clear sky (typically 300 W/m 2 or about -1°C), or the ceiling of the controlled environment (assumed to be 452 W/m 2 or about 28°C for all indoor cases). Source longwave is defined as the incoming longwave radiation from either the LED or HPS fixture, and was measured using a black body pyranometer (part of the net radiometer above). Incoming longwave radiation with the fixture present was subtracted from incoming longwave with the fixture absent. Source longwave was scaled with PPF. Emitted longwave is calculated using the Stefan-Boltzman law as outlined below. We assume the leaf is the same temperature as the surfaces below the leaf and thus there is no net longwave transfer.
Energy balance model
We modeled a single top leaf because the uppermost leaves absorb about 75% of the incident radiation and have the greatest temperature differences.
Leaf temperature was calculated using the energy balance model that has been described, in detail, in both Campbell and Norman [11] and Monteith and Unsworth [12],
| (1) |
where,
Assuming the system is at steady state, the absorbed radiation (R abs) must equal the sum of the emitted radiation (R emit), sensible (C) and latent (λE) heat transfer. Absorbed radiation was measured as described in the previous subsections. Emitted radiation is defined by the Stefan-Boltzmann law,
| (2) |
where,
The transfer of sensible heat (C), through convection, is defined as a function of the difference in leaf to air temperature and the boundary layer conductance such that,
| (3) |
where,
Boundary layer conductance (g Ha in mol/m2s) is a semi-empirical function defined as,
| (4) |
where,
Latent heat transfer (λE) is defined as a function of the vapor pressure deficit () and the vapor conductance (g v in mol/m2s) such that,
| (5) |
where,
Vapor conductance (g v) is a combination of both the vapor boundary (g va) and stomatal (g vs) conductances (both in c) such that,
| (6) |
Stomatal conductance (g vs) typically varies between 0.1 mol/m2s for drought stressed plants and 0.5 mol/m2s for high transpiring plants. Vapor boundary conductance is defined similarly to Eq (4) with slightly different constants,
| (7) |
These components account for all significant energy paths. Other energy sources and sinks include photosynthesis and respiration, which are negligible in these conditions. Combining Eqs (1), (2), (3), and (5) gives a comprehensive overview of the model,
| (8) |
The equation was solved for leaf temperature (T leaf) using an iterative approximation. Results are presented as the difference between leaf and air temperature (T leaf − T air), as leaf temperature is only relevant in the context of it’s environment.
Some of the energy absorbed by leaves is used to fix CO2 into sucrose in the process of photosynthesis. The photosynthetic energy use in field conditions is typically less than 4% of the total absorbed energy and has thus been ignored in energy balance models. However, assuming optimal water and nitrogen, a moderate PPF and physiologically optimum CO2 enrichment, it is possible to increase the quantum yield of photosynthesis to 0.08 moles of CO2 fixed per mole of photons absorbed. Assuming respiration is 30% of photosynthesis, net metabolism can use about 8% of the absorbed shortwave energy [6]. This is still a small contribution to the total energy balance, and it would be similar for all radiation sources.
Code for the execution of the model can be found in supplemental information (S1 File).
Sensitivity analysis
Excluding the radiation inputs, Eq (8) is ultimately a function of seven environmental variables: air temperature, relative humidity/vapor pressure deficit, wind speed, leaf size, sky temperature, stomatal conductance, and atmospheric pressure. Default values for each parameter were chosen to reflect typical growing conditions (as shown in figure captions).
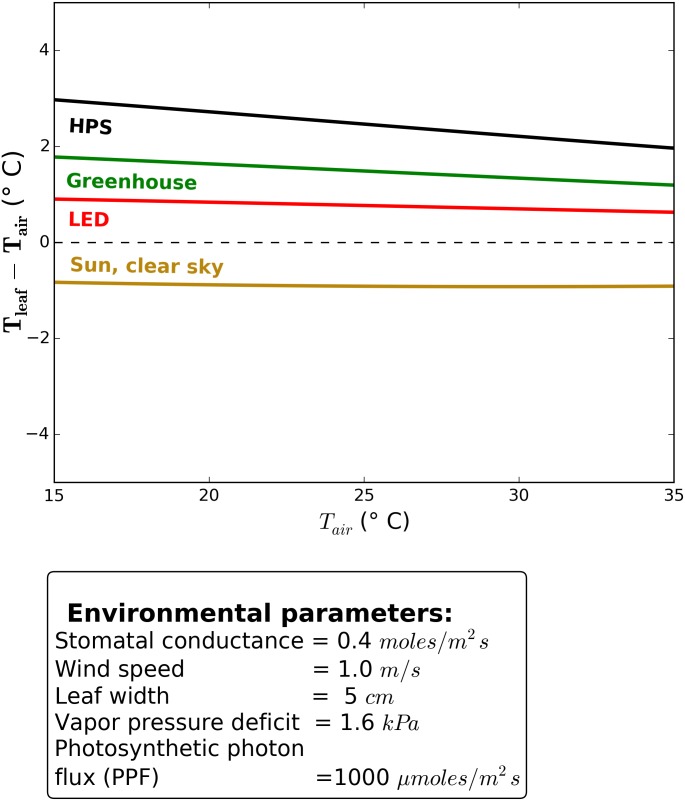
Air temperature was held at 25°C, which is a common set point for greenhouses and growth chambers. Convective heat transfer from the lighting fixture and surrounding air is assumed to be controlled via the temperature control system before it would impact leaf temperature. When other environmental conditions are constant in the model, air temperature between 15° and 35°C has a minimal effect on leaf to air difference (Fig 3).
Fig 3. Leaf temperature response to air temperature.
Vapor pressure deficit was held constant. Calculation is based on the average absoprtion of the four species measured. Differences among species were biologically insignificant.
Environmental parameters were varied across a biologically significant range.
Results and Discussion
The greatest variation among sources in incident radiation was in the near-infrared (NIR) and longwave bands (Table 1). NIR is poorly absorbed by leaves, so absorbed NIR was less than 30% of absorbed PAR energy for all sources.
Table 1. Incident radiation, fraction absorbed, and total absorbed radiation for each source.
The absorbed radiation was normalized to a PPF of 1000 µmoles per m2 per s for each radiation source. This does not result in exactly equal PAR (in watts per m2) because of spectral differences among radiation sources. The total absorbed radiation for each source is shown in bold. Leaf temperature was held constant at 25°C. Net longwave exchange with lower leaves or surfaces was assumed to be zero.
| UV (350–400 nm) | PAR (400–700 nm) | NIR (700–2500 nm) | Source longwave | Sky longwave | Emitted longwave | Total | |
|---|---|---|---|---|---|---|---|
| Incident radiation (W/m 2) | |||||||
| HPS | 0.58 | 203 | 128 | 131 | 452 | -448 | 467 |
| LED | 0.15 | 195 | 10 | 44 | 452 | -448 | 253 |
| Sun, greenhouse | 18 | 219 | 252 | 0 | 452 | -448 | 494 |
| Sun, clear sky | 19 | 219 | 289 | 0 | 300 | -448 | 379 |
| Fraction absorbed | |||||||
| HPS | 0.939 | 0.870 | 0.263 | 0.97 | 0.97 | 0.97 | 0.71 |
| LED | 0.934 | 0.943 | 0.923 | 0.97 | 0.97 | 0.97 | 0.90 |
| Sun, greenhouse | 0.938 | 0.894 | 0.214 | 0.97 | 0.97 | 0.97 | 0.53 |
| Sun, clear sky | 0.937 | 0.894 | 0.207 | 0.97 | 0.97 | 0.97 | 0.33 |
| Total absorbed radiation (W/m 2) | |||||||
| HPS | 0.54 | 177 | 34 | 127 | 439 | -435 | 342 |
| LED | 0.14 | 184 | 9 | 43 | 439 | -435 | 240 |
| Sun, greenhouse | 17 | 196 | 54 | 0 | 439 | -435 | 271 |
| Sun, clear sky | 18 | 196 | 60 | 0 | 291 | -435 | 130 |
The indoor environments (LED, HPS, and greenhouse) had net positive longwave radiation, and the HPS fixture was significantly higher than the other sources. The effect of UV on absorbed radiation was less than 10% of absorbed PAR energy for all source.
Effect of environment on leaf to air temperature difference
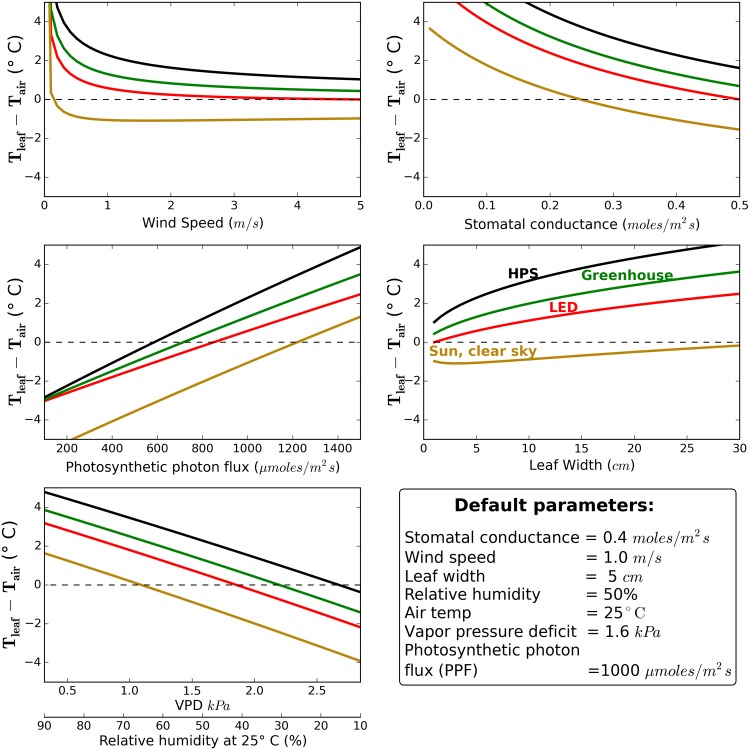
The leaf-to-air temperature difference, in all radiation scenarios, was less than 2°C except where parameters approached their extremes (Fig 4). The relative order did not change, regardless of environmental conditions, with HPS > greenhouse sun > LED > clear sky sunlight.
Fig 4. Calculated effects of environmental conditions on the difference between leaf temperature and air temperature under four radiation scenarios.
Our modeled near worst-case conditions (water stress, high PPF, and low wind; Fig 5) increased the differences between lighting sources. The results indicate that leaf temperatures in near worst-case conditions can increase 6° to 12°C above air temperature depending on the radiation scenario.
Fig 5. Calculated effects of PPF on the difference between leaf temperature and air temperature under four radiation scenarios in near worst-case conditions of water stress and low wind.
Calculation is based on the average absoprtion of the four species measured. Differences among species was biologically insignificant.
Differences in radiation absorption
There were significant differences among sources in the ratio of NIR to PPF, but NIR wavelengths are poorly absorbed by leaves (Table 1), thus the effect of NIR on leaf temperature is relatively small. Blanchard and Runkle [13] found leaf temperature to be 0.7° to 1.5°C lower under NIR reflective painted glass as opposed to neutral reflective painted glass with similar PPF conditions (about 1100 μmole/m2s), though much of this difference was likely due to differences in air temperature, which was on average 0.8°C higher under neutral reflective paint. This further shows that though NIR is a significant source of energy, it’s impact on individual leaves is small.
Longwave radiation varied significantly among radiation sources and had the biggest effect on leaf temperature. Because incoming longwave radiation from clear sky conditions is significantly less than that from the ceiling of controlled environments, plants grown outdoors have lower absorbed net radiation. Even on overcast days, incoming long wave radiation in the field is typically lower than in a controlled environment.
Our analysis includes two of the most efficient fixtures available. Increases or decreases in efficiency will likely cause small differences in source longwave radiation, but the effect of changes in fixture efficiency would be relatively small compared to the effect of differences between the two technologies.
Extrapolating from biophysical models to predict field performance
Simple measurements coupled with biophysical models are often used in large scale physiology experiments with confidence, such as using eddy covariance and satellite remote sensing to measure ecosystem latent heat flux and net ecosystem exchange. Building from well studied basic principles, simple measurements such as air temperature, leaf absorbance, and incoming and outgoing radiation, we can infer more complex relationships, such as transpiration and leaf temperature. Here we report the modeled relationships between environmental conditions, stomatal conductance, and leaf temperature.
Effect of light source on transpiration
Increased leaf temperature causes increased transpiration. When incoming radiation and radiation capture by the crop are the same, the transpiration rate of crops in protected environments are thus higher than the same crops the field.
In the field, however, water loss by evaporation from the soil surface can make the combination of evaporation and transpiration higher than the combination of evaporation and transpiration in a controlled environment. If the effect of surface evaporation is removed and transpiration from only the leaves is considered, crops in a greenhouse would have a 35% higher transpiration rate than identical crops grown in the field, based on our model parameters.
Based on our presented model and the default parameters (Fig 4), the reduced leaf temperature under LED fixtures would decrease transpiration by 17% compared to HPS fixtures. This is a potentially significant reduction in transpiration, but differences in surface evaporation among cultural systems typically have a greater effect on crop water requirement than lamp type. For example, drip irrigation can decrease evaporation from surfaces and reduce the crop water requirement by 30 to 70%, in both greenhouses and in the field [14].
Effect of elevated CO2
Controlled environments often add supplemental CO2, which can decrease stomatal conductance 10–40% [15, 16], and increase leaf temperature. The presented model indicates that a decrease in stomatal conductance of 30% in response to elevated CO2 would increase leaf temperature by 1°C in all radiation scenarios.
Effect of light source on shoot tip temperature
Shoot tip temperature is often used to predict time to flower and plant development rates [17]. Our modeling approach is similar to that used by Shimizu et al. [5] and Faust and Heins [18] to predict shoot tip temperature, both of which found greater than 83% of their modeled values to be within 1°C of measured values. Because our models are similar, choice of lighting technology will likely affect shoot tip temperature, time to flower and plant development.
Effect of light source on fruit and flower temperature
Our near-worst case analysis would likely be representative of flowers, fruits, and thick, dense plant parts that have low transpiration rates, including high value products such as tomatoes, strawberries, and Cannabis flowers. These thicker structures would absorb more radiation than a thin leaf. Our measurements show that while only 63% of HPS shortwave radiation is absorbed by the first leaf, a structure ten times thinker would absorb more than 80%. LED technology has the potential to reduce heating of these thick, low transpiring plant structures.
Conclusions
The presented model indicates that the use of LED technology reduces leaf temperature by about 1.3°C compared to HPS technology under typical, indoor growing conditions. While this is a significant difference for some applications, the difference is smaller than the difference between indoor and outdoor leaves. Because of differences in net longwave radiation, a leaf in a controlled environment will be warmer than a leaf in the field under a clear sky, assuming equal PPF and similar environmental conditions. In conditions where leaves benefit from heating, such as a greenhouse in a cool climate, HPS technology more effectively transfers heat to canopies.
Supporting Information
PAR was 89% transmitted.
(TIF)
(PDF)
Acknowledgments
We thank Peter Nelson, Saundra Rhoades, and Alec Hay for their dedicated technical work.
Data Availability
All relevant data are within the paper and its Supporting Information files.
Funding Statement
The authors have no support or funding to report.
References
- 1. Nelson JA, Bugbee B. Economic analysis of greenhouse lighting: light emitting diodes vs. high intensity discharge fixtures. PLoS ONE. 2014. June;9(6):e99010 Available from: http://dx.plos.org/10.1371/journal.pone.0099010 10.1371/journal.pone.0099010 [DOI] [PMC free article] [PubMed] [Google Scholar]
- 2. Baille M, Baille A, Delmon D. Microclimate and transpiration of greenhouse rose crops. Agricultural and Forest Meteorology. 1994. October;71(1–2):83–97. Available from: http://www.sciencedirect.com/science/article/pii/0168192394901015 10.1016/0168-1923(94)90101-5 [DOI] [Google Scholar]
- 3. Kichah A, Bournet PE, Migeon C, Boulard T. Measurement and CFD simulation of microclimate characteristics and transpiration of an Impatiens pot plant crop in a greenhouse. Biosystems Engineering. 2012. May;112(1):22–34. Available from: http://linkinghub.elsevier.com/retrieve/pii/S1537511012000207 10.1016/j.biosystemseng.2012.01.012 [DOI] [Google Scholar]
- 4. Seginer I. On the night transpiration of greenhouse roses under glass or plastic cover. Agricultural Meteorology. 1984. January;30(4):257–268. Available from: http://www.sciencedirect.com/science/article/pii/0002157184900025 10.1016/0002-1571(84)90002-5 [DOI] [Google Scholar]
- 5. Shimizu H, Runkle ES, Heins RD. A steady-state model for prediction of poinsettia plant shoot-tip temperature. Journal of the American Society for Horticultural Science. 2004;129(3):303–312. [Google Scholar]
- 6. Blonquist JM, Norman JM, Bugbee B. Automated measurement of canopy stomatal conductance based on infrared temperature. Agricultural and Forest Meteorology. 2009. December;149(12):2183–2197. Available from: http://linkinghub.elsevier.com/retrieve/pii/S0168192309002329 10.1016/j.agrformet.2009.10.003 [DOI] [Google Scholar]
- 7. Widmoser P. A discussion on and alternative to the Penman–Monteith equation. Agricultural Water Management. 2009. April;96(4):711–721. Available from: http://linkinghub.elsevier.com/retrieve/pii/S0378377408002643 10.1016/j.agwat.2008.10.003 [DOI] [Google Scholar]
- 8. Jones HG. Plants and microclimate: a quantitative approach to environmental plant physiology. Cambridge University Press; 2013. [Google Scholar]
- 9. McCree KJ. The action spectrum, absorptance and quantum yield of photosynthesis in crop plants. Agricultural Meteorology. 1972;9(0):191–216. Available from: http://www.sciencedirect.com/science/article/pii/0002157171900227 [Google Scholar]
- 10. Noda HM, Motohka T, Murakami K, Muraoka H, Nasahara KN. Reflectance and transmittance spectra of leaves and shoots of 22 vascular plant species and reflectance spectra of trunks and branches of 12 tree species in Japan. Ecological research. 2014;29(2):111–111. 10.1007/s11284-013-1096-z [DOI] [Google Scholar]
- 11. Campbell GS, Norman JM. An introduction to environmental biophysics. Springer; 1998. [Google Scholar]
- 12. Monteith JL, Unsworth MH. Principles of environmental physics. 2nd ed Edward Arnald; 1990. [Google Scholar]
- 13. Blanchard MG, Runkle ES. Influence of NIR-reflecting shading paint on greenhouse environment, plant temperature, and growth and flowering of bedding plants. Transactions of the ASABE. 2010;53(3):939–944. 10.13031/2013.30076 [DOI] [Google Scholar]
- 14. Camp CR. Subsurface drip irrigation: a review. Transactions of the ASAE. 1998;41(5):1353–1367. 10.13031/2013.17309 [DOI] [Google Scholar]
- 15. Ainsworth EA, Rogers A. The response of photosynthesis and stomatal conductance to rising CO2: mechanisms and environmental interactions: Photosynthesis and stomatal conductance responses to rising CO2 . Plant, Cell & Environment. 2007. March;30(3):258–270. Available from: http://doi.wiley.com/10.1111/j.1365-3040.2007.01641.x 10.1111/j.1365-3040.2007.01641.x [DOI] [PubMed] [Google Scholar]
- 16. Wheeler RM, Mackowiak CL, Yorio NC, Sager JC. Effects of CO2 on stomatal conductance: do stomata open at very high CO2 concentrations? Annals of botany. 1999;83(3):243–251. Available from: http://aob.oxfordjournals.org/content/83/3/243.short 10.1006/anbo.1998.0813 [DOI] [PubMed] [Google Scholar]
- 17. Faust JE, Heins RD. Modeling leaf development of the African violet (Saintpaulia ionantha Wendl.). Journal of the American Society for Horticultural Science. 1993;118(6):747–751. Available from: http://journal.ashspublications.org/content/118/6/747.short [Google Scholar]
- 18. Faust JE, Heins RD. Modeling shoot-tip temperature in the greenhouse environment. Journal of the American Society for Horticultural Science. 1998;123(2):208–214. [Google Scholar]
Associated Data
This section collects any data citations, data availability statements, or supplementary materials included in this article.
Supplementary Materials
PAR was 89% transmitted.
(TIF)
(PDF)
Data Availability Statement
All relevant data are within the paper and its Supporting Information files.


