

Abstract
Background
Interactions between genetic risk factors and the environment drive Type 1 diabetes. The system of Toll-like receptors (TLR) detects these environmental triggers; however, the target cell that intermediates these interactions to drive T1D remains unknown.
Methods
We investigated the effect of TLR pathway activation (MyD88 vs TRIF) on B cell subsets via flow cytometry including their activation, survival, proliferation and cytoskeletal mobilization. The effect of polyIC on diabetes development was addressed including the B cell dependent activation of diabetes-protective DX5+ cells using genetic models and adoptive transfer.
Results
NOD B lymphocytes expressed enhanced levels of TLR responsive proteins. Ex vivo analysis of B lymphocyte subsets demonstrated that TLR3 stimulation via TRIF deletes cells displaying a marginal zone phenotype, whereas MyD88 dependent ligands enhance their survival. In vivo, marginal zone B cells were activated by polyIC and were unexpectedly retained in the spleen of NOD mice in contrast to the mobilization of these cells in non-autoimmune mice, a phenotype we traced to defective actin cytoskeletal dynamics. These activated B cells mediated TLR3-induced diabetes protection.
Conclusions
Immunotherapies must account for both B cell location and activation and these properties may differ in autoimmune and healthy settings.
The significant finding of the study is that B lymphocytes respond to TLR ligation in a subset specific manner and are required for TLR-triggered diabetes protection.
This study adds new information about the role of TLR ligation in diabetes pathogenesis and further identifies a unique role for B lymphocyte specific trafficking abnormalities in T1D.
Keywords: B lymphocyte, TLR, Type 1 diabetes, Innate Immunity, Autoimmunity
Introduction
The development of autoimmunity relies on the interaction of multiple cell types to break tolerance and cause tissue destruction. In many autoimmune disorders, including Type 1 diabetes, the production of autoantibodies is the first detectable sign that tolerance has failed and may precede the diagnosis of overt disease by years or decades.1, 2 Studies in mouse models of diabetes and in patients with T1D have indicated the efficacy of B lymphocyte depleting therapy in attenuating disease.3, 4 Although complete B cell depletion remains undesirable due to the risk for side effects, more targeted strategies to selectively deplete autoreactive B cells or induce B cell mediated regulation remain highly attractive for clinical application.5
While the role of B lymphocytes in promoting autoreactive T cell activation is well known6-11, it remains unclear how a soluble antigen such as insulin, which normally would induce a weak response, is able to promote robust immunity, class switching, and tissue destruction. It is clear in the murine model of T1D that insulin is the primary antigen upon which disease relies and insulin-reactive B cells are efficient drivers of rapid disease onset.12, 13 It is likely that the induction of a robust anti-insulin response relies on provision of some form of adjuvant. Such stimulatory interactions could include viral infection or endogenous activators of innate immunity. There is also substantial evidence that the microbiome plays a critical role in establishing disease susceptibility and promoting autoimmunity through innate signaling pathways.14
These B cell-activating interactions likely proceed through stimulation of the Toll-like receptor system. This system is required for diabetes development, as evidenced by NOD mice that are deficient in the primary adaptor of TLR signaling MyD88.14 These mice appear to be protected from diabetes through modulation of the microbiome, but how this modulation directly effects immune cell activation is not established. Stimulation with TLR ligands has also been investigated in the progression of T1D, but there have been reports of both diabetes acceleration and prevention.15-19 The precise cell types acted upon by these ligands to mediate diabetes-modulating effects are unknown.
We hypothesized that these innate activating ligands interact with B lymphocytes in a subset specific manner. B lymphocytes emigrate from the bone marrow to the spleen where they complete their development and emerge into two primary B cell subsets—follicular and marginal zone B cells. Follicular B cells are thought to be the primary interactors with T lymphocytes and the most important contributors to the class-switched antibody response. Nonetheless, marginal zone B cells are also capable of engaging in the T-dependent immune response and in fact have strong antigen presenting capacity. These B cells expand during the progression to diabetes but whether these cells directly promote autoimmune diabetes is unknown.20, 21
To address the role of B lymphocytes as coordinators of innate and adaptive immunity, we undertook a detailed investigation of the B lymphocyte response to TLR engagement. As compared to non-autoimmune B6 mice, we find that B lymphocytes in NOD mice express increased levels of TLR response proteins but are not hyper-sensitive to TLR engagement. Instead, we find that marginal zone B cells are highly sensitive to depletion following MyD88-independent/TRIF signaling by TLR3 ex vivo. In vivo, NOD, but not B6 B cells, resist mobilization by TLR3 ligation and fail to egress from the spleen. We relate this newly identified migrational defect to significant alterations in cytoskeletal dynamics. These activated B cells then confer diabetes protection through stimulation of innate immunity.
Methods
Mice
NOD/LtJ, NOD/Scid and C57Bl/6 mice were purchased from the Jackson Laboratories (Bar Harbor, ME) at 6-8 weeks of age. NOD.μMT (B cell deficient mice) were maintained in our colony by serial matings. All mice were housed and maintained according to the guidelines for use and care of laboratory animals as set forth by Vanderbilt University. All NOD mice were monitored for the development of diabetes by blood glucose measurement with Accu-chek test strips (Roche Diagnostics, Indianapolis, IN). Two consecutive glucose measurements >220mg/dL constituted a diagnosis of diabetes. Animals in our colony have a spontaneous diabetes incidence of 80-90% in females by 30 weeks of age.22
Isolation and stimulation of splenocytes
Splenocytes were prepared by dispersion of the organ and passage through a 70-μm cell strainer followed by red cell lysis. Cells were plated in 96-well plates at a density of 1 × 10⁶ total cells/ml in DMEM containing 10% HI-FCS, penicillin (100 U/ml), streptomycin (100 μg/ml), captoethanol (55μM), and varying amounts of the identified stimulus. Stimuli included LPS, Imiquimod, and PolyIC, according to manufacturer's instructions. (Invivogen, San Diego, CA). All cells were incubated for the indicated times at 37°C in 5% CO2.
Flow Cytometry
Cells were suspended in PBS containing 0.1% azide and 3% FCS and surface stained with the following mAbs: RA3-6B2 (anti-CD45R/B220), 7G6 (anti-CD21/35), B3B4 (anti-CD23), HM40-3 (anti-CD40), H1.2F3 (anti-CD69), 16-10A1 (anti-CD80), no. 72-1 (anti-CD36), KMC8 (anti-CD9), RP/14 (anti-CD180), MD14 (anti-MD-1), MTS510 (anti-CD284), MIH5 (anti-CD274), R35-95 (Rat IgG2a,κ IC), and B39-4 (Rat IgG2a,λ IC). All samples were analyzed on a FACSCalibur or Fortessa flow cytometer (Becton Dickinson, Mountain View, CA) and analyzed using FloJo software (Treestar, Ashland, OR). Positive staining was defined in relation to the isotype control.
CFSE Labeling
Spleens were harvested, and cells were labeled and prepared as previously described.7, 9
Diabetes Protection by PolyIC
9-10 week old female NOD mice were injected with 100ug PolyIC (Invivogen, San Diego, CA) once daily for 9 days.
Analysis of Actin Depolymerization
Splenocytes were isolated and plated in 100μl of culture media. Kinase inhibitors Dasatinib, Src-Inhibitor 1, or 1uM Latrunculin were added for 1 hour before stimulation (Sigma) where indicated. Splenocytes were stimulated with 100μl 10mM peroxide or left unstimulated for the times indicated. Cells were fixed with 4% Paraformaldehyde for 20 mins. They were stained with Rhodamine Phalloidin and B cell markers (B220, CD21, CD23) in PBS containing 0.1% Triton X-100, 0.1% azide and 3% FCS and analyzed by flow cytometry.
Adoptive Transfer and Diabetes Protection
Female NOD/scid mice were given 20×10ˆ6 cells from the spleen of a diabetic female donor. All donors had diabetes for at least one week. For diabetes protection, DX5+ cells were obtained from polyIC treated NOD or NOD.μMT mice after a 9 day course of polyIC delivered intraperitoneally at 100ug/day. Cells were obtained via MACS (Miltenyi, Auburn, CA), using two columns for enrichment and reaching final cell purity >95%.
Results
Increased expression of TLR sensing molecules in NOD B lymphocytes
To define the interaction of NOD B lymphocytes with TLR ligands, we initially assessed their expression of several TLR-interacting proteins. As shown in Figure 1, we found an increase in cells expressing high levels of LPS-interacting proteins including the positive regulators CD180, and MD-1, as well as the negative regulator CD9. All NOD B cells were defined by increased expression of CD284/TLR4. With regard to other TLR interactions, we also identified increased expression of CD274/PD-L1/B7-H1, which has been associated with the response to TLR3.23 Finally, we found that all NOD B lymphocytes demonstrated a dramatic increase in CD36, which has been linked to multiple TLR signaling pathways.24
Figure 1. Upregulation of TLR interacting receptors in NOD B lymphocytes.

Splenocytes were isolated from pre-diabetic 9-11 week old female NOD mice and matched B6 controls. Cells were immediately stained with B220, CD21, CD23, and the indicated surface marker in the diagram. Overlays of B220+ splenocytes are shown with NOD B cells indicated in blue and B6 in red. NOD mice show an increase in a high expressing population for CD9 (tetraspanin family), CD180 (TLR4/LPS co-receptor, pairs with MD-1), MD-1 (TLR4/LPS co-receptor, paris with CD180), and CD274 (PD-L1). The entire NOD B lymphocyte population shows increased surface expression of CD284 (TLR4) and CD36 (thrombospondin receptor/fatty acid translocase) as indicated by a right shift in the NOD histogram. No differences were seen in the isotype control stains, all of which were clearly negative. The same results were obtained by staining and gating on CD19+ or IgM+ cells. Comparison of staining between CD180, MD-1, CD274, and CD9 was performed based on determination of percent positive cells; differences were significantly different between all groups (p<0.0001, ANOVA followed by post test, n>3 for all). For CD36 and TLR4, comparison was made based on the population MFI and was also statistically significant (p<0.0001 for CD36 and p<0.05 for TLR4, t-test, n>3 for both). The figure is representative of at least two independent experiments in all cases.
NOD B lymphocytes are not hyper-responsive despite increased baseline activation
Having determined that NOD B lymphocytes express increased levels of several proteins involved in TLR activation, we anticipated that these cells would be hyper-responsive to TLR engagement. For the purpose of defining TLR responsiveness, we focused on three stimulating molecules and their associated TLRs. These included LPS (TLR4). polyIC (TLR3), and imiquimod (TLR7). This approach allowed us to dissect TLR signaling on the basis of adaptor protein usage as LPS utilizes 4 of the 5 TLR adaptor proteins (Mal, MyD88, TRAM, and TRIF) while TLR3 relies on TRIF and TLR7 relies exclusively on MyD88. We have also analyzed TLR9 (MyD88) and TLR2 (Mal/MyD88) where results are similar to the results shown throughout for MyD88-dependent pathways (data not shown). Whole splenocytes from B6 or pre-diabetic NOD mice were cultured overnight in the presence of LPS, polyIC or imiquimod. A whole splenocyte system was selected to best model the in vivo environment where multiple cellular interactions would govern the overall response. After 18hrs of culture, cells were harvested and analyzed by flow cytometry. B lymphocytes were identified by B220 and CD19. Cell activation was measured by cell surface expression of CD69, CD80 (B7.1), and CD40 across a range of stimulator concentrations. The results are shown in Figure 2. Overall, these data do not support an increased responsiveness of NOD B lymphocytes to TLR stimulation in terms of either minimal ligand sensitivity or maximal response but rather indicate that the major difference in B cell activation is measurable at baseline prior to exogenous TLR stimuli.
Figure 2. The dynamic response of B lymphocytes to TLR engagement.
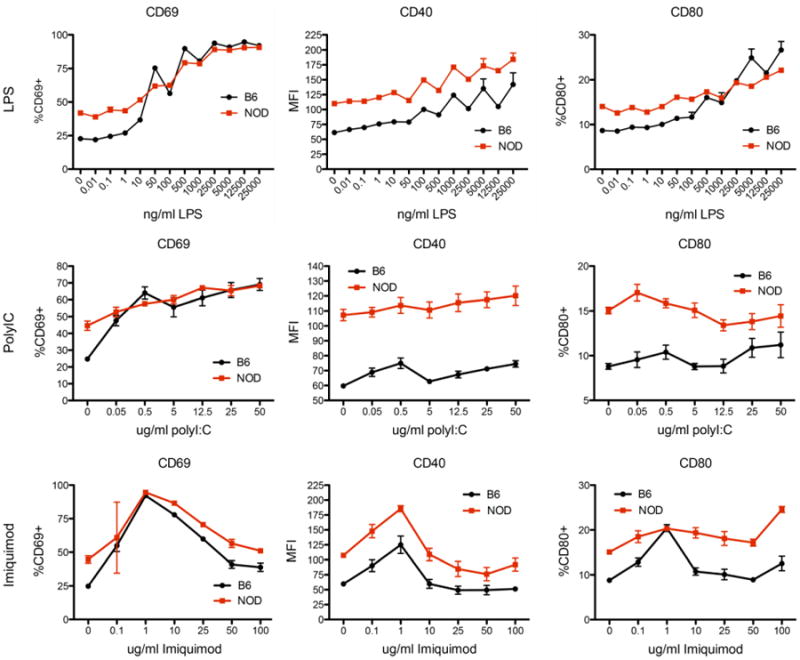
Splenocytes were isolated from pre-diabetic female NOD mice and matched B6 controls. Cells were cultured overnight in the presence of TLR agonists including LPS (TLR4), polyIC (TLR3) and imiquimod (TLR7). After overnight culture, cells were harvested, stained with B220, CD40, CD69, and CD80. Data is demonstrated as percent positive cells for CD69 and CD80. For CD40, the population MFI is shown as all B cells were positive. Measurement of all markers shows greater staining in NOD B lymphocytes at baseline as compared to B6. Following stimulation, B6 B lymphocytes largely achieve the same maximal activation as measured for NOD. In the case of CD40 surface expression, the baseline difference appears maintained throughout a range of stimulation conditions, which follow identical dynamics between the strains. For other comparisons, the baseline difference is the largest difference observed. For all comparisons shown, the responses of the two strains are statistically different as assessed by ANOVA (p<0.01 for all); this difference is largely attributable to the baseline difference, which is lost at higher levels of stimulation particularly for CD69. Data are obtained from 3 separate experiments; n=6 for all doses demonstrated.
Differential regulation of Marginal Zone B cells by specific TLR pathways ex vivo
Although NOD B lymphocytes did not exhibit enhanced sensitivity to TLR ligation, we considered that NOD B cell subsets could show differential sensitivity to TLR ligation. In particular, several of the identified markers shown in Figure 1, such as CD9, are associated with the marginal zone (MZ) B cell phenotype25; this cell subset is expanded in NOD mice and has been associated with diabetes progression.21, 26 Further analysis of our data in Figure 2 did not reveal any differences in activation within the B cell subsets as compared to B6 (not shown). However, we hypothesized that TLR ligation may promote B cell survival or expansion in a subset dependent manner and account for the increase over time in marginal zone B cells in NOD mice. To assess this possibility ex vivo, whole splenocytes were cultured overnight in the presence of varying concentrations of LPS, polyIC, and imiquimod. As shown in Figure 3, incubation with LPS or imiquimod (both utilizing MyD88) induced a relative increase in MZ B cells as compared to no stimulus. This beneficial effect may be more marked in NOD due to the decreased maintenance of MZ B cells in the absence of stimulus. On the contrary, incubation with polyIC induced a relative loss of this cell population in both strains. These trends were similar in NOD and B6 B lymphocytes and were dose responsive as shown. Follicular B cells presented an opposite trend at baseline where this phenotype was better maintained in NOD mice. Stimulation with polyIC or LPS improved maintenance of follicular zone cells in B6 mice but did not affect NOD follicular B cells. Increasing doses of MyD88-dependent imiquimod significantly decreased the proportion of follicular B cells in NOD mice, opposite to the effect on the marginal zone. Because unstimulated B lymphocytes tend to lose surface markers, we did not measure changes in the “transitional” B cell compartment but rather focused on the maintenance of well defined B cell markers in our culture. Our data indicate that TLR signaling may directly regulate the marginal zone by activating specific TLR pathways.
Figure 3. The differential response of marginal zone B cells to MyD88 dependent and independent TLR pathways.

Splenocytes were isolated from 9-11 week old, pre-diabetic female NOD mice and age-matched B6 controls. The baseline percentage of marginal zone and follicular B cells were obtained by staining with B220, CD19, CD21, and CD23. Cells were cultured overnight in the presence of the indicated concentration of LPS, imiquimod, or polyIC. After culture, cells were again stained and the percentage of follicular and marginal zone B cells calculated. The graphs display the ratio of the percent cell type identified at the end of culture to that present at the beginning. A ratio of 1 indicates no change in the relative cell proportion in the culture. Examining the unstimulated condition, marginal zone B cells stability is similar between strains in overnight culture whereas NOD follicular zone B cells are relatively better retained. Stimulation with LPS, which depends on all major TLR adaptors, shows increased retention of the marginal zone phenotype in NOD mice in a dose responsive pattern. B6 mice show a modest effect in the marginal zone and show significantly improved maintenance of follicular B cells. The pattern is similar with imiquimod, which depends only on MyD88, as NOD marginal zone B cells are more persistent in culture following increased stimulation; conversely follicular zone B cells are decreased by increasing imiquimod concentration. PolyIC, which depends upon TRIF, shows an opposite effect in the marginal zone, where both NOD and B6 cells are diminished by treatment. PolyIC shows little effect on the follicular zone. Data are from 3 separate experiments. (n=9 per strain; p<*0.05,**0.01,***0.001,****0.0001, ANOVA followed by Bonferroni post-test). Statistics are shown comparing NOD to B6 at baseline; other comparisons are for the stimulated condition for the given strain to its own baseline.
In Vivo Treatment with PolyIC prevents diabetes but unexpectedly fails to deplete Marginal Zone B cells
Because marginal zone B cells may drive diabetes progression, we hypothesized that TLR3 activation by polyIC would prevent diabetes by selectively fostering their elimination. 9 week old female NOD mice were injected with 100ug of polyIC daily for 9 days and followed for the development of diabetes. This treatment significantly protected against diabetes (Figure 4A). Unexpectedly, analysis of the spleens of an additional group of mice at the end of the 9 days of treatment revealed that the marginal zone remained intact (Figure 4B) in NOD mice whereas B6 mice demonstrated complete loss of this compartment when identified by CD21 and CD23; the same results were also obtained with CD1d/IgD staining.
Figure 4. PolyIC injection prevents Type 1 diabetes but does not deplete the marginal zone in vivo.

(A). 9-10 week old female NOD mice were given daily injections of 100ug polyIC for 9 days. Mice were followed for the development of diabetes. PolyIC treated mice demonstrated significant diabetes protection (**p<0.0001, log-rank). N=10 in each group. (B) After a 9 day course of 100ug polyIC injections, spleens were obtained from NOD and B6 mice and analyzed for marginal zone B cells by staining with B220, CD19, CD21, and CD23. B6 B cells showed an expected decrease in the presence of marginal zone B cells as compared to baseline (*p<0.05 ANOVA, followed by Bonferroni post-test). Unexpectedly, no change was identified in the marginal zone compartment in NOD B cells. Similar results were obtained when staining with CD1d and IgD was used instead. Panel B is representative of 5 different experiments and combined results are shown in the histogram.
NOD B lymphocytes resist actin mobilization following activation
Given this unexpected result in NOD B lymphocytes, we sought a mechanism to explain the observed difference. MyD88-dependent TLRs activate marginal zone B cell mobilization by modulating the S1P family of sphingosine receptors.27 However, this mechanism is not used by polyIC that instead relies on upregulation of CD69.28 Analysis of in vivo stimulated B lymphocytes demonstrated the same degree of CD69 upregulation between responding NOD and B6 B lymphocytes, indicating that differences in activation were not a likely mechanism (not shown). Downstream of these events, the actin network is mobilized to lead to the observed dynamic response of marginal zone B cells to stimulation. Therefore, we hypothesized that there may be dysregulation in the actin network in NOD B cells. To assess actin dynamics in B lymphocytes, we utilized hydrogen peroxide as a well-described, potent stimulus of actin re-organization29. We elected to measure actin dynamics by flow cytometry so that the dynamics of the marginal zone could be directly assessed by co-staining for marginal zone B cell markers. The cytoskeletal response was measured by staining with rhodamine phalloidin, which selectively binds to the F-actin network but cannot bind to unassembled G-actin. Activation by peroxide for 10 minutes revealed a robust decrease (>20 fold, Figure 5A) in F-actin in B6 mice.
Figure 5. Attenuated actin cytoskeletal dynamics in NOD B lymphocytes.
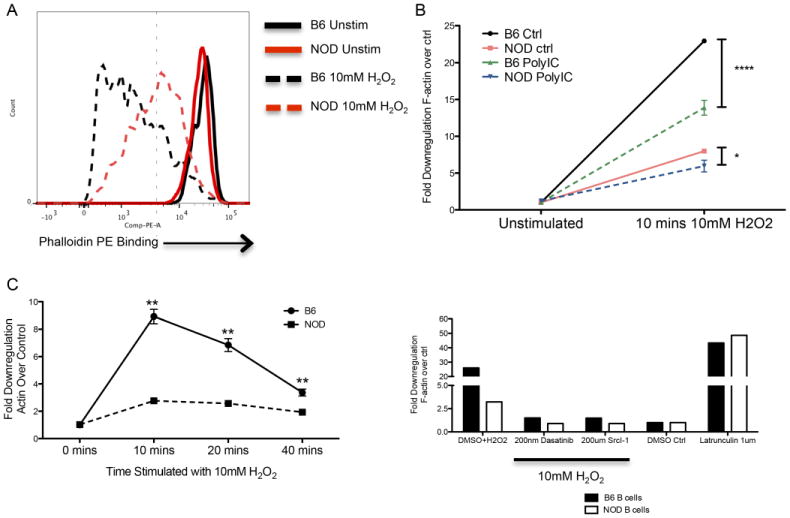
(A) Splenocytes from pre-diabetic NOD and matched B6 mice were stimulated for 10 minutes with 10mM hydrogen peroxide (H2O2). F-actin de-polymerization was measured by flow cytometry in B220 positive cells by co-staining with rhodamine-phalloidin. A representative diagram of the actin response is shown. At baseline, phalloidin staining is consistent between strains. Following stimulation, B6 lymphocytes show a significantly more dynamic response of the actin network as indicated by a greater left shift. (B) The response of the actin cytoskeleton is presented as a fold decrease in phalloidin staining compared to baseline. The effect of polyIC was assessed by injection of the mice with 100ug of polyIC 6h prior to the activation assay. Marginal zone B cells (identified by CD21/23) in B6 mice show an over 25-fold reduction in staining compared to a maximal 8-fold reduction in NOD mice. Exposure to polyIC decreases this response in both strains. However, the B6 response remains significantly greater than NOD and the NOD response is reduced to nearly baseline levels (p<*0.05 or ****0.0001, ANOVA followed by Bonferroni post-test). (C). The kinetics of the response were also assessed. Stimulation with hydrogen peroxide results in maximal response at 10 minutes which returns to near baseline in B6 mice by 40 minutes. NOD B lymphocytes show similar kinetics with severely reduced amplitude (**p<0.005, ANOVA followed by post-test). (D). The measured actin response is regulated by normal signaling pathways. Addition of the broad kinase inhibitor dasatanib or by the more selective SRC family inhibitor Src-Inhibitor I prevents the depolymerizing response induced by H2O2 to nearly baseline levels as compared to control. Addition of the actin depolymerizing toxin latrunculin shows the capacity for NOD B lymphocytes to demonstrate complete de-polymerization. Data shown are representative of at least three independent experiments.
This change in rhodamine phalloidin binding suggested dynamic reorganization of the actin cytoskeleton in the non-autoimmune strain. NOD mice showed virtually no response to this stimulus as indicated. Previous exposure to polyIC by intraperitoneal injection before peroxide activation resulted in a decrease in actin mobilization in both strains. However, there was still a 10-fold decrease in rhodamine staining in B6 B lymphocytes whereas changes in the NOD actin network were almost completely abrogated by this intervention (Figure 5B). To further validate this measure of cytoskeletal dynamics, we performed a time course to determine whether cytoskeletal responses were simply altered kinetically in NOD mice. As shown in Figure 5C, the response gradually returned to baseline over 40 minutes; at no time did the NOD response rise above 5 fold and it was never greater than B6. The response was dependent on proximal signaling molecules as pre-incubation with dasatanib or the SRC family kinase inhibitor Src-I1 largely abolished the response (Figure 5D). The NOD network was, however, capable of de-polymerization as incubation with latrunculin B, which induces complete de-polymerization, resulted in identical responses between NOD and B6.
Splenic B cells are required for the diabetes-preventing effect of polyIC
Rather than resulting in a depletion of marginal zone B cells as expected, we found that the diabetes-preventing capacity of polyIC is associated with the activation and splenic retention of these cells. As certain regulatory B cell subsets overlap with marginal zone markers, we hypothesized that polyIC induces a B cell dependent mechanism of diabetes protection. B cells within the marginal zone are well adapted to interact with N'T cells through their expression of CD1d, and Ik-like cells have been associated with diabetes protection by polyIC previously.30 To investigate this interaction, we treated NOD and B cell deficient NOD mice (NOD.μMT) with a 9 day course of polyIC. At the end of treatment, DX5+ cells, which include IK and N'T cells, were obtained from these donor mice and 1×10ˆ6 were transferred into NOD.scid recipients along with 20 million cells from a diabetic NOD donor (Figure 6). NOD.scid mice were also given diabetic splenocytes alone as a control. DX5+ cells derived from polyIC-treated, WT NOD donors prolonged the time until the development of diabetes and prevented diabetes in some recipients. Cells from B cell deficient donors did not provide any protection from disease indicating activation of B cell mediated protection in the spleen by TLR3 ligation.
Figure 6. B cell dependent induction of diabetes protection.

DX5+ cells were isolated from either polyIC treated NOD mice (n=8, squares) or polyIC treated B cell deficient NOD.mMT mice (n=8, triangles). In treated mice, 100ug polyIC was given daily for 9 days. 1 million DX5+ cells were transferred along with 20 million splenocytes from a diabetic donor into NOD/scid recipients. The time to diabetes was also compared to control NOD mice that received diabetic splenocytes alone (n=12, circles). Blood sugars were followed twice weekly until diabetes developed. Cells from NOD mice protected against diabetes development (*p<0.05 NOD/polyIC vs Ctrl) whereas the same cells from B cell deficient donors lost their capacity to prevent diabetes transfer (**p<.05 vs NOD/polyIC, log rank). Data are from two separate experiments.
Discussion
There is presently a compelling need to regulate the balance between B cell activation, elimination, and regulation, which has become an area of substantial opportunity for autoimmune disease modulation. B lymphocytes are well-positioned to interact with Toll-like receptor ligands and thereby control immune outcomes. Previous studies of TLR signaling suggested that NOD B cells are hyper-responsive to these innate signals.31 Our characterization of surface markers expressed by NOD B lymphocytes also supported their potential for excessive responsiveness to TLR activation, in particular to LPS/TLR4. However, our dose-response study did not reveal hyper-responsiveness by these cells. Although the baseline activation status was different, hyper-responsiveness should be reflected either as an ability to respond to lower amounts of stimulus or the capacity to more rapidly reach a maximal response (steeper dose-response curve). NOD B lymphocytes when stimulated through all major TLR pathways did not show increased sensitivity or a proportionally greater response at any concentration as compared to B6.
However, we did note for the first time that signaling through these pathways differentially effects specific B lymphocyte subsets in both ex vivo and in vivo studies. This new control mechanism suggested that individual B cell subsets could be specifically targeted and modulated. In particular, the survival of the marginal zone appears to be positively influenced by MyD88 signals while being diminished by TRIF-dependent signals following polyIC. We were interested in marginal zone dynamics as these cells have been repeatedly associated with diabetes progression.20, 21 In addition, they are positioned to filter and regulate the response to blood-borne antigens making them likely to come in frequent contact with hormones such as insulin while simultaneously contacting potential recirculating adjuvants. Because marginal zone B cells may drive T1D, we focused on in vivo treatment with polyIC, which we expected would deplete these cells. Similar to other reports, we found disease protection following treatment of 9 week old mice with a 9 day course of polyIC.30, 32, 33 However, we did not find marginal zone depletion. Treatment of B6 mice with polyIC uncovered the expected marginal zone mobilization and egress from the spleen.
Given the extreme difference in response to TLR3 ligation between NOD and B6 mice in vivo, we suspected an unidentified aspect of B lymphocyte biology was incorrectly regulated in NOD mice leading to this dramatic difference. Activation of most TLR pathways in non-autoimmune mice causes marginal zone B cell activation and egress from the spleen. MyD88-dependent TLR signals modulate sphingosine 1 phosphate receptors to induce relocalization.28 Previous reports suggest that polyIC/TLR3 signaling does not directly modulate this system but rather works through a rapid increase in CD69 that opposes the S1P-R system and also leads to B lymphocyte egress.34 We did not find differential induction of CD69 in either in vivo or ex vivo stimulation between the strains. In addition, we did not find evident differences in the expression of S1P-R1 or SIP-R3 (not shown).
In the absence of any clear difference in the well-described effectors of marginal zone B cell mobilization, we considered that successful mobilization would require engagement and re-organization of the actin cytoskeleton. The regulation of the actin cytoskeleton is now appreciated to regulate B lymphocyte signaling and other functions.35, 36 Direct de-polymerization of the actin cytoskeleton, even in the absence of other known B cell signals, activates B lymphocytes.37 Moreover, actin-mediated mobility of BCRs is critical for their clustering and activation.38 Once activated, cytoskeletal dynamics are also required for cell migration; this process has been well described in T lymphocytes where interactions between CD43 and the ezrin-radixin-moesin system are required.39 Interestingly, we have also identified a slight upregulation in CD43 in NOD B cells, but the biologic significance is unknown at this time (not shown). This abnormal regulation of cytoskeletal dynamics may also account for the increased dwell time of NOD marginal zone B cells in the spleen, a newly reported phenotype in this autoimmune background.40
We elected to assess actin cytoskeletal dynamics with a potent stimulus that results in dramatic rearrangement of the actin cytoskeleton. In addition, stimulation with hydrogen peroxide likely provides the signals that are derived from superoxides in vivo, which may act as a “Signal 3” in lymphocyte activation and which are required in diabetes pathogenesis.41, 42 Activation by this potent stimulus in B6 B cells lead to a rapid decrease in polymerized F-actin as measured by phalloidin binding. This was not seen in NOD B lymphocytes at any concentration tested or at any time. PolyIC stimulation reduced F-actin mobilization in both NOD and B6 mice; however, in B6 mice even after this reduction the overall decrease in F-actin remained considerable. In NOD mice, the modest activation seen in control conditions was almost completely eliminated by polyIC.
With the emerging role of the cytoskeleton in the control of lymphocyte activation, the consequences of abnormal regulation of polymerization and de-polymerization events may be numerous. Importantly, the actin cytoskeleton has been implicated in determining the strength-of-signal detected by the B cell receptor.37 In B lymphocytes, actin engagement is also required for the turnover of B cell receptors in the process of antigen capture.43 The relative requirement for actin dynamics in B cell activation vs antigen uptake is not known. Altered cytoskeletal dynamics could lead to a B cell in which full cell activation is limited (anergy) while antigen uptake and presentation is preserved. This “split tolerance” phenomenon has been previously described in autoreactive B lymphocytes in which an apparent anergy is induced while antigen presentation and T cell activation continues to proceed efficiently.44, 45
We considered that the retention of cells with marginal zone markers in the spleen following polyIC may lead to B cell mediated regulation as markers of the marginal zone also include B lymphocytes with suspected regulatory activity. Previous studies of polyIC mediated diabetes protection suggested a role for Ik-like cells.30 We therefore investigated the induction of regulatory capacity in DX5+ cells in both B cell sufficient and B cell deficient animals as it has remained technically impossible to obtain large numbers of viable marginal zone B cells by conventional sorting techniques for direct assessment of this hypothesis. Although our diabetes protective effect was modest, this effect relied on the presence of B lymphocytes in the spleen. Whether other cell types may be activated to promote tolerance was not investigated. Nonetheless, stable immune regulation and prevention of autoimmunity requires interactions between a number of cell types with both innate and adaptive immune properties. The role of B lymphocytes as organizers of this protection demands continued investigation.
Overall, we describe the specific interaction between B lymphocyte subsets and TLR signals. Unexpectedly, we determined that MyD88-independent TLR signaling results in diminution of marginal zone B cells in ex vivo studies in NOD and B6 mice. In vivo, this situation is more complex where we determined for the first time that NOD B lymphocytes have a substantial defect in mobilization of the actin cytoskeleton, a defect that may underlie unexplained aspects of B cell biology in NOD mice. In addition, other inter-cellular and stromal interactions in vivo may promote further differences in the handling of TLR signals by B cells in NOD and B6 mice. Understanding the regulation of these signaling processes presents new opportunities for halting the relentless progression of autoimmune disease by coupling receptor activation to the desired lymphocyte response by regulating the B lymphocyte response in both degree and location.
Acknowledgments
This work was supported by the US Public Health Service NIH Grant K08 DK090146 (DJM), by a JDRF Career Development Award 5-CDA-2014-209-A-N (DJM), by the Turner Hazinski Scholars Award (DJM), by the Alice and Henry Hooker Diabetes Research Scholar Award (DJM), the Price Family Discovery Award (DJM), by Cellular, Biochemical, and Molecular Sciences Training Grant 5T32GM008554-17 (CSW), by NIH MSTP 5T32GM007347-33 (BTS) and by funds from the Department of Pediatrics at Vanderbilt University.
Footnotes
Disclosure: None declared.
References
- 1.Orban T, Sosenko JM, Cuthbertson D, et al. Pancreatic islet autoantibodies as predictors of type 1 diabetes in the Diabetes Prevention Trial-Type 1. Diabetes Care. 2009;32:2269–74. doi: 10.2337/dc09-0934. [DOI] [PMC free article] [PubMed] [Google Scholar]
- 2.Ziegler AG, Rewers M, Simell O, et al. Seroconversion to multiple islet autoantibodies and risk of progression to diabetes in children. Jama. 2013;309:2473–9. doi: 10.1001/jama.2013.6285. [DOI] [PMC free article] [PubMed] [Google Scholar]
- 3.Hu CY, Rodriguez-Pinto D, Du W, et al. Treatment with CD20-specific antibody prevents and reverses autoimmune diabetes in mice. J Clin Invest. 2007;117:3857–67. doi: 10.1172/JCI32405. [DOI] [PMC free article] [PubMed] [Google Scholar]
- 4.Pescovitz MD, Greenbaum CJ, Krause-Steinrauf H, et al. Rituximab, B-lymphocyte depletion, and preservation of beta-cell function. N Engl J Med. 2009;361:2143–52. doi: 10.1056/NEJMoa0904452. [DOI] [PMC free article] [PubMed] [Google Scholar]
- 5.Henry RA, Kendall PL, Thomas JW. Autoantigen-specific B-cell depletion overcomes failed immune tolerance in type 1 diabetes. Diabetes. 2012;61:2037–44. doi: 10.2337/db11-1746. [DOI] [PMC free article] [PubMed] [Google Scholar]
- 6.Noorchashm H, Moore DJ, Noto LE, et al. Impaired CD4 T cell activation due to reliance upon B cell-mediated costimulation in nonobese diabetic (NOD) mice. Journal of Immunology. 2000;165:4685–96. doi: 10.4049/jimmunol.165.8.4685. [DOI] [PubMed] [Google Scholar]
- 7.Greeley SA, Moore DJ, Noorchashm H, et al. Impaired activation of islet-reactive CD4 T cells in pancreatic lymph nodes of B cell-deficient nonobese diabetic mice. J Immunol. 2001;167:4351–7. doi: 10.4049/jimmunol.167.8.4351. [DOI] [PubMed] [Google Scholar]
- 8.Moore DJ, Huang X, Lee MKt, et al. Resistance to anti-CD45RB-induced tolerance in NOD mice: mechanisms involved. Transpl Int. 2004;17:261–9. doi: 10.1007/s00147-004-0698-3. [DOI] [PubMed] [Google Scholar]
- 9.Elizer SK, Marshall AF, Moore DJ. Dysregulation of T lymphocyte proliferative responses in autoimmunity. PLoS One. 2014;9:e106347. doi: 10.1371/journal.pone.0106347. [DOI] [PMC free article] [PubMed] [Google Scholar]
- 10.Serreze DV, Chapman HD, Varnum DS, et al. B lymphocytes are essential for the initiation of T cell-mediated autoimmune diabetes: analysis of a new “speed congenic” stock of NOD.Ig mu null mice. J Exp Med. 1996;184:2049–53. doi: 10.1084/jem.184.5.2049. [DOI] [PMC free article] [PubMed] [Google Scholar]
- 11.Yang M, Charlton B, Gautam AM. Development of insulitis and diabetes in B cell-deficient NOD mice. J Autoimmun. 1997;10:257–60. doi: 10.1006/jaut.1997.0128. [DOI] [PubMed] [Google Scholar]
- 12.Jasinski JM, Yu L, Nakayama M, et al. Transgenic insulin (B:9-23) T-cell receptor mice develop autoimmune diabetes dependent upon RAG genotype, H-2g7 homozygosity, and insulin 2 gene knockout. Diabetes. 2006;55:1978–84. doi: 10.2337/db06-0058. [DOI] [PubMed] [Google Scholar]
- 13.Hulbert C, Riseili B, Rojas M, Thomas JW. B cell specificity contributes to the outcome sof diabetes in nonobese diabetic mice. J Immunol. 2001;167:5535–8. doi: 10.4049/jimmunol.167.10.5535. [DOI] [PubMed] [Google Scholar]
- 14.Wen L, Ley RE, Volchkov PY, et al. Innate immunity and intestinal microbiota in the development of Type 1 diabetes. Nature. 2008;455:1109–13. doi: 10.1038/nature07336. [DOI] [PMC free article] [PubMed] [Google Scholar]
- 15.Kim DH, Lee JC, Kim S, et al. Inhibition of autoimmune diabetes by TLR2 tolerance. J Immunol. 2011;187:5211–20. doi: 10.4049/jimmunol.1001388. [DOI] [PubMed] [Google Scholar]
- 16.Aumeunier A, Grela F, Ramadan A, et al. Systemic Toll-like receptor stimulation suppresses experimental allergic asthma and autoimmune diabetes in NOD mice. PLoS One. 2010;5:e11484. doi: 10.1371/journal.pone.0011484. [DOI] [PMC free article] [PubMed] [Google Scholar]
- 17.Zhang Y, Lee AS, Shameli A, et al. TLR9 blockade inhibits activation of diabetogenic CD8+ T cells and delays autoimmune diabetes. J Immunol. 2010;184:5645–53. doi: 10.4049/jimmunol.0901814. [DOI] [PubMed] [Google Scholar]
- 18.Nair A, Wolter TR, Meyers AJ, Zipris D. Innate immune pathways in virus-induced autoimmune diabetes. Ann N Y Acad Sci. 2008;1150:139–42. doi: 10.1196/annals.1447.004. [DOI] [PubMed] [Google Scholar]
- 19.Moriyama H, Wen L, Abiru N, et al. Induction and acceleration of insulitis/diabetes in mice with a viral mimic (polyinosinic-polycytidylic acid) and an insulin self-peptide. Proc Natl Acad Sci U S A. 2002;99:5539–44. doi: 10.1073/pnas.082120099. [DOI] [PMC free article] [PubMed] [Google Scholar]
- 20.Noorchashm H, Moore DJ, Lieu YK, et al. Contribution of the innate immune system to autoimmune diabetes: a role for the CR1/CR2 complement receptors. Cell Immunol. 1999;195:75–9. doi: 10.1006/cimm.1999.1522. [DOI] [PubMed] [Google Scholar]
- 21.Marino E, Batten M, Groom J, et al. Marginal zone B cells of Non-obese diabetic mice expand with diabetes onset, invade the pancreatic lymph nodes and present auto-antigen to diabetogenic T cells. Diabetes. 2007 doi: 10.2337/db07-0589. [DOI] [PubMed] [Google Scholar]
- 22.Moore DJ, Zienkiewicz J, Kendall PL, et al. In vivo islet protection by a nuclear import inhibitor in a mouse model of type 1 diabetes. PLoS One. 2010;5:e13235. doi: 10.1371/journal.pone.0013235. [DOI] [PMC free article] [PubMed] [Google Scholar]
- 23.Pulko V, Liu X, Krco CJ, et al. TLR3-stimulated dendritic cells up-regulate B7-H1 expression and influence the magnitude of CD8 T cell responses to tumor vaccination. J Immunol. 2009;183:3634–41. doi: 10.4049/jimmunol.0900974. [DOI] [PMC free article] [PubMed] [Google Scholar]
- 24.Stewart CR, Stuart LM, Wilkinson K, et al. CD36 ligands promote sterile inflammation through assembly of a Toll-like receptor 4 and 6 heterodimer. Nat Immunol. 2010;11:155–61. doi: 10.1038/ni.1836. [DOI] [PMC free article] [PubMed] [Google Scholar]
- 25.Won WJ, Kearney JF. CD9 is a unique marker for marginal zone B cells, B1 cells, and plasma cells in mice. J Immunol. 2002;168:5605–11. doi: 10.4049/jimmunol.168.11.5605. [DOI] [PubMed] [Google Scholar]
- 26.Noorchashm H, Lieu YK, Noorchashm N, et al. I-Ag7-mediated antigen presentation by B lymphocytes is critical in overcoming a checkpoint in T cell tolerance to islet beta cells of nonobese diabetic mice. J Immunol. 1999;163:743–50. [PubMed] [Google Scholar]
- 27.Cinamon G, Matloubian M, Lesneski MJ, et al. Sphingosine 1-phosphate receptor 1 promotes B cell localization in the splenic marginal zone. Nat Immunol. 2004;5:713–20. doi: 10.1038/ni1083. [DOI] [PubMed] [Google Scholar]
- 28.Rubtsov AV, Swanson CL, Troy S, Strauch P, Pelanda R, Torres RM. TLR agonists promote marginal zone B cell activation and facilitate T-dependent IgM responses. J Immunol. 2008;180:3882–8. doi: 10.4049/jimmunol.180.6.3882. [DOI] [PubMed] [Google Scholar]
- 29.Hara-Chikuma M, Chikuma S, Sugiyama Y, et al. Chemokine-dependent T cell migration requires aquaporin-3-mediated hydrogen peroxide uptake. J Exp Med. 2012;209:1743–52. doi: 10.1084/jem.20112398. [DOI] [PMC free article] [PubMed] [Google Scholar]
- 30.Zhou R, Wei H, Tian Z. NK3-like IK cells are involved in protective effect of polyinosinic-polycytidylic acid on type 1 diabetes in nonobese diabetic mice. J Immunol. 2007;178:2141–7. doi: 10.4049/jimmunol.178.4.2141. [DOI] [PubMed] [Google Scholar]
- 31.Hussain S, Salojin KV, Delovitch TL. Hyperresponsiveness, resistance to B-cell receptor-dependent activation-induced cell death, and accumulation of hyperactivated B-cells in islets is associated with the onset of insulitis but not type 1 diabetes. Diabetes. 2004;53:2003–11. doi: 10.2337/diabetes.53.8.2003. [DOI] [PubMed] [Google Scholar]
- 32.Sobel DO, Goyal D, Ahvazi B, et al. Low dose poly I:C prevents diabetes in the diabetes prone BB rat. J Autoimmun. 1998;11:343–52. doi: 10.1006/jaut.1998.0203. [DOI] [PubMed] [Google Scholar]
- 33.Serreze DV, Hamaguchi K, Leiter EH. Immunostimulation circumvents diabetes in NOD/Lt mice. J Autoimmun. 1989;2:759–76. doi: 10.1016/0896-8411(89)90003-6. [DOI] [PubMed] [Google Scholar]
- 34.Shiow LR, Rosen DB, Brdickova N, et al. CD69 acts downstream of interferon-alpha/beta to inhibit S1P1 and lymphocyte egress from lymphoid organs. Nature. 2006;440:540–4. doi: 10.1038/nature04606. [DOI] [PubMed] [Google Scholar]
- 35.Liu C, Miller H, Hui KL, et al. A balance of Bruton's tyrosine kinase and SHIP activation regulates B cell receptor cluster formation by controlling actin remodeling. J Immunol. 2011;187:230–9. doi: 10.4049/jimmunol.1100157. [DOI] [PMC free article] [PubMed] [Google Scholar]
- 36.Parameswaran N, Enyindah-Asonye G, Bagheri N, Shah NB, Gupta N. Spatial coupling of JNK activation to the B cell antigen receptor by tyrosine-phosphorylated ezrin. J Immunol. 2013;190:2017–26. doi: 10.4049/jimmunol.1201292. [DOI] [PMC free article] [PubMed] [Google Scholar]
- 37.Hao S, August A. Actin de-polymerization transduces the strength of B-cell receptor stimulation. Mol Biol Cell. 2005;16:2275–84. doi: 10.1091/mbc.E04-10-0881. [DOI] [PMC free article] [PubMed] [Google Scholar]
- 38.Liu C, Miller H, Orlowski G, Hang H, Upadhyaya A, Song W. Actin reorganization is required for the formation of polarized B cell receptor signalosomes in response to both soluble and membrane-associated antigens. J Immunol. 2012;188:3237–46. doi: 10.4049/jimmunol.1103065. [DOI] [PMC free article] [PubMed] [Google Scholar]
- 39.Cannon JL, Mody PD, Blaine KM, et al. CD43 interaction with ezrin-radixin-moesin (ERM) proteins regulates T-cell trafficking and CD43 phosphorylation. Mol Biol Cell. 2011;22:954–63. doi: 10.1091/mbc.E10-07-0586. [DOI] [PMC free article] [PubMed] [Google Scholar]
- 40.Stolp J, Marino E, Batten M, et al. Intrinsic molecular factors cause aberrant expansion of the splenic marginal zone B cell population in nonobese diabetic mice. J Immunol. 2013;191:97–109. doi: 10.4049/jimmunol.1203252. [DOI] [PubMed] [Google Scholar]
- 41.Seleme MC, Lei W, Burg AR, et al. Dysregulated TLR3-dependent signaling and innate immune activation in superoxide-deficient macrophages from nonobese diabetic mice. Free Radic Biol Med. 2012;52:2047–56. doi: 10.1016/j.freeradbiomed.2012.01.027. [DOI] [PMC free article] [PubMed] [Google Scholar]
- 42.Thayer TC, Delano M, Liu C, et al. Superoxide production by macrophages and T cells is critical for the induction of autoreactivity and type 1 diabetes. Diabetes. 2011;60:2144–51. doi: 10.2337/db10-1222. [DOI] [PMC free article] [PubMed] [Google Scholar]
- 43.Vascotto F, Lankar D, Faure-Andre G, et al. The actin-based motor protein myosin II regulates MHC class II trafficking and BCR-driven antigen presentation. J Cell Biol. 2007;176:1007–19. doi: 10.1083/jcb.200611147. [DOI] [PMC free article] [PubMed] [Google Scholar]
- 44.Acevedo-Suarez CA, Hulbert C, Woodward EJ, Thomas JW. Uncoupling of anergy from developmental arrest in anti-insulin B cells supports the development of autoimmune diabetes. J Immunol. 2005;174:827–33. doi: 10.4049/jimmunol.174.2.827. [DOI] [PubMed] [Google Scholar]
- 45.Kendall PL, Case JB, Sullivan AM, et al. Tolerant anti-insulin B cells are effective APCs. J Immunol. 2013;190:2519–26. doi: 10.4049/jimmunol.1202104. [DOI] [PMC free article] [PubMed] [Google Scholar]