

Abstract
Background
To investigate the prevalence of nosocomial infections, the distribution of nosocomial infection sites, the use of antibiotic and the situation of detected nosocomial infection pathogens in the Inner Mongolia Autonomous Region of China from 2012 to 2014, to grasp the current conditions of regional nosocomial infections in timely, for the development of infection prevention and control measures to provide a basis for effective hospital.
Methods
A survey of the prevalence of nosocomial infections was conducted in target hospitals using the combination of a bedside survey and medical record review.
Results
In total, 101,907 inpatients were surveyed from 2012 to 2014. There were 1,997 cases of nosocomial infections, accounting for an average prevalence of 1.96%. The infection site was mainly the lower respiratory tract. Higher prevalence of nosocomial infections occurred in the comprehensive intensive care unit (ICU), Neurosurgery Department, and Hematology Department. The average rate of antibiotic use was 33.72%, and the average submission rate for bacterial cultures for patients who received therapeutic treatment with antibiotics was 28.26%. The most common pathogens associated with nosocomial infections were Gram-negative (G−) bacteria, and frequently detected bacterial pathogens included Escherichia coli, Pseudomonas aeruginosa, Klebsiella pneumoniae, Acinetobacter baumannii, and Staphylococcus aureus.
Conclusions
The survey of the prevalence of nosocomial infections helped to identify problems in the control process of nosocomial infections and to develop targeted measures for the prevention and control of these infections accordingly.
Keywords: Nosocomial infection, prevalence, antibiotics
Introduction
With the development of medical technology, the problem of nosocomial infection has become serious increasingly, which affect the life safety of patients and medical staff seriously. Reducing the occurrence of hospital infection effectively not only can reduce the patient’s medical expenses, but also can avoid the medical resources waste. This study reports the findings from a survey of the prevalence of nosocomial infections in the Inner Mongolia Autonomous Region of China from 2012 to 2014. The objectives were to investigate the current situation and trends of nosocomial infections in the Inner Mongolia Autonomous Region and provide theoretical support for developing effective measures for the prevention and control of nosocomial infections to facilitate regional nosocomial infection management.
Materials and methods
Survey subjects
The subjects included all inpatients on the days that the survey was conducted in the target hospitals from 2012 to 2014, including patients discharged or dead on the days the survey was conducted, but patients newly admitted to the hospital were excluded. In total, 26,940, 31,504, and 43,463 inpatients were surveyed in 2012, 2013, and 2014, the hospital is divided into 66, 91, 118 were investigated, respectively.
Survey methods
A cross-sectional survey was conducted, and the survey plan was implemented in accordance with the survey method developed by the National Nosocomial Infection Surveillance and Management Training Base. According to the situation, each hospital was surveyed by full-time staff of the nosocomial infection management team in cooperation with the physicians and nurses of responsible for nosocomial infection control from different clinical departments. The investigators were divided into two groups: one group reviewed medical records, and the other group performed the bedside survey. These two sets of survey data were summarized and input into a “Case Registration Form of the Nosocomial Infection Prevalence Survey” by full-time staff of the nosocomial infection management team.
Diagnostic criteria
Nosocomial infection was diagnosed according to the Diagnostic Criteria for Nosocomial Infection (Trial) issued by the original Ministry of Health of the People’s Republic of China in 2001. When a discrepancy regarding a diagnosis occurred, a decision was reached by discussion among the investigators.
Quality control
One week prior to the survey, a notice that included the survey methods and diagnostic criteria was issued to the clinical departments. Two days before the survey, pre-survey training of investigators was conducted by full-time staff of the nosocomial infection management team, which included the survey plan, diagnostic criteria, and instructions for completing the survey form. In the case of a disagreement, the survey team members discussed the situation to reach a decision. After the completion of the survey, the survey forms were checked by full-time staff, and problems were fixed in a timely manner. The survey data were imported into the National Nosocomial Infection Control Office Automation System (http://oa.yygr.cn/) and reported by full-time staff. Staff at the National Nosocomial Infection Management and Quality Control Center reviewed the reported data again to ensure the accuracy of the survey data.
Statistical analysis
The survey data were imported into the National Nosocomial Infection Control Office Automation System and then exported for statistical analysis using SPSS 19.0. Categorical data were compared by χ2 tests, and a P value of less than 0.05 was considered to indicate statistical significance.
Results
Prevalence of nosocomial infection
The prevalence of nosocomial infections were 2.05% in 2012, 1.82% in 2013, and 2.00% in 2014, with a 3-year average of 1.96%. There were no significant differences in the prevalence of nosocomial infections between different years (χ2=4.91, P=0.09>0.05) (Table 1). Table 2 shows the prevalence of nosocomial infections from 2012 to 2014 in different areas of Inner Mongolia.
Table 1. The survey rates (%) and prevalence (%) of nosocomial infections in the Inner Mongolia Autonomous Region of China [2012-2014].
| Year | Number of expected patients | Number of surveyed patients | Survey rate (%) | Number of infected patients | Infection rate (%) | Frequency of infection | Frequency rate of infection (%) |
|---|---|---|---|---|---|---|---|
| 2012 | 27,285 | 26,940 | 98.74 | 553 | 2.05 | 586 | 2.18 |
| 2013 | 32,013 | 31,504 | 98.41 | 573 | 1.82 | 614 | 1.95 |
| 2014 | 43,720 | 43,463 | 99.41 | 871 | 2.00 | 919 | 2.11 |
| Total | 103,018 | 101,907 | 98.92 | 1,997 | 1.96 | 2,119 | 2.08 |
Table 2. Prevalence of nosocomial infections from 2012 to 2014 in different areas of Inner Mongolia.
| Inner Mongolia (City/league) | 2012 |
2013 |
2014 |
||||||||
|---|---|---|---|---|---|---|---|---|---|---|---|
| Number of surveyed patients | Number of infected patients | Infection rate (%) | Number of surveyed patients | Number of infected patients | Infection rate (%) | Number of surveyed patients | Number of infected patients | Infection rate (%) | |||
| Hohhot | 6,874 | 178 | 2.59 | 7,126 | 163 | 2.29 | 7,450 | 157 | 2.11 | ||
| Baotou | 1,905 | 42 | 2.20 | 2,275 | 29 | 1.27 | 4,608 | 78 | 1.69 | ||
| Ordos | 1,665 | 31 | 1.86 | 1,908 | 37 | 1.94 | 2,261 | 46 | 2.03 | ||
| Hulun Buir | 3,621 | 54 | 1.49 | 3,898 | 40 | 1.03 | 5,914 | 90 | 1.52 | ||
| Hinggan | 1,857 | 32 | 1.72 | 2,034 | 49 | 2.41 | 2,775 | 82 | 2.95 | ||
| Tongliao | 2,654 | 53 | 2.00 | 3,007 | 34 | 1.13 | 3,752 | 52 | 1.39 | ||
| Chifeng | 3,813 | 75 | 1.97 | 4,896 | 105 | 2.14 | 9,617 | 245 | 2.55 | ||
| Xilin Gol | 356 | 6 | 1.69 | 353 | 6 | 1.70 | 732 | 23 | 3.14 | ||
| Ulan Qabu | 962 | 20 | 2.08 | 967 | 18 | 1.86 | 1,241 | 14 | 1.13 | ||
| Bayan Nur | 2,168 | 44 | 2.03 | 3,581 | 68 | 1.90 | 3,676 | 63 | 1.71 | ||
| Wuhai | 882 | 16 | 1.81 | 1,221 | 20 | 1.64 | 1,177 | 15 | 1.27 | ||
| Alxa | 183 | 2 | 1.09 | 238 | 4 | 1.68 | 260 | 6 | 2.31 | ||
| Total | 26,940 | 553 | 2.05 | 31,504 | 573 | 1.82 | 43,463 | 871 | 2.00 | ||
Nosocomial infections in different clinical departments
The results of the 2012-2014 survey showed that comprehensive intensive care unit (ICU) and the Neurosurgery Department, Hematology Department, Neonatology Group of the Pediatrics Department, Gynecology Department, Thoracic Surgery Department, and Nephrology Department were associated with high prevalence of nosocomial infections (Table 3).
Table 3. Top five clinical departments with respect to nosocomial infection rates from 2012 to 2014.
| Year | Infection rates in different departments (%) | ||||
|---|---|---|---|---|---|
| 2012 | Comprehensive ICU (18.27) | Neurosurgery Department (6.75) | Otolaryngology Department (3.57) | Gynecology Department (3.37) | Hematology Department (Group) (3.29) |
| 2013 | Comprehensive ICU (12.92) | Neurosurgery Department (6.72) | Hematology Department (Group) (6.14) | Thoracic Surgery Department (3.83) | Neonatology Group of the Pediatrics Department (3.49) |
| 2014 | Comprehensive ICU (26.70) | Neurosurgery Department (7.53) | Hematology Department (Group) (6.04) | Neonatology Group of the Pediatrics Department (3.90) | Nephrology Department (Group) (2.56) |
ICU, intensive care unit.
Distribution of nosocomial infection sites
The 3-year survey data showed that nosocomial infections were mainly distributed in the lower respiratory tract, upper respiratory tract, urinary tract, and superficial incisions (Table 4).
Table 4. Constituent rations of the nosocomial infection sites (%) from 2012 to 2014.
| Infection site | 2012 |
2013 |
2014 |
|||||
|---|---|---|---|---|---|---|---|---|
| Case number | Constituent ratio (%) | Case number | Constituent ratio (%) | Case number | Constituent ratio (%) | |||
| Upper respiratory tract | 89 | 15.19 | 76 | 12.38 | 104 | 11.32 | ||
| Lower respiratory tract | 216 | 36.86 | 303 | 49.35 | 425 | 46.25 | ||
| Urinary tract | 81 | 13.82 | 93 | 15.15 | 124 | 13.49 | ||
| Gastrointestinal tract | 23 | 3.92 | 10 | 1.63 | 33 | 3.59 | ||
| Gallbladder bile | 4 | 0.68 | 2 | 0.33 | 3 | 0.33 | ||
| Intra-abdominal tissue | 11 | 1.88 | 5 | 0.81 | 21 | 2.29 | ||
| Superficial incision | 74 | 12.63 | 56 | 9.12 | 75 | 8.16 | ||
| Deep incision | 20 | 3.41 | 9 | 1.47 | 24 | 2.61 | ||
| Organ cavity | 1 | 0.17 | 0 | 0.00 | 11 | 1.20 | ||
| Vascular-related | 5 | 0.85 | 5 | 0.81 | 7 | 0.76 | ||
| Blood flow | 9 | 1.54 | 8 | 1.30 | 6 | 0.65 | ||
| Skin/soft tissue | 32 | 5.46 | 24 | 3.91 | 34 | 3.70 | ||
| Burned area | 2 | 0.34 | 0 | 0.00 | 2 | 0.22 | ||
| Others | 19 | 3.24 | 23 | 3.75 | 50 | 5.44 | ||
| Total | 586 | 100.00 | 614 | 100.00 | 919 | 100.00 | ||
Antibiotic use
The rates of antibiotic use were 36.08% in 2012, 32.95% in 2013 and 32.81% in 2014, with a 3-year average of 33.72%. From 2012 to 2014, the rate of antibiotic use decreased from 36.08% to 32.81%, which was a statistically significant difference (χ2=91.78, P=0.00<0.05). Meanwhile, the rate of bacterial cultures submitted before therapeutic use of antibiotics increased from 23.82% to 31.99%, which was a statistically significant difference (χ2=133.08, P=0.00<0.05). Increases in the constituent ratio of monotherapy and the therapeutic use of antibiotics were observed (Table 5). On average, the rates of antibiotic use followed a decreasing trend, while the submission rate for bacterial cultures before therapeutic treatment with antibiotics displayed an increasing trend (Figure 1).
Table 5. The rates (%) of antibiotic use and submissions for examination of disease etiology before therapeutic treatment with antibiotics from 2012 to 2014.
| Year | Number of patients under surveillance | Antibiotic use |
Purposes |
Therapy |
Examination of etiology by bacterial culture |
|||||||||
|---|---|---|---|---|---|---|---|---|---|---|---|---|---|---|
| Number of patients | Rate (%) | Treatment | Prophylaxis | Treatment + prophylaxis | Mono therapy | Dual therapy | Triple (or multi-drug) therapy | Number of cases submitted | Submission rate (%) | |||||
| 2012 | 26,940 | 9,722 | 36.08 | 5,580 | 3,084 | 1,058 | 7,354 | 2,229 | 139 | 1,581 | 23.82 | |||
| 2013 | 31,504 | 10,382 | 32.95 | 6,139 | 3,172 | 1,071 | 7,823 | 2,417 | 142 | 1,974 | 27.38 | |||
| 2014 | 43,463 | 14,262 | 32.81 | 8,308 | 4,667 | 1,287 | 10,722 | 3,309 | 231 | 3,069 | 31.99 | |||
| Total | 101,907 | 34,366 | 33.72 | 20,027 | 10,923 | 3,416 | 25,899 | 7,955 | 512 | 6,624 | 28.26 | |||
Figure 1.
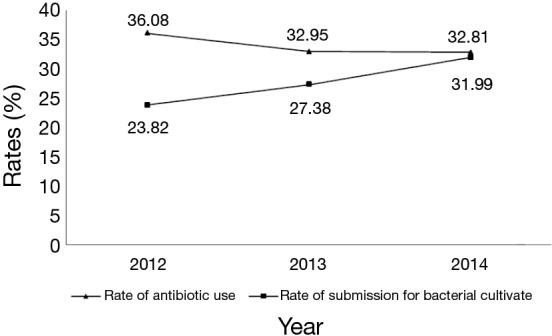
Rates (%) of antibiotic use and submission for examination of the disease etiology by bacterial culture before therapeutic use of antibiotics from 2012 to 2014.
Pathogens of nosocomial infections
The consecutive 3-year survey showed that G− bacteria were the most common pathogens (>60%) of nosocomial infections, followed by G+ bacteria. Fungi and other pathogens were detected less frequently (Table 6). The constituent ratios of pathogens that caused nosocomial infections from 2012 to 2014 are shown in Figure 2.
Table 6. Distribution and constituent ratios of pathogens that caused nosocomial infections from 2012 to 2014 (%).
| Pathogen | 2012 |
2013 |
2014 |
|||||
|---|---|---|---|---|---|---|---|---|
| Number of cases | Constituent ratio (%) | Number of cases | Constituent ratio (%) | Number of cases | Constituent ratio (%) | |||
| G− bacteria | 158 | 71.82 | 203 | 67.22 | 298 | 70.28 | ||
| Acinetobacter baumannii | 16 | 7.27 | 40 | 13.25 | 46 | 10.85 | ||
| Klebsiella pneumoniae | 41 | 18.64 | 40 | 13.25 | 55 | 12.97 | ||
| Escherichia coli | 46 | 20.91 | 51 | 16.89 | 81 | 19.10 | ||
| Pseudomonas aeruginosa | 30 | 13.64 | 26 | 8.61 | 61 | 14.39 | ||
| Enterobacter spp | 4 | 1.82 | 18 | 5.96 | 18 | 4.25 | ||
| Other G− bacteria | 21 | 9.55 | 28 | 9.27 | 37 | 8.73 | ||
| G+ bacteria | 47 | 21.36 | 74 | 24.5 | 98 | 23.11 | ||
| Staphylococcus aureus | 27 | 12.27 | 32 | 10.6 | 44 | 10.38 | ||
| Other Staphylococcus | 8 | 3.64 | 19 | 6.29 | 22 | 5.19 | ||
| Enterococcus spp | 6 | 2.73 | 11 | 3.64 | 22 | 5.19 | ||
| Other G+ bacteria | 6 | 2.73 | 12 | 3.97 | 10 | 2.36 | ||
| Fungi | 10 | 4.55 | 19 | 6.29 | 21 | 4.95 | ||
| Candida albicans | 3 | 1.36 | 8 | 2.65 | 10 | 2.36 | ||
| Other fungi | 7 | 3.18 | 11 | 3.64 | 11 | 2.59 | ||
| Other pathogens | 5 | 2.27 | 6 | 1.99 | 7 | 1.65 | ||
| Total | 220 | 100.00 | 302 | 100.00 | 424 | 100.00 | ||
G−, Gram-negative.
Figure 2.
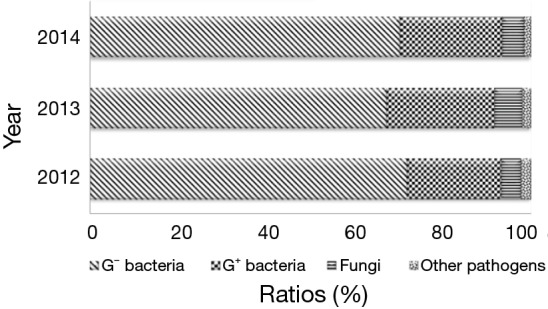
Constituent ratios of pathogens that caused nosocomial infections from 2012 to 2014 (%).
Discussion
Authorized by the Inner Mongolia autonomous region health and family planning commission, organized by the Nosocomial Infection Management and Quality Control Center of the Inner Mongolia Autonomous Region to carry out the hospital infection rate survey. Through the investigation to understand the prevalence of nosocomial infections, the distribution of nosocomial infection sites, the use of antibiotic and the situation of detected nosocomial infection pathogens in the Inner Mongolia Autonomous Region of China from 2012 to 2014, to grasp the current conditions of regional nosocomial infections in timely, for the development of infection prevention and control measures to provide a basis for effective hospital.
Prevalence of nosocomial infections
The actual survey rates over the 3-year period from 2012 to 2014 remained greater than 96.00%, which is consistent with the findings of the survey. The 3-year average prevalence of nosocomial infections was 1.96% in Inner Mongolia. This value is lower than that reported by Wu et al. in a national survey in 2012 (3.22%, χ2=477.79, P=0.00<0.05) and the survey results reported in Sichuan in 2011 (2.64%, χ2=90.79, P=0.00<0.05). Moreover, the average prevalence of nosocomial infections in Inner Mongolia is far lower than the survey result reported by the European Centre for Disease Prevention and Control in 2010 (7.1%) (1-4). No significant differences were found in the prevalence of nosocomial infections during the individual years from 2012 to 2014, indicating that the prevalence of nosocomial infections was relatively stable in Inner Mongolia. From 2012 to 2014, the prevalence of nosocomial infections displayed different trends in various areas of the study region. Specifically, declines in the prevalence of nosocomial infections were observed in Hohhot City, Ulan Qabu League, Bayan Nur League, and Wuhai City, while an increasing trend was found in Ordos City, Hinggan League, Chifeng City, Xilin Gol League, and Alxa League. Moreover, the prevalence of nosocomial infections first decreased and then increased in Baotou, Hulun Buir, and Tongliao City. The increase in the prevalence may be related to different survey periods and a high underreporting rate of nosocomial infections. It is also possible that the prevalence of nosocomial infections actually increased during the study period. This finding suggests that hospitals of highly prevalence of nosocomial infections should continue to strengthen prevention and control measures and implement associated measures for nosocomial infections. In recent years, the Nosocomial Infection Management and Quality Control Center of the Inner Mongolia Autonomous Region has organized hospitals for targeted surveillance of nosocomial infections in the ICU and neonatal and surgical sites and has conducted surveillance of antibiotic use. Good results were achieved, and the conditions that promote nosocomial infections have been effectively controlled. The survey results reflect the current conditions of nosocomial infections and further reflect the future trend of nosocomial infections in the Inner Mongolia Autonomous Region.
Nosocomial infections in different clinical departments
Based on the 3-year survey results, the comprehensive ICU, Neurosurgery Department., and Hematology Department were identified as the clinical departments with the highest prevalence of nosocomial infections. This finding is consistent with previous studies in China and other countries (5-7). The majority of the patients admitted to the comprehensive ICU have undergone invasive operations, more basic diseases, a long period of hospitalization, and long-term use of antibiotics. Moreover, these patients mostly carried multidrug-resistant bacteria. As a consequence, the comprehensive ICU was the clinical department with the highest prevalence of nosocomial infections. In the surgical system, the Neurosurgery Department exhibited the highest prevalence of nosocomial infections. Most patients admitted to the Neurosurgery Department had undergone a craniotomy, resulting in coma and prolonged bed rest. These patients commonly received assisted breathing and catheterization and were prone to respiratory and intracranial infections. Therefore, the Neurosurgery Department should be a high priority for nosocomial infection management. In the Hematology Department, the inpatients had commonly received immunosuppressive drugs, hormones, and chemotherapy drugs. Due to their compromised immunity, these patients were at high risk of nosocomial infections. Compared to the results of the survey in 2012 and 2013, the prevalence of nosocomial infections in 2014 were relatively higher in the Comprehensive ICU, Neurosurgery Department, Hematology Department, and Nephrology Department. The above departments will be priorities for future management of nosocomial infections in the study region.
Nosocomial infection sites
The survey results showed that nosocomial infections mainly occurred in the lower respiratory tract, which is consistent with previous reports in China and other countries (8-10). A monitoring was conducted by the Hu B, data from 2,631 patients hospitalized in ICU.VAP, catheter related bloodstream infection, Catheter-associated urinary tract infection were 10.46 per 1,000 bed day, 7.66 per 1,000 bed day, 1.29 per 1,000 bed day respectively (11). Thus it can be seen that, high-risk factors which cause respiratory infections is invasive procedure. Respiratory infections are an important and difficult point of nosocomial infection prevention and control. High-risk factors that cause respiratory infections include the use of a ventilator, intubation and incision, non-standardized performance of sputum aspiration, improper oral care, and poor ward environment. We will take hand hygiene assessment, disinfection and isolation systems, aseptic operation systems, visiting procedures, and invasive procedure assessment into consideration in the quality assessment system. A series of measures for training, education, and examination can be applied to improve the awareness of medical staff, cleaning staff, patients, and their families regarding the prevention and control of nosocomial infections. These measures could reduce the risk of nosocomial infections effectively (12). To increase hand hygiene compliance of medical staff, we should take a series of measures which included the following elements: administrative support, supplies availability, education and training, reminders in the workplace, process surveillance and performance feedback, etc. (13). Currently, the Inner Mongolia Nosocomial Infection Management and Quality Control Center has stated that the hospitals registered in the surveillance network which should carry out targeted surveillance of nosocomial infections at important sites. Prevention of nosocomial infections at these sites, especially for infections caused by invasive procedures, is a future priority.
Antibiotic use
In this survey, the rates of antibiotic use and bacterial culture submitted for examination of disease etiology before the therapeutic use of antibiotics were both lower than the national survey results in China (2). In the first half of 2011, the State Planning Commission initiated a special rectification action towards the clinical application of antibiotics. Moreover, the “Management Approach for Clinical Use of Antibiotics in Medical Institutions” was promulgated, which further specified the clinical use of antibiotics in China. Currently, the hospitals in the study region all include indicators of antibiotic use in the hospital management and quality assessment system and implement targeted surveillance of antibiotic use. This effort has attenuated the abuse of antibiotics. Discover and correct the phenomenon timely that antibiotic was unreasonable used the therapeutic use of antibiotics for bacterial culture rate still remain lower. Empirical and broad-spectrum uses of antibiotics are common problems in clinical departments, which urgently need to be addressed. The rational use of antibiotics will not only reduce medical risks but also diminish the health burden on the patient.
Pathogens of nosocomial infection
The survey results showed that Gram-negative (G−) bacteria were the primary pathogens of nosocomial infections, while fungi, viruses, and other pathogens were detected less frequently. Among G− bacteria, E. coli, P. aeruginosa, K. pneumoniae, and A. baumannii were detected more frequently. With respect to G+ bacteria, staphylococci and enterococcus were commonly found. These results are generally consistent with the results of the 2012 National Survey (2). From 2012 to 2014, the constituent ratio of G− bacteria for pathogens that cause nosocomial infections followed a downward trend, while the ratios of G+ bacteria and other pathogens were relatively increased. These changes are worthy of attention, and hospitals should notice these trends in future efforts for nosocomial infection prevention and control. A portion of the bacterial pathogens exhibited broad-spectrum or multi-drug resistance to antibiotics. The inherent characteristics of multi-drug resistant strains could make it difficult to cure the resultant diseases. Rationally using antibiotics, increasing the culture submission rate for examination of the disease etiology, and improving the compliance and accuracy of hand hygiene of the medical staff are the keys to reducing infections with multi-drug resistant bacteria.
Conclusions
The survey of the prevalence of nosocomial infections helped to identify problems in the control process of nosocomial infections and to develop targeted measures for the prevention and control of these infections accordingly.
Acknowledgements
Funding: This work was supported by the Inner Mongolia Autonomous Region Natural Science Fund Project (2014MS0880).
Footnotes
Conflicts of Interest: The authors have no conflicts of interest to declare.
References
- 1.Custovic A, Smajlovic J, Tihic N, et al. Epidemiological monitoring of nosocomial infections caused by acinetobacter baumannii. Med Arch 2014;68:402-6. [DOI] [PMC free article] [PubMed] [Google Scholar]
- 2.Sieniawski K, Kaczka K, Rucińska M, et al. Acinetobacter baumannii nosocomial infections. Pol Przegl Chir 2013;85:483-90. [DOI] [PubMed] [Google Scholar]
- 3.Necati Hakyemez I, Kucukbayrak A, Tas T, et al. Nosocomial Acinetobacter baumannii Infections and Changing Antibiotic Resistance. Pak J Med Sci 2013;29:1245-8. [DOI] [PMC free article] [PubMed] [Google Scholar]
- 4.Zarb P, Coignard B, Griskeviciene J, et al. The European Centre for Disease Prevention and Control (ECDC) pilot point prevalence survey of healthcare-associated infections and antimicrobial use. Euro Surveill 2012;17. [DOI] [PubMed] [Google Scholar]
- 5.Ahoyo TA, Bankolé HS, Adéoti FM, et al. Prevalence of nosocomial infections and anti-infective therapy in Benin: results of the first nationwide survey in 2012. Antimicrob Resist Infect Control 2014;3:17. [DOI] [PMC free article] [PubMed] [Google Scholar]
- 6.Davoudi AR, Najafi N, Hoseini Shirazi M, et al. Frequency of bacterial agents isolated from patients with nosocomial infection in teaching hospitals of Mazandaran University of Medical Sciences in 2012. Caspian J Intern Med 2014;5:227-31. [PMC free article] [PubMed] [Google Scholar]
- 7.Moura ME, Campelo SM, de Brito FC, et al. Nosocomial infection: study of prevalence at a public teaching hospital. Rev Bras Enferm 2007;60:416-21. [DOI] [PubMed] [Google Scholar]
- 8.Rosenthal VD, Maki DG, Mehta Y, et al. International Nosocomial Infection Control Consortium (INICC) report, data summary of 43 countries for 2007-2012. Device-associated module. Am J Infect Control 2014;42:942-56. [DOI] [PubMed] [Google Scholar]
- 9.Dereli N, Ozayar E, Degerli S, et al. Three-year evaluation of nosocomial infection rates of the ICU. Braz J Anesthesiol 2013;63:73-8. [DOI] [PubMed] [Google Scholar]
- 10.Kritsotakis EI, Dimitriadis I, Roumbelaki M, et al. Case-mix adjustment approach to benchmarking prevalence rates of nosocomial infection in hospitals in Cyprus and Greece. Infect Control Hosp Epidemiol 2008;29:685-92. [DOI] [PubMed] [Google Scholar]
- 11.Hu B, Tao L, Rosenthal VD, et al. Device-associated infection rates, device use, length of stay, and mortality in intensive care units of 4 Chinese hospitals: International Nosocomial Control Consortium findings. Am J Infect Control 2013;41:301-6. [DOI] [PubMed] [Google Scholar]
- 12.Tao L, Hu B, Rosenthal VD, et al. Impact of a multidimensional approach on ventilator-associated pneumonia rates in a hospital of Shanghai: findings of the International Nosocomial Infection Control Consortium. J Crit Care 2012;27:440-6. [DOI] [PubMed] [Google Scholar]
- 13.Su D, Hu B, Rosenthal VD, et al. Impact of the International Nosocomial Infection Control Consortium (INICC) Multidimensional Hand Hygiene Approach in five intensive care units in three cities of China. Public Health 2015;129:979-88. [DOI] [PubMed] [Google Scholar]