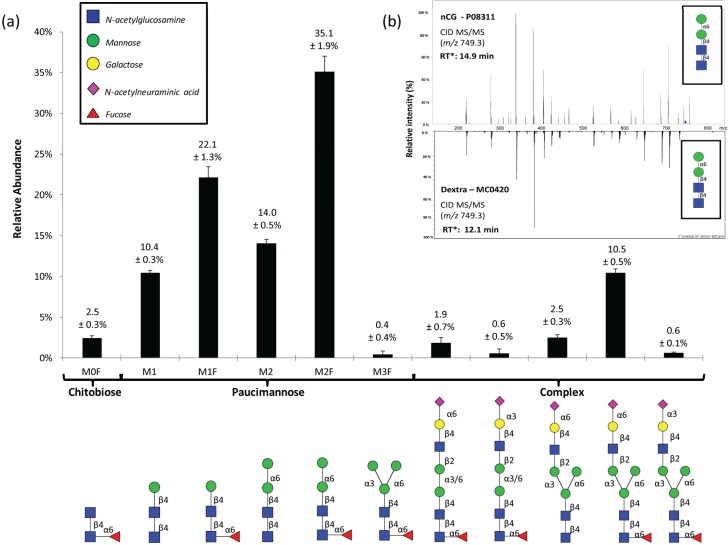
Figure 2.
(a) The PGC-LC-MS/MS-based N-glycome profiling revealed 11 N-glycans comprising chitobiose core, paucimannosidic, and complex type N-glycans. The structures, linkages, and relative abundances of the individual N-glycans are illustrated. Data points are plotted as mean ± SD, n = 3. Symbols are used according to the Consortium for Functional Glycomics / Essentials of Glycobiology notation (see insert). All N-glycans were observed in their reduced (alditol) form; (b) CID-MS/MS and PGC-LC retention time (* calculated relative to M3F in each profile) matching of the paucimannosidic M2 to an identical glycan reference compound was performed. See Figure S3 for de novo CID-MS/MS characterization of all observed N-glycans analyzed under negative ionization polarity.

