

Abstract
Cadmium (Cd) is present in food at low levels and accumulates in humans throughout life because it is not effectively excreted. Cd from smoking or occupational exposure shows adverse effects on health, but the mechanistic effect of Cd at low dietary intake levels is poorly studied. Epidemiology studies found that nonalcoholic fatty liver disease (NAFLD), common in U.S. adults, is associated with Cd burden. In cell studies, we found that environmental low-dose Cd oxidized proteins and stimulated inflammatory signaling. However, little is known about low-dose Cd effects on liver function and associated metabolic pathways in vivo. We investigated effects of low-level Cd exposure on liver gene transcripts, metabolites, and associated metabolic pathways and function after challenging mice with Cd (10 mg/l) by drinking water. Results showed liver Cd in treated mice was similar to adult humans without occupational or smoking exposures and 10-fold higher than control mouse values. Pathway analysis of significantly altered liver genes and metabolites mapped to functional pathways of lipid metabolism, cell death and mitochondrial oxidative phosphorylation. These are well-recognized pathways associated with NAFLD. Cd–treated mice had higher liver enzymes in plasma and a trend toward fat accumulation in liver. To verify low-dose Cd-induced stimulation of cell death pathways, phosphorylation of c-Jun N-terminal kinase (JNK) was examined in cultured hepatic cells. Consistent with mouse liver data, low-dose Cd stimulated JNK activation. Together, the results show that low-dose Cd exposure causes liver function changes consistent with a role in NAFLD and possibly also nonalcoholic steatohepatitis.
Keywords: nonalcoholic fatty liver disease, environmental toxicant, apoptosis, metabolomics, transcriptomics
An extensive literature exists for Cd toxicity from occupational exposures and smoking, but critical issues remain for low-dose environmental Cd exposures. A key issue is that Cd is not effectively excreted and accumulates in humans (10–35 year half-life) (Goyer, 1997; Peters et al., 2010). Most of the Cd in vivo is protein bound (Nordberg et al., 1985), and analyses of human organs have shown the greatest accumulations in liver and kidney. Both liver and kidney mass decline with age (Tiran et al., 1995), potentially increasing the Cd burden with aging (Ruiz et al., 2010). The total Cd burden is reflected by the urinary Cd output, which increases with age for both men and women (Ruiz et al., 2010). Food is the major source of Cd exposure for nonsmokers; daily intake of Cd for adult males and females is about 0.35 and 0.30 µg/kg, respectively (ATSDR, 2012). The European Food Safety Authority has recommended a tolerable intake of 2.5 µg/kg per week (Authority, 2011), which approximates the average Cd intake by U.S. adults. Our earlier in vitro studies with Cd at concentrations expected from food showed widespread protein oxidation in cell cultures (Go et al., 2013a).
In a previous mechanistic study of liver mitochondrial protein oxidation in mice, an acute high dose of Cd caused oxidation of mitochondrial proteins related to fatty acid and branch chain amino acid metabolism (Go et al., 2014). Associated changes in metabolites of these pathways suggested a possible role of these changes the development of fatty liver, but this has not been studied at low, environmental levels. Excess lipid deposition in liver is a critical abnormal characteristic of nonalcoholic fatty liver disease (NAFLD). NAFLD is defined as hepatic steatosis without significant alcohol consumption and is common among U.S. population (19.0%) (Lazo et al., 2013) and in the elderly (Bertolotti et al., 2014; Hamaguchi et al., 2012). The prevalence of NAFLD is increasing in association with obesity (Adams et al., 2005; Williams et al., 2011), although lean NAFLD also occurs in a minority of cases (Chen et al., 2006; Kim et al., 2004). NAFLD can progress to nonalcoholic steatohepatitis (NASH), a major cause of cirrhosis resulting in permanent liver damage. Epidemiologic research using National Health and Nutrition Examination Survey (NHANES) III data shows that after correction for all other known risk factors, fatty liver disease and liver-related mortality are associated with urinary Cd levels (Hyder et al., 2013). A recent study using NHANES data further found a substantial increase in prevalence of NAFLD in the U.S. population during two decades, from 18% in 1988–1991 to 31% in 2011–2012 (Ruhl and Everhart, 2015). Of special concern, the prevalence of suspected NAFLD has more than doubled over the past 20 years in adolescents (Welsh et al., 2013), providing an expectation for a continuing increase in NAFLD during coming decades.
The liver functions in many aspects of metabolic homeostasis, and development of NAFLD is associated with dysregulation of multiple metabolic pathways in the liver (Cave et al., 2007; Min et al., 2012). The major metabolic pathways associated with NAFLD are summarized in Figure 1, modified from the Kyoto Encyclopedia of Genes and Genomes (KEGG) metabolic pathway map of NAFLD, “http://www.genome.jp/kegg-bin/show_pathway?hsa04932.” Central pathways include fatty acid biosynthesis and oxidation, apoptosis, and mitochondrial oxidative phosphorylation regulation, and hepatocellular carcinoma proliferation. Lipid accumulation is associated with insulin resistance (IR) and defects in transcriptional regulation of genes involved in free fatty acid disposal and biosynthesis regulated by transcription factors, peroxisome proliferator activated receptor (PPAR) and sterol response element binding protein-1c. Perturbations in these metabolic networks stimulate oxidative stress by elevating reactive oxygen species involving mitochondrial β-oxidation of fatty acids and oxidative phosphorylation, and endoplasmic reticulum (ER) stress (Basseri and Austin, 2012; Chen et al., 2015; Du et al., 2014; Muthukumar and Nachiappan, 2013). Increased cellular oxidative stress causes further elevations in inflammation with the production of cytokines [Fas ligand (FasL), TNF-α, IL-1, and IL-6], promoting apoptotic cell death with activation of c-Jun-N terminal Kinase (JNK) and Bax, and stimulating fibrosis with TGF-β activation.
FIG. 1.

Metabolic network dysregulation associated with NAFLD. Major pathways contributing to NAFLD include dysregulations in fatty acid biosynthesis/oxidation, apoptosis, inflammation, ER stress, and mitochondria oxidative phosphorylation. Low-dose Cd-altered genes and metabolites were added to the KEGG metabolic pathways associated with NAFLD (http://www.genome.jp/kegg-bin/show_pathway?hsa04932+3643) and highlighted by green color.
In this study, we used an integrated omics (transcriptomics plus metabolomics) approach to examine effects of low-level Cd in mouse liver. The dose of Cd was selected to cause liver Cd accumulation to levels similar to those in middle age Americans without cigarette or occupational exposure (Baker et al., 2002; Tiran et al., 1995; Yilmaz, 2002). Livers were examined for Cd accumulation, lipid accumulation, gene expression, and metabolomics; plasma was analyzed for liver enzyme activities and metabolomics. The results indicate that well-known hepatotoxicity from occupational Cd exposure or smoking may also occur from other sources of low-dose Cd exposure in the general population.
MATERIALS AND METHODS
Animals
Male C57BL/6 mice were chosen as a well-established animal model for studies of liver disease related to NAFLD with detailed prior characterization of Cd sensitivity (Thijssen et al., 2007a,b). Greater absorption in females compared with males (Olsson et al., 2002) therefore suggests that any observed toxicity in the male at this dose should replicate or be worsened in a female cohort. The age of 8 weeks at the start of the study was chosen because we did not intend to assess developmental toxicity, and at 8 weeks the majority of mouse development is completed; older mice may show more pronounced effects due to greater sensitivity to NAFLD.
Eight-week-old male C57BL/6 J mice were purchased from Jackson Laboratory and housed under conventional conditions of 21–24°C and 12:12 light dark cycle. A total number of 17 mice were randomly assigned to control and Cd treatment groups and subsets were used for sample collections for different assays as indicated. Mice were provided free access to standard lab chow (Harlan Teklad 2018S) and tap water. Mice were randomly assigned to either a control group [0 mg/l CdCl2 (Sigma Aldrich, St. Louis, Missouri) in drinking water] or Cd-treated group (10 mg/l CdCl2 in drinking water) and received treatment for 20 weeks. According to the information provided by Harlan Laboratories, the average Cd content in mouse food is close to 70 ppb (70 ng/g) which is negligible (<1.0%) compared with Cd amount given by drinking water. Urine was collected from the mice at experiment termination and the mice were euthanized using isoflurane overdose. All studies were approved by the Atlanta Veterans Affair Medical Center Institutional Animal Use and Care Committee (V018-03).
Cd measurement in liver tissues by inductively coupled plasma mass spectrometry
Liver tissues collected from control and Cd-treated mice as described above were analyzed for Cd content by liver tissues by inductively coupled plasma mass spectrometry (ICP-MS). Protein (1.5 mg) was digested with nitric acid for the complete removal of bio-organic material, then measured. ICP-MS procedures confirmed the previously stated accuracy and precision standards (Caudill et al., 2008).
Cell culture, Cd and selenium treatment, and Western blot analysis
HepG2 hepatocytes purchased from American Type Culture Collection were maintained (37°C, 5% CO2) in a growth medium (Dulbecco’s Minimal Essential Medium, containing 10% fetal bovine serum). Cells were treated with 2% fetal bovine serum without or with Cd (CdCl2) for 2 h and analyzed for phosphorylation of JNK and Akt using Western blotting. Briefly, blots were probed with an antibody specific to phosphorylation of JNK1/2 (Cell Signaling Transduction, Danvers, Massachusetts) or phospho-Akt (Ser 473, Cell Signaling Transduction). A subset of HepG2 cells was treated with Selenium (Se) (Na2SeO3, Sigma) 2 h prior to Cd treatment, lysed and followed by Western blot analysis to examine JNK phosphorylation.
Transcriptomics
RNA was isolated from liver tissue with the mirVana total RNA isolation kit (Life Technologies, Grand Island, New York). Total tissue RNA was hybridized on Affymetrix Mouse Gene ST 2.0 exon chips following NuGEN Ovation RNA Amplification. Robust multiarray average (RMA) was used to create summarized data of the chips as an Affymetrix Expression set to determine fold change and significant differences using Limma in R (Linear Models for Microarray Data; Bioconductor) at alpha = .05. The data of significantly different genes in expression compared between control and Cd treatment has been provided in supplementary data (Supplementary Material S1). Significantly different transcripts were validated with partial least squares discriminant analysis (PLS-DA) analysis [variable importance of projection (VIP) score ≥ 1.5] as a multivariate alternative to limma. For pathway and network analyses, significant transcripts were annotated according to the Affymetrix na33.2 annotation release and data were loaded into MetaCore (https://portal.genego.com).
Metabolomics
To prepare samples for metabolomics analysis by liquid chromatography-mass spectrometry (LC-MS), 50 µl of plasma was added to 100 µl of acetonitrile containing a mixture of 14 stable isotope standards as previously described (Go et al., 2015a,b). Plasma extracts (10 µl) were analyzed in triplicate via a high-resolution metabolomics platform using C18 LC-MS (85-2000 m/z) on LTQ-Velos Orbitrap mass spectrometer. MS data [mass-to-charge (m/z), retention time (RT), intensity] were extracted using xMSanalyzer with apLCMS (Uppal et al., 2013). Triglyceride (TG) and diglyceride (DG) annotations were obtained using high-resolution (10 ppm) matches to Metlin (http://metlin.scripps.edu/metabo_search_alt2.php) and are representative of possible chain lengths consistent with the measured m/z.
Fatty liver disease markers
Fat accumulation was examined on frozen liver sections from 6 mice for each group. The 41and 43 frozen liver sections of control and Cd mice, respectively (6–8 sections from each liver), were prepared for fat accumulation analysis using Oil-Red-O (ORO) staining as described (Mehlem et al., 2013). At least 3 different areas of each stained section were quantified using NIH image J software following the procedures reported by Mehlem et al. (2013). Blinded scoring of ORO-stained sections for fatty liver was also obtained. Subsets of frozen section were stained with hematoxylin and eosin (H&E, Sigma-Aldrich, St. Louis, Missouri) following standard H&E staining protocol (Fischer et al., 2008). To evaluate collagen deposition, liver tissue sections were stained with picrosirius red solution (Picro Sirius Red Stain kit, Abcam, Cambridge, Massachusetts) following the procedure provided by manufacturer. Histology images were obtained using Zeiss Light Microscope. Liver enzymes including ALT (alanine transaminase) and AST (aspartate transaminase) were quantified by measuring activities in plasma collected from Cd and control mice (Cayman, Ann Arbor, Michigan).
Quantitative real-time-polymerase chain reaction
Total mRNA was isolated from liver tissues collected from mice treated with or without Cd using RNeasy mini kit (Qiagen) following the manufacturer’s protocol, and reverse transcription was performed to generate cDNA (Clonetech, Mountain View, California). Briefly, gene expression level was quantified by an absolute quantification method that was achieved by comparing amount of target nucleic acids of each sample to a standard curve. Standard curves for the targeted nucleic acids of MT1, MT2, and Bax were constructed from serially diluted template (concentration measured at 260 nm). The detailed procedure for absolute quantification method is provided in the link http://www.bio-rad.com/webroot/web/pdf/lsr/literature/Bulletin_5279.pdf. Quantitative real-time-polymerase chain reaction (qRT-PCR) was performed in triplicate on an iCycler IQ Multicolor RT-PCR Detection System (Bio-Rad, Hercules, California) as described previously (Go et al., 2013b). PCR primer sequences for mouse Bax and mouse metallothioneins (MT), MT1 and MT2 are as follows: mouse Bax, forward: 5′-GTG AGC GGC TGC TTG TCT-3′, reverse: 5′-GGT CCC GAA GTA GGA GAG GA-3′; mouse MT1, forward: 5′-ATG GAC CCC AAC TGC TCC TGC TCC ACC-3′, reverse: 5′-GGC ACA GCA CGT GCA CTT GTC CGC-3′; mouse MT2, forward: 5′- ATG GAC CCC AAC TGC TCC TGT GCC-3′, reverse: 5′- GCT GCA CTT GTC GGA AGC CTC TTT-3′.
Statistics
As described above for microarray data analysis, tabularized affymetrix data was generated using RMA processing (Forrest et al., 2005). Limma (Diboun et al., 2006) was used as a univariate test to isolate significant genes and fold change information from the RMA table. These procedures incorporate false discovery rate (FDR) to provide an FDR-corrected P value, with significance taken as P < .05. These results were also validated by PLS-DA as a multivariate approach (VIP ≥ 1.5). π score was generated as a ranking measure of both fold change and significance using the following formula: −log(p) * fold change (Xiao et al., 2014). For TG, DG, glycerophospholipids, sphingomyelin (SM), and fatty acids determined by metabolomics, high-resolution mass spectral data were filtered to include only m/z features where at least 1 group had nonmissing values for 70% of samples. Additionally, features were required to have nonmissing values in 30% of samples overall. Log2 transformation was performed to reduce heteroscedasticity and to normalize the data. Quantile normalization of samples was done to minimize sample variability. Quantile normalization is a normalization procedure that aims to make the distributions of feature intensities similar across all the samples. Limma package in Bioconductor was used to identify differentially expressed features at P < .05. Statistical comparisons of Cd content, qRT-PCR, Oil-Red O staining, JNK activation, conventional lipid analyses, and targeted lipid analyses were carried out using 2 sample t test (independent t test) of the OriginLab (Data Analysis and Graphing software, OriginLab Co.). P < .05 was considered to be significant.
Results
Accumulation of Cd and Increased mRNA Level of MT in Mouse Liver by Low-Level Cd Exposure
A key issue of Cd effects on biological systems is that Cd is not effectively excreted and accumulates in humans (10–35 year half-life) (Authority, 2011; Peters et al., 2010), which could be a potential problem to human health even at low dietary intake levels. To examine the Cd amounts accumulated in mouse liver and whether the liver responded to the Cd treatment, we first analyzed liver tissues for Cd content by ICP-MS and MT mRNA level by qRT-PCR, respectively. Cd measurement in liver showed that the level was substantially higher in the mouse group exposed to Cd (1.6 ± 0.16 ng Cd/mg protein, n = 8) than the control mice group (0.16 ± 0.12 ng Cd/mg protein, n = 8) (Fig. 2A). The Cd amounts were comparable to the levels found in normal human livers (Baker et al., 2002; Yilmaz, 2002). MT including MT1 and MT2 are a family of stress responsive proteins that play a key role in the detoxification of Cd, and an increased MT level is an indication of cellular response to metals such as Cd. Consistently, the data showed that mouse exposed to Cd elevated mRNA levels of both MT1 (Cont,1.3 ± 1.0 pM; Cd, 10.3 ± 3.7 pM) and MT2 (Cont, 0.9 ± 0.6 pM; Cd, 5.3 ± 1.8 pM) in liver (Fig. 2B). Together, these data suggest that Cd level within a range comparable to normal human liver Cd level is sufficient to alter liver expression levels of MT.
FIG. 2.

Elevated levels of Cd and MT in Cd-treated mouse liver. Livers isolated from mouse challenged with Cd (10 mg Cd/l, 16 weeks) or control (Cont, no Cd) by drinking water were measured for Cd content (A) and mRNA levels of MT1 and MT2 (B) by ICP-MS and qRT-PCR, respectively. Results are shown as mean ± SE; n = 6. *P < .05 versus control group (Cont).
Low-Level Oral Cd Exposure Stimulates Lipid Accumulation in Liver by Perturbing Metabolic Pathways for Fatty Acid Biosynthesis/Oxidation Regulation
As shown in Figure 1 and Table 1, transcripts for many genes were altered by Cd (highlighted by green color, Cd-induced fold change > 1.2, P < .05); associated metabolic pathways regulated fatty acid biosynthesis and oxidation and IR. These genes include IL-4, oxisterol-binding protein (Osbp), insulin-induced gene (Insig) 2, phospholipase A (PLA)-2, and PPAR γ coactivator 1α (PGC-1α). We further examined liver sections to examine whether Cd had an effect on lipid accumulation due to dysregulation in lipid and fatty acid metabolisms. Livers collected from mice with or without low-dose Cd were examined for lipid accumulation by performing ORO staining because ORO staining analysis has shown to be the most reliable way to assess liver steatosis (Levene et al., 2010). The results of ORO staining including representative images (Fig. 3A) and quantification on liver sections show that level of lipids in Cd-treated mouse livers (23.9% ± 0.4%) were higher than those in control mice (20.2% ± 0.4%) (Fig. 3B, Cont, number of ORO images = 116, number of sections = 41; Cd, number of ORO images = 127, number of sections = 43). Additional representative ORO-stained sections are provided in Supplementary Material S3. These results show that lipid deposition in liver was elevated by Cd and illustrate that there was variability of fat accumulation in different mice exposed to low levels of Cd (Fig. 3B right, Cd mouse 1, 25.1% ± 0.6%; Cd mouse 2, 25.8% ± 0.6%; Cd mouse 3, 20.8% ±0.5%; Cd mouse 4, 22.8% ± 0.7%; Cd mouse 5, 19.0% ± 0.7%; Cd mouse 6, 30.0% ± 0.8%). Moreover, liver tissues and plasma were analyzed for TGs and DGs (Fig. 4 and Table 2) which are critical markers measured to characterize fatty liver disease. Consistent with ORO staining data, abundance of TG [m/z 945.6967 (RT 111 s), (58:12), (M+H)+ adduct] measured by high-resolution MS (HRM) was greater in Cd-treated mice [4.1 ± 1.1, peak area (×106)] than control group [1.6 ± 0.7, peak area (×106)] (Fig. 4A). DG [m/z 539.467 (RT 154 s), (30:0), (M+H)+ adduct] was also greater in Cd-treated mice group [11.7 ± 4.3, peak area (×106)] than control group [61.6 ± 9.0, peak area (×105)], but this increase was not significant (Fig. 4B). To evaluate indications of inflammation and fibrosis, liver sections were analyzed by hematoxylin and eosin (H & E) staining and Sirius Red staining, respectively. The former showed no evidence of inflammation in the Cd group compared with control mice while the latter showed subtle evidence for fibrosis in terms of increased collagen formation (Supplementary Material S5). Together, these results suggest that low-dose Cd could potentiate fatty liver as a result of metabolic perturbation in lipid synthesis and regulation, but not all mice are affected equally.
TABLE 1.
Microarray-Identified Liver Genes Associated With NAFLD and Significantly Altered in Expression Levels (> 1.2-fold) by Low-Level Cd Treatment (n = 3 for each control and Cd group, P value < .05)
| Name | Symbol | Entrez Gene ID | Fold Change: Cd/CR | P Value | Functional Pathways |
|---|---|---|---|---|---|
| Insulin induced gene 2 | Insig2 | 72999 | 1.2 | .01 | Fatty acid synthesis and lipid metabolism |
| Interleukin 4 | Il4 | 16189 | 1.2 | .01 | |
| Peroxisome proliferative activated receptor, gamma, coactivator 1 alpha | Ppargc1a/PGC-1α | 19017 | 1.2 | .02 | |
| Phospholipase A2, group IIE | phospholipase A2, group IIE | 26970 | −1.2 | .03 | |
| Solute carrier family 2 (facilitated glucose transporter), member 13 | Slc2a13 | 239606 | −1.2 | .04 | |
| Oxysterol binding protein | Osbp | 76303 | 1.2 | 8.9E-04 | |
| BCL2-associated X protein | bax | 12028 | 1.2 | .02 | Cell death and survival |
| Fas apoptotic inhibitory molecule 3 | Faim3 | 69169 | −1.3 | .003 | |
| Fas-associated factor 1 | Faf1 | 14084 | 1.2 | .02 | |
| Fas (TNFRSF6) binding factor 1 | Fbf1 | 217335 | −1.2 | .02 | |
| Serine/threonine protein kinase PAK2 | pak2 | 224105 | 1.2 | .04 | |
| Heat shock protein 27 | hsp27 | 15507 | 1.3 | .04 | |
| Poly [ADP-ribose] polymerase 1 | Parp-1 | 11545 | 1.2 | .02 | |
| eukaryotic translation initiation factor 2A | Eif2a | 229317 | 1.3 | .01 | |
| Androgen receptor | Ar | 11835 | 1.3 | .03 | Hepatocellular carcinoma cell formation |
| adaptor-related protein complex AP-1, sigma 3 | Ap1s3 | 252903 | −1.3 | .04 | |
| Jun oncogene | Jun | 16476 | 1.6 | .04 | |
| Protein kinase C | PKC | 30926 | 1.4 | .04 | |
| NADH dehydrogenase (ubiquinone) 1 alpha subcomplex assembly factor 7 | Ndufaf7 | 73694 | 1.3 | 2.0E-02 | Oxidative phosphorylation |
| NADH dehydrogenase (ubiquinone) 1 beta subcomplex 3 | Ndufb3 | 66495 | 1.2 | 3.9E-02 | |
| NADH dehydrogenase (ubiquinone) Fe-S protein 1 | Ndufs1 | 227197 | 1.2 | 2.0E-02 | |
| NADH dehydrogenase (ubiquinone) 1 beta subcomplex, 5 | Ndufb5 | 66046 | 1.2 | 3.8E-03 | |
| NADH dehydrogenase (ubiquinone) 1 alpha subcomplex, 1 | Ndufa1 | 54405 | 1.2 | .04 | |
| NADH dehydrogenase (ubiquinone) 1 alpha subcomplex, 4-like 2 | Ndufa4l2 | 407790 | −1.3 | 7.4E-03 | |
| Succinate dehydrogenase complex, subunit C, integral membrane protein | Sdhc | 66052 | 1.2 | 3.3E-02 | |
| Succinate dehydrogenase complex assembly factor 2 | Sdhaf2 | 66072 | 1.2 | 2.4E-02 | |
| Succinate-Coenzyme A ligase, GDP-forming, beta subunit | Suclg2 | 20917 | 1.2 | .04 | |
| Succinate dehydrogenase complex, subunit B, iron sulfur (Ip) | Sdhb | 67680 | 1.2 | 2.8E-03 | |
| Cytochrome b5 reductase 4 | Cyb5r4 | 266690 | 1.5 | .04 | |
| Cytochrome b-561 domain containing 2 | Cyb561d2 | 56368 | 1.3 | .02 | |
| Cytochrome c oxidase subunit IV isoform 1 | Cox4i1 | 12857 | 1.2 | 1.3E-02 | |
| Cytochrome c oxidase assembly protein 15 | Cox15 | 226139 | 1.2 | .04 | |
| Cytochrome c oxidase subunit VIc | Cox6c | 12864 | 1.2 | 2.5E-02 | |
| Cytochrome c oxidase subunit VIIa 2 | Cox7a2 | 12866 | 1.2 | 2.5E-02 | |
| Lactate dehydrogenase C | Ldhc | 16833 | −1.6 | 4.0E-03 | |
| ATP synthase, H+ transporting, mitochondrial F1 complex, delta subunit | Atp5d | 66043 | 1.2 | 2.8E-02 | |
| Transforming growth factor, beta receptor I | Tgfbr1 | 21812 | 1.2 | .04 | Fibrosis |
| Derlin-2 | 1.3 | ER-associated protein degradation | |||
| EDEM | 1.2 |
Positive values of fold change indicate Cd-upregualted genes. Negative values of fold change indicate Cd-down regulated genes.
FIG. 3.

Accumulation of lipids in liver of mouse challenged with low-dose Cd. Livers collected from Cd and control (Cont) mice groups were prepared to quantitate lipid accumulation in livers. A, Representative images of lipids stained by ORO in liver sections prepared from Cont and Cd mice. Additional ORO-stained images from Cont and Cd mice are provided in Supplementary Material S4. Quantitation of ORO-stained lipid intensity (% area per image) using NIH image J software is shown by histogram (B left, P = .09), box plot (B middle), and bar graph (B right). Number of image: 116 (cont), 127 (Cd), number of section: 41(cont), 43 (Cd). *P < .05 versus control group [number of section; 8 (Cd mouse1), 8 (Cd mouse 2), 7 (Cd mouse 3), 8 (Cd mouse 4), 6 (Cd mouse 5), 6 (Cd mouse 6), 41 (cont)].
FIG. 4.

Low-dose Cd elevated liver enzymes and plasma lipids. Metabolomics of liver tissues (respective to 250 µg protein) were performed using HRM. Metabolites corresponding to TG (A, E) and DG (B, F) were identified based on mass to charge (m/z) and retention time (RT) by searching Metlin software (https://metlin.scripps.edu/metabo_search_alt2.php). Bar graphs show amount of TG and DG in liver tissue and plasma quantified from intensity of respective peak spectrum. The data are shown as mean ± SE; n = 8. *P < .05 versus control group (Cont). Plasma collected from control and Cd mice groups were analyzed for liver enzymes, alanine aminotransferase (ALT, C) and aspartate aminotransferase (AST, D). Plasma levels of these enzymes were quantified by measuring enzyme activity (box plots). The data are shown as mean ± SE; n = 8. *P < .05 versus control group (Cont).
TABLE 2.
HRM-Identified Liver and Plasma Lipid Species That Are Significantly Higher in Abundance by Low-Dose Cd
| Lipids, Fatty Acid | Name | m/z | RT (s) | Fold Increase(Cd/cont) | |
|---|---|---|---|---|---|
| DG | DG (36:0) | 625.5765 | 77 | 2.7 | Plasma |
| Fatty acid | Octadecatetraenoic acid | 277.2168 | 581 | 1.6 | Liver |
| Octadecatrienoic acid | 325.2019 | 556 | 2.0 | Liver | |
| 3-Oxotetradecanoic acid glycerides | 334.2349 | 157 | 1.9 | Plasma | |
| Glycerophospholipids | LysoPE (22:5) | 550.2935 | 135 | 1.6 | Liver |
| PC (38:8) | 802.5381 | 54 | 1.6 | Liver | |
| PE (46:1) | 886.7259 | 70 | 3.1 | Liver | |
| PE (20:0) | 524.3395 | 97 | 1.8 | Plasma | |
| PG (40:5) | 825.5640 | 50 | 1.7 | Liver | |
| PI (38:6) | 883.5336 | 581 | 1.6 | Liver | |
| PI (30:1) | 781.4916 | 77 | 2.1 | Plasma | |
| PS (36:4) | 784.5153 | 136 | 1.6 | Liver | |
| Sphingolipid | SM (32:1) | 675.5436 | 59 | 5.6 | Plasma |
| TG | TG (58:12) | 945.6967 | 111 | 2.5 | Liver |
| TG (62:0) | 1003.9627 | 163 | 1.6 | Liver | |
| TG (64:15) | 1023.7436 | 268 | 5.4 | Plasma |
PE, phosphoethanolamine; PC, phosphatidylcholine; PG, phsphatidylglycerol; PI, phosphatidylinositol; PS, phosphatidylserine; SM, sphingomyelin. P < .05.
Following the results of increased accumulation of lipids in liver, we further examined Cd effect on liver function by measuring the activities of the liver enzymes, ALT and AST in plasma. As shown in Figure 4, both ALT [871.5 ± 66 (Cont); 961.3 ± 34.6 (Cd), n = 9, Fig. 4C] and AST [0.4 ± 0.06 (Cont); 0.6 ± 0.03 (Cd), n = 9, Fig. 4D] levels were greater in plasma of Cd-treated mouse group than control group, suggesting that liver function could have been affected by Cd exposure. Using the same plasma samples, we measured TG and DG levels using HRM. Consistent with liver tissue data, plasma TG [m/z 1023.7436 (RT 268 s), (22:6/22:6/22:6), (M+H)+ adduct] and DG [m/z 625.5766 (RT 77 s), (18:0/18:0/0:0), (M+H)+ adduct] were also increased (P < .05; FDR < 0.2) in Cd-treated mice [Fig. 4E, TG, Cont, 3.8 ± 2.2 (×106); Cd, 26.0 ± 10.9 (×106) and Fig. 4F, DG, Cont, 3.5 ± 2.3 (×105); Cd, 9.4 ± 1.9 (×105)]. Note that the accurate mass is consistent with multiple isobaric TG. And this is the same for the DG. Additionally, the data of plasma total cholesterol, TG, high density lipoprotein (HDL) and low density lipoprotein (LDL) levels measured by conventional enzymatic methods (Beckman AU480 chemistry analyzer) showed that cholesterol (cont, 860.8 ± 100.7 mg/l; Cd, 960.3 ± 130.4 mg/l) and TG (cont, 600.7 ±30.8 mg/l; Cd, 720.0 ± 60.6 mg/l) levels were higher in Cd-treated mice while HDL level (cont, 520.7 ± 60.9 mg/l; Cd, 480.1 ±50.1 mg/l) was lower in Cd-treated mice compared with control. Moreover, to evaluate low-dose Cd effects on other lipid categories, metabolomics data were further analyzed for glycerophospholipids, sphingolipids and fatty acids. Table 2 shows significantly increased species of phosphatidylcholine, phosphatidylethanolamine, phosphatidylglycerol, phosphatidylinositol, phosphatidylserine, SM, and fatty acids (octadecatertraenoic acid, octadecatrienoic acid, 3-oxotetradecanoic acid glycerides) by Cd. Together, these data support the conclusion that low-dose Cd disrupts lipid metabolism.
Low-Level Cd Exposure Affects Liver Cell Survival and Death Regulatory Metabolism
In addition to metabolic disruption in lipid regulatory metabolism, more severe fatty liver is associated with perturbation in cell survival and death regulatory pathways. Figure 1 includes Cd-affected significant genes that are involved in cell death/survival regulatory pathway (see Table 1 for the details and also Supplementary Material S1 for all significantly altered genes by Cd). These genes include adaptor-related protein complex (AP)-1, jun oncogene (Jun), Fas-associated factor-1, Fas binding factor-1, Fas apoptotic inhibitory molecule (Faim)-3 (see Table 1 for the data on gene expression). To confirm Cd effects on cell death and survival pathway, mRNA levels of the apoptosis regulator Bax (Bcl2-associated X protein) was examined in liver tissues by qRT-PCR (Fig. 5A). The result showed that mRNA level of Bax was increased by Cd (Cont, 1.4 ± 0.4 pM; Cd, 2.6 ± 0.3 pM) supporting gene array data of elevated Bax gene expression by Cd. Consistent with this finding, gene array result of Akt oncogene involved in cell survival and proliferation pathway showed that Cd suppressed Akt gene expression significantly (Fig. 5B). We further examined Cd effect on cell death/survival using hepatocytes HepG2 cells. Because activation of JNK is a key marker of cell death signaling, HepG2 hepatocytes treated with low-dose Cd were examined for JNK phosphorylation as a measure of JNK activation. Cd at low dose (< 0.1 µM) stimulated phosphorylation of JNK (Fig. 5C top) while basal level of Akt phosphorylation was decreased (Fig. 5C bottom), suggesting that Cd stimulates hepatocyte cell death signaling. Se, an essential nutritional metal in mammalian species, plays an important role in maintaining selenoenzyme function and has a protective role against Cd-induced toxicity. Cd-induced phosphorylation of JNK (250% ± 24%, without Se) was significantly inhibited by Se in a dose-dependent manner (0.05 µM Se, 270 ± 28%; 0.1 µM Se, 170% ± 25%, 0.5 µM Se, 130% ± 18%, Fig. 5D). Together, mouse and cell data show that low-dose Cd has a stimulatory role in cell death signaling pathways.
FIG. 5.

Low-level Cd stimulated cell death pathway. Message levels of bax in liver tissues from control and Cd mice were quantified by qRT-PCR (A). Akt gene expression level was calculated from Affymetrics gene array data (see methods) shown as % control (B). HepG2 hepatocytes treated with indicated amounts of Cd for 2 h were lysed and analyzed for phosphorylation of JNK and Akt by Western blotting (C). The bands on the Western blot corresponding to phospho-JNK (p-JNK) and phosphor-Akt (p-Akt) were shown after probing blots with antibodies specific to phosphorylated form of JNK1/2 and phosphorylated form of Akt (Ser 473), respectively. Subsets of HepG2 cells were pretreated with Se for 1 h prior to Cd exposure at 0.1 µM for 2 h (D). Intensities of p-JNK bands were quantified by the method described in the previous study [D, (Go et al., 2013b)]. The data are shown as % of control (0.1 µM Cd without Se) ± SE; n = 3. *P < .05 versus control group (0.1 µM Cd without Se).
Low-Dose Cd Exposure Disrupts the Mitochondrial Oxidative Phosphorylation Pathway
Our previous study showed that mitochondrial proteins and metabolites were targets modified by Cd exposure (Go et al., 2014). MetaCore pathway analysis of Cd-increased mRNA showed that mitochondrial oxidative phosphorylation was the most significant pathway affected by low dose Cd (P = 1.4e-3). Cd increased mRNA for 9 genes in the electron transport system (Fig. 6) including complex I (NADH dehydrogenase [ubiquinone]; NDUFB3, NDUB5, NDUFA1, NDUFS1), complex II (succinate dehydrogenase; SDHC-c, SDHAF2), complex IV (cytochrome c oxidase subunit; COX 6c, COX 7A2), and complex V [ATP synthase ATP5D]. The detailed information of Cd effects on these genes is provided in Table 1. Together with ER stress, disruption in oxidative phosphorylation has been previously identified (Caraceni et al., 2004; Wei et al., 2008) as a key factor contributing to NAFLD (Fig. 1).
FIG. 6.
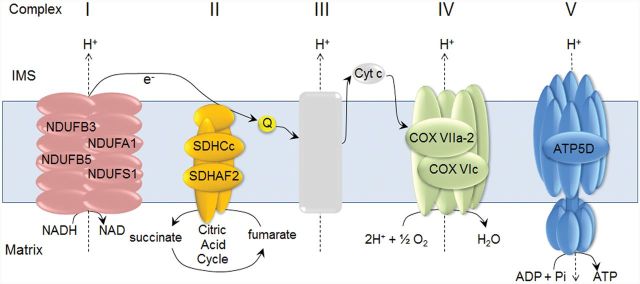
Cd-elevated genes associated with mitochondrial oxidative phosphorylation pathway that occurs in electron transport system. Lists of liver genes increased by Cd (1.2-fold or greater than control, P < .05) and composed of complex I (NDUFB3, NDUFB5, NDUFA1, NDUFS1), II (SDHC-c, SDHAF2), IV (COX VIIa-2, COX Vic), and V (ATP5D) are indicated. The detailed information of these genes is provided in Table 1.
DISCUSSION
In this study, we used mouse liver tissue to analyze genes, metabolites and associated metabolic pathways that were significantly affected by low-dose Cd exposure. The results demonstrated that in this mouse model for environmental low-level Cd exposure, several measures of liver function were altered, eg, fatty acid biosynthesis/oxidation, cell survival/death signaling, and mitochondrial oxidative phosphorylation. These metabolic alterations in liver were associated with increased lipids measured by metabolomics, a trend toward fat accumulation by ORO staining, and changes in gene expression indicative of inflammation, cell cycle interruption, and further hepatocellular damage. These abnormal characteristics are the same as found in humans with NAFLD and therefore indicate that low-level Cd causes fatty liver disease in this mouse model. Importantly, these studies were performed in male mice. Female humans accumulate Cd to a greater extent than males, so these results emphasize the importance of comparable studies in female mice to test whether females are more susceptible to low-dose Cd.
Body weight or food consumption during this study was not characterized; however, Thijssen et al. (2007b) reported no significant changes to body weight in a matching exposure model (sustained exposure via drinking water for up to 6 months) at doses of CdCl2 < 100 mg/l, 10-fold higher than the dose used in study described here. Food consumption was also monitored in the Thijssen study, and no significant changes were reported. Furthermore, Cd treatment did not affect water consumption. Therefore we would not expect changes in our present study to be due to Cd-induced perturbations of eating and drinking. Our measurements showed that plasma glucose was not significantly different between groups (cont, 7.6 ± 1.0 g/l; Cd, 7.2 ± 1.7 g/l), but more specific studies using a homeostasis model assessment of IR are needed to address possible effects on IR. Also, there is a need to systematically address potential effects of age, high-fat diet and adiposity.
Gene expression array data (Supplementary Material S1) showed that 595 genes were increased (1.2-fold or greater, P < .05) and 1217 genes were decreased (1.2-fold or greater, P < .05) by Cd compared with control. Pathway analysis performed on Cd-elevated genes identified critical pathways associated with fatty liver disease, eg, oxidative phosphorylation, apoptosis and survival associated with ER stress response and FAS signaling cascades, and immune response associated with IL-1 signaling. The top 10 networks and associated genes (Supplementary Material S2) suggest that low-dose Cd stimulates proinflammatory and pro-cell death pathways that could contribute to more advanced fatty liver disease, NASH. In addition to mitochondrial oxidative phosphorylation pathway, ER stress response leading to cell death signaling pathway was also significantly affected by Cd involving increased levels of genes related to protein degradation (P = 1.7e-3, Supplementary Material S2). As indicated previously (Chen et al., 2015; Du et al., 2014; Muthukumar and Nachiappan, 2013), Cd-stimulated ER-stress-dependent dysregulation of lipid metabolism leading to dyslipidemia, IR, and increased oxidative stress could contribute to NAFLD (Fig. 1). Pathway analysis on Cd-decreased 1217 genes identified diverse pathways associated with neuronal function, development, cytoskeleton remodeling, immune response, and proteolysis (Supplementary Material S3), suggesting that low-level Cd could impact multiple other biological metabolic processes and functions.
In a previous study of high dose (20–50 µM) Cd-induced renal epithelial toxicity (Liu et al., 2007), pretreatment with Se (10–30 µM) significantly prevented cell death by inhibiting Cd-stimulated JNK phosphorylation. Although this was a cytotoxic condition induced by high dose Cd, a protective role of Se in JNK phosphorylation and cell death signaling was similar to the finding of this study of low-dose Cd effects. The protective mechanism of Se against low-dose Cd-induced metabolic disruptions associated with fatty liver needs to be further examined. Because both Cd and Se are bound to cysteine residues, kinetic studies for low level of Cd effects on Se-containing antioxidants such as thioredoxin reductases, glutathione peroxidases, and methionine sulfoxide reductases will provide critical information to improve our understanding of low-dose Cd-induced alterations in protein redox state, metabolites, and gene expression and potential interactions with Se.
In summary, the present findings show that oral Cd exposure of mice which produces liver concentrations similar to those found in humans from dietary exposures produced histopathological and molecular changes in liver which were consistent with fatty liver disease. As presented in Figure 1 and Table 1 with major common metabolic pathways contributing to NAFLD, it appears that NAFLD is a result from combination of metabolic dysregulation involving (1) fatty acid biosynthesis and lipid metabolism, (2) cell death and survival, and (3) ER stress and oxidative phosphorylation. The relatively large number of genes and lipid metabolites of NAFLD-associated pathways altered by low-level Cd exposure suggest that appropriate strategy in prevention and therapy for NAFLD may require targeting functional networks rather than individual genes, proteins or metabolites.
FUNDING
This work was supported by National Institutes of Health grants ES023485, ES025632, HL113451, AG038746, DK062092, and OD018006, and Veterans Affairs grant BX001746-01.
SUPPLEMENTARY DATA
Supplementary data are available online at http://toxsci.oxfordjournals.org/.
ACKNOWLEDGEMENTS
Drs. Go and Jones are co-corresponding authors.
Supplementary Material
REFERENCES
- Adams L. A., Lymp J. F., St Sauver J., Sanderson S. O., Lindor K. D., Feldstein A., Angulo P. (2005). The natural history of nonalcoholic fatty liver disease: a population-based cohort study. Gastroenterology 129, 113–121. [DOI] [PubMed] [Google Scholar]
- ATSDR. (2012). Toxicological profile for cadmium. In (U. S. D. O. H. A. H. SERVICES, Eds.). ATSDR, Division of Toxicology and Human Health Sciences, Atlanta. [PubMed] [Google Scholar]
- Baker J. R., Satarug S., Urbenjapol S., Edwards R. J., Williams D. J., Moore M. R., Reilly P. E. (2002). Associations between human liver and kidney cadmium content and immunochemically detected CYP4A11 apoprotein. Biochem. Pharmacol. 63, 693–696. [DOI] [PubMed] [Google Scholar]
- Basseri S., Austin R. C. (2012). Endoplasmic reticulum stress and lipid metabolism: mechanisms and therapeutic potential. Biochem. Res. Int. 2012, 841362. [DOI] [PMC free article] [PubMed] [Google Scholar]
- Bertolotti M., Lonardo A., Mussi C., Baldelli E., Pellegrini E., Ballestri S., Romagnoli D., Loria P. (2014). Nonalcoholic fatty liver disease and aging: epidemiology to management. World J. Gastroenterol. 20, 14185–14204. [DOI] [PMC free article] [PubMed] [Google Scholar]
- Caraceni P., Bianchi C., Domenicali M., Maria Pertosa A., Maiolini E., Parenti Castelli G., Nardo B., Trevisani F., Lenaz G., Bernardi M. (2004). Impairment of mitochondrial oxidative phosphorylation in rat fatty liver exposed to preservation-reperfusion injury. J. Hepatol. 41, 82–88. [DOI] [PubMed] [Google Scholar]
- Caudill S. P., Schleicher R. L., Pirkle J. L. (2008). Multi-rule quality control for the age-related eye disease study. Stat. Med. 27, 4094–4106. [DOI] [PubMed] [Google Scholar]
- Cave M., Deaciuc I., Mendez C., Song Z., Joshi-Barve S., Barve S., McClain C. (2007). Nonalcoholic fatty liver disease: predisposing factors and the role of nutrition. J. Nutr. Biochem. 18, 184–195. [DOI] [PubMed] [Google Scholar]
- Chen C. H., Huang M. H., Yang J. C., Nien C. K., Yang C. C., Yeh Y. H., Yueh S. K. (2006). Prevalence and risk factors of nonalcoholic fatty liver disease in an adult population of taiwan: metabolic significance of nonalcoholic fatty liver disease in nonobese adults. J. Clin. Gastroenterol. 40, 745–752. [DOI] [PubMed] [Google Scholar]
- Chen C. Y., Zhang S. L., Liu Z. Y., Tian Y., Sun Q. (2015). Cadmium toxicity induces ER stress and apoptosis via impairing energy homeostasis in cardiomyocytes. Biosci. Rep. doi: 10.1042/BSR20140170. [DOI] [PMC free article] [PubMed] [Google Scholar]
- Diboun I., Wernisch L., Orengo C. A., Koltzenburg M. (2006). Microarray analysis after RNA amplification can detect pronounced differences in gene expression using limma. BMC Genomics 7, 252. [DOI] [PMC free article] [PubMed] [Google Scholar]
- Du K., Takahashi T., Kuge S., Naganuma A., Hwang G. W. (2014). FBXO6 attenuates cadmium toxicity in HEK293 cells by inhibiting ER stress and JNK activation. J. Toxicol. Sci. 39, 861–866. [DOI] [PubMed] [Google Scholar]
- European Food Safety Authority (2011). Statement on tolerable weekly intake for cadmium. EFSA J. 9, 1975. [Google Scholar]
- Fischer A. H., Jacobson K. A., Rose J., Zeller R. (2008). Hematoxylin and eosin staining of tissue and cell sections. CSH Protoc. 2008, pdb prot4986. [DOI] [PubMed] [Google Scholar]
- Forrest M. S., Lan Q., Hubbard A. E., Zhang L., Vermeulen R., Zhao X., Li G., Wu Y. Y., Shen M., Yin S., et al. (2005). Discovery of novel biomarkers by microarray analysis of peripheral blood mononuclear cell gene expression in benzene-exposed workers. Environ. Health Perspect. 113, 801–807. [DOI] [PMC free article] [PubMed] [Google Scholar]
- Go Y. M., Kim C. W., Walker D. I., Kang D. W., Kumar S., Orr M., Uppal K., Quyyumi A. A., Jo H., Jones D. P. (2015a). Disturbed flow induces systemic changes in metabolites in mouse plasma: a metabolomics study using ApoE(-)/(-) mice with partial carotid ligation. Am. J. Physiol. Regul. Integr. Comp. Physiol. 308, R62–R72. [DOI] [PMC free article] [PubMed] [Google Scholar]
- Go Y. M., Orr M., Jones D. P. (2013a). Actin cytoskeleton redox proteome oxidation by cadmium. Am. J. Physiol. Lung Cell. Mol. Physiol. 305, L831–843. [DOI] [PMC free article] [PubMed] [Google Scholar]
- Go Y. M., Orr M., Jones D. P. (2013b). Increased nuclear thioredoxin-1 potentiates cadmium-induced cytotoxicity. Toxicol. Sci. 131, 84–94. [DOI] [PMC free article] [PubMed] [Google Scholar]
- Go Y. M., Roede J. R., Orr M., Liang Y., Jones D. P. (2014). Integrated redox proteomics and metabolomics of mitochondria to identify mechanisms of cd toxicity. Toxicol. Sci. 139, 59–73. [DOI] [PMC free article] [PubMed] [Google Scholar]
- Go Y. M., Walker D. I., Soltow Q. A., Uppal K., Wachtman L. M., Strobel F. H., Pennell K., Promislow D. E., Jones D. P. (2015b). Metabolome-wide association study of phenylalanine in plasma of common marmosets. Amino Acids 47, 589–601. [DOI] [PMC free article] [PubMed] [Google Scholar]
- Goyer R. A. (1997). Toxic and essential metal interactions. Ann. Rev. Nutr. 17, 37–50. [DOI] [PubMed] [Google Scholar]
- Hamaguchi M., Kojima T., Ohbora A., Takeda N., Fukui M., Kato T. (2012). Aging is a risk factor of nonalcoholic fatty liver disease in premenopausal women. World J. Gastroenterol. 18, 237–243. [DOI] [PMC free article] [PubMed] [Google Scholar]
- Hyder O., Chung M., Cosgrove D., Herman J. M., Li Z., Firoozmand A., Gurakar A., Koteish A., Pawlik T. M. (2013). Cadmium exposure and liver disease among US adults. J. Gastrointest. Surg. 17, 1265–1273. [DOI] [PMC free article] [PubMed] [Google Scholar]
- Kim H. J., Lee K. E., Kim D. J., Kim S. K., Ahn C. W., Lim S. K., Kim K. R., Lee H. C., Huh K. B., Cha B. S. (2004). Metabolic significance of nonalcoholic fatty liver disease in nonobese, nondiabetic adults. Arch. Intern. Med. 164, 2169–2175. [DOI] [PubMed] [Google Scholar]
- Lazo M., Hernaez R., Eberhardt M. S., Bonekamp S., Kamel I., Guallar E., Koteish A., Brancati F. L., Clark J. M. (2013). Prevalence of nonalcoholic fatty liver disease in the United States: the Third National Health and Nutrition Examination Survey, 1988-1994. Am. J. Epidemiol. 178, 38–45. [DOI] [PMC free article] [PubMed] [Google Scholar]
- Levene A. P., Kudo H., Thursz M. R., Anstee Q. M., Goldin R. D. (2010). Is oil red-O staining and digital image analysis the gold standard for quantifying steatosis in the liver? Hepatology. 51, 1859; author reply 1859-1860. [DOI] [PubMed] [Google Scholar]
- Liu Y., Zhang S. P., Cai Y. Q. (2007). Cytoprotective effects of selenium on cadmium-induced LLC-PK1 cells apoptosis by activating JNK pathway. Toxicol. in vitro 21, 677–684. [DOI] [PubMed] [Google Scholar]
- Mehlem A., Hagberg C. E., Muhl L., Eriksson U., Falkevall A. (2013). Imaging of neutral lipids by oil red O for analyzing the metabolic status in health and disease. Nat. Protoc. 8, 1149–1154. [DOI] [PubMed] [Google Scholar]
- Min H. K., Kapoor A., Fuchs M., Mirshahi F., Zhou H., Maher J., Kellum J., Warnick R., Contos M. J., Sanyal A. J. (2012). Increased hepatic synthesis and dysregulation of cholesterol metabolism is associated with the severity of nonalcoholic fatty liver disease. Cell Metab. 15, 665–674. [DOI] [PMC free article] [PubMed] [Google Scholar]
- Muthukumar K., Nachiappan V. (2013). Phosphatidylethanolamine from phosphatidylserine decarboxylase2 is essential for autophagy under cadmium stress in Saccharomyces cerevisiae. Cell Biochem. Biophys. 67, 1353–1363. [DOI] [PubMed] [Google Scholar]
- Nordberg G. F., Kjellström T., Nordberg M. (1985). Kinetics and metabolism. CRC Press, Florida. [Google Scholar]
- Olsson I. M., Bensryd I., Lundh T., Ottosson H., Skerfving S., Oskarsson A. (2002). Cadmium in blood and urine—impact of sex, age, dietary intake, iron status, and former smoking—association of renal effects. Environ. Health Perspect. 110, 1185–1190. [DOI] [PMC free article] [PubMed] [Google Scholar]
- Peters J. L., Perlstein T. S., Perry M. J., McNeely E., Weuve J. (2010). Cadmium exposure in association with history of stroke and heart failure. Environ. Res. 110, 199–206. [DOI] [PMC free article] [PubMed] [Google Scholar]
- Ruhl C. E., Everhart J. E. (2015). Fatty liver indices in the multiethnic United States National Health and Nutrition Examination Survey. Aliment. Pharmacol. Ther. 41, 65–76. [DOI] [PubMed] [Google Scholar]
- Ruiz P., Mumtaz M., Osterloh J., Fisher J., Fowler B. A. (2010). Interpreting NHANES biomonitoring data, cadmium. Toxicol. Lett. 198, 44–48. [DOI] [PubMed] [Google Scholar]
- Thijssen S., Cuypers A., Maringwa J., Smeets K., Horemans N., Lambrichts I., Van Kerkhove E. (2007a). Low cadmium exposure triggers a biphasic oxidative stress response in mice kidneys. Toxicology 236, 29–41. [DOI] [PubMed] [Google Scholar]
- Thijssen S., Maringwa J., Faes C., Lambrichts I., Van Kerkhove E. (2007b). Chronic exposure of mice to environmentally relevant, low doses of cadmium leads to early renal damage, not predicted by blood or urine cadmium levels. Toxicology 229, 145–156. [DOI] [PubMed] [Google Scholar]
- Tiran B., Karpf E., Tiran A. (1995). Age dependency of selenium and cadmium content in human liver, kidney, and thyroid. Arch. Environ. Health 50, 242–246. [DOI] [PubMed] [Google Scholar]
- Uppal K., Soltow Q. A., Strobel F. H., Pittard W. S., Gernert K. M., Yu T., Jones D. P. (2013). xMSanalyzer: automated pipeline for improved feature detection and downstream analysis of large-scale, non-targeted metabolomics data. BMC Bioinformatics 14, 15. [DOI] [PMC free article] [PubMed] [Google Scholar]
- Wei Y., Rector R. S., Thyfault J. P., Ibdah J. A. (2008). Nonalcoholic fatty liver disease and mitochondrial dysfunction. World J. Gastroenterol. 14, 193–199. [DOI] [PMC free article] [PubMed] [Google Scholar]
- Welsh J. A., Karpen S., Vos M. B. (2013). Increasing prevalence of nonalcoholic fatty liver disease among United States adolescents, 1988-1994 to 2007-2010. J. Pediatr. 162, 496–500 e491. [DOI] [PMC free article] [PubMed] [Google Scholar]
- Williams C. D., Stengel J., Asike M. I., Torres D. M., Shaw J., Contreras M., Landt C. L., Harrison S. A. (2011). Prevalence of nonalcoholic fatty liver disease and nonalcoholic steatohepatitis among a largely middle-aged population utilizing ultrasound and liver biopsy: a prospective study. Gastroenterology 140, 124–131. [DOI] [PubMed] [Google Scholar]
- Xiao Y., Hsiao T. H., Suresh U., Chen H. I., Wu X., Wolf S. E., Chen Y. (2014). A novel significance score for gene selection and ranking. Bioinformatics 30, 801–807. [DOI] [PMC free article] [PubMed] [Google Scholar]
- Yilmaz O. (2002). Cadmium and lead levels in human liver and kidney samples obtained from Bursa Province. Int. J. Environ. Health Res. 12, 181–185. [DOI] [PubMed] [Google Scholar]
Associated Data
This section collects any data citations, data availability statements, or supplementary materials included in this article.