

Background: Brown fat functions to dissipate energy through adaptive thermogenesis.
Results: The histone demethylase UTX positively regulates brown fat thermogenic program.
Conclusion: UTX is a key determinant of brown fat gene expression.
Significance: UTX may serve as a novel therapeutic target for enhancing brown fat function in the treatment of obesity.
Keywords: adipocyte, epigenetics, histone demethylase, obesity, uncoupling protein, H3K27, UCP1, UTX, brown adipocytes
Abstract
Brown adipocytes function to dissipate energy as heat through adaptive thermogenesis. Understanding the molecular mechanisms underlying the brown fat thermogenic program may provide insights for the development of therapeutic approaches in the treatment of obesity. Most studies investigating the mechanisms underlying brown fat development focus on genetic mechanisms; little is known about the epigenetic mechanisms in this process. We have discovered that ubiquitously transcribed tetratricopeptide repeat on chromosome X (UTX), a histone demethylase for di- or tri-methylated histone 3 lysine 27 (H3K27me2/3), plays a potential role in regulating brown adipocyte thermogenic program. We found that UTX is up-regulated during brown adipocyte differentiation and by cold exposure in both brown adipose tissue (BAT) and white adipose tissue (WAT) of mice, suggesting a potential role in thermogenesis. Inactivation of UTX down-regulates brown fat specific gene expression, while overexpression of UTX does the opposite. Notably, activation of β adrenergic signaling recruits UTX to the UCP1 and PGC1α promoters, leading to decreased H3K27me3, a histone transcriptional repressive mark. UTX demethylates H3K27me3 and subsequently interacts with the histone acetyltransferase (HAT) protein CBP, resulting in increased H3K27 acetylation (H3K27ac), a histone transcriptional active mark. UTX positively regulate brown adipocyte thermogenic program through coordinated control of demethylating H3K27me3 and acetylating H3K27, switching the transcriptional repressive state to the transcriptional active state at the promoters of UCP1 and PGC1α. We conclude that UTX may play a potential role in regulation of brown adipocyte gene expression and may mediate β adrenergic activation of brown fat function.
Introduction
Obesity is a disorder of energy homeostasis due to a chronic imbalance between energy intake and energy expenditure (1). Energy expenditure can be divided into three principal components: obligatory energy expenditure required for cells and organs to maintain physiological functions, energy expenditure caused by physical activity, and energy expenditure resulting from adaptive thermogenesis (2). In rodents, brown/beige adipocytes function to combat obesity via their abilities to generate adaptive thermogenesis, defined as energy dissipated as a heat instead of being captured in ATP in response to environment temperature and diet (3–5). The ability of brown/beige adipocytes to produce adaptive thermogenesis depends on the unique expression of UCP1 in the inner mitochondrial membrane, which serves to uncouple oxidative phosphorylation from ATP synthesis, thereby profoundly increasing energy expenditure (6, 7). Activation of thermogenesis genetically by overexpressing UCP1 in white adipose tissue (WAT)4 relieves obesity and metabolic disorders in obese animal models (8, 9), whereas ablation of UCP1 in mice housed under thermoneutral temperature results in obesity (4). Recent reports demonstrate that adult humans also possess metabolic active brown fat; the amount of brown fat is inversely correlated with body weight but positively correlated with energy expenditure (10–12). This important discovery provides new insight into the mechanisms regulating energy homeostasis in adult humans and suggests that increasing functional brown/beige adipocytes in humans is a novel and promising target in treating obesity.
Although the genome is fixed and identical in all cells, the epigenome, the combination of all genome-wide DNA and chromatin modifications, is continuously modified in response to developmental, environmental, physiological and pathological cues (13). Epigenetic modifications, including DNA methylation, histone acetylation, and methylation, result in organization of the chromatin structure on different hierarchal levels, which regulate gene expression (14). In the case of histone lysine methylation, this involves the transfer of up to three methyl groups from S-adenosylmethionine to create mono-, di-, and trimethylation at the lysine residues (15). Major lysine modifications are limited to histone H3 at multiple residues (H3K4, H3K9, H3K27, H3K36, and H3K79), and a single site on H4 (H4K20) (15). The methylation of lysine residues results in different biological outcomes depending on the lysine position and whether it is mono-, di-, or trimethylated (15). The hallmark of transcriptional active genes is trimethylated histone H3 lysine4 H3K4 (H3K4me3) in the promoter region and H3K36 (H3K36me3) across the gene body, whereas trimethylated H3K27 (H3K27me3) seems to be central for gene repression when present across the gene body and flanking regions (15).
Most complex diseases, including obesity, diabetes, cardiovascular disease, and cancer, are results of gene and environment interactions. One of the mechanisms that environmental factors such as diets affect gene expression patterns involves their capacity to reprogram the epigenome (16, 17). Evidence converges to suggest that epigenetic events figure prominently in the development of obesity and diabetes (18–22). This is a new emerging research area; however, much remains to be discovered on how epigenetic mechanisms regulate metabolism and energy homeostasis.
To identify functional epigenetic marks that regulate brown fat development and function, we knocked down most enzymes that catalyze histone methylation and acetylation, including histone methyltransferases and demethylases and used UCP1 expression as a readout in brown adipocytes BAT1. BAT1 cells are brown preadipocytes that are immortalized from primarily cultured brown preadipocytes and exhibit a typical brown adipocyte phenotype and function with a robust UCP1 expression after differentiation (23, 24) (Fig. 1). We identified a number of histone enzymes that affect UCP1 expression (data will be reported elsewhere), one of which is ubiquitously transcribed tetratricopeptide repeat on chromosome X (UTX). UTX is a histone H3K27-specific demethylase that preferentially demethylates tri-methylated H3K27 and therefore relieves its ability to silence the genes, leading to activation of the gene transcription (25, 26). H3K27 methylation (H3K27me) has been implicated in the regulation of development of a number of cell types (27–30). In this study, we first determined the expression of UTX during the brown adipocyte differentiation in vitro and in response to sympathetic activation via cold exposure in vivo. We then determined the role of UTX regulating the thermogenic program in brown adipocytes and examined the underlying mechanism responsible for UTX action. We particularly examined the methylation of H3K27 at UCP1 and PGC1 promoter/enhancer regions and the interaction among key molecules responsible for the methylation and acetylation of H3K27, including polycomb repressive complex 2 (PRC2) and CREB-binding protein (CBP).
FIGURE 1.

UTX expression is elevated in brown adipocyte differentiation. A–C, establishment of BAT1 brown adipocytes. A, Oil Red O staining of Day 8 (D8) BAT1 adipocytes (right panel) and Day 0 (D0) preadipocytes. UCP1 mRNA (B) and protein (C) levels are induced during the course of BAT1 adipogenesis. UTX mRNA (D) and protein (E) levels are also increased during the course of BAT1 adipogenesis, while UTX expression exhibits no significant changes during 3T3-L1 differentiation (F). Oil Red O staining was performed as described under “Experimental Procedures.” mRNA and protein levels were measured by quantitative RT-PCR and immunoblotting, respectively. All data are expressed as mean ± S.E., n = 4; *, p < 0.05 versus Day 0 (D0) control.
Experimental Procedures
Animals
All animal procedures were approved by the Institutional Animal Care and Use Committee at Georgia State University. For diet-induced obesity studies, 6-week-old male C57BL/6J mice were purchased from the Jackson Laboratory (Bar Harbor, ME) and were fed either a chow (Research Diets D12450B, 10% kcal from fat, Research Diets Inc., New Brunswick, NJ) or high fat diet (HF) (Research Diets D12492, 60% calorie from fat, Research Diets Inc.) for 12 weeks. For cold exposure studies, 6-week-old male A/J mice purchased from the Jackson Laboratory were housed in 4 °C or room temperature for 0 h, 6 h, and 7 day. All mice were euthanized to harvest interscapular brown adipose tissue (BAT) and WAT for gene expression or immunohistochemistry (IHC). Immunohistochemical staining of UCP1 or UTX protein in adipose tissue was conducted as we previously described (31).
Cell Culture
All cells were maintained at 37 °C with 5% CO2. Immortalized brown preadipocyte cell line BAT1 (obtained from Dr. Patrick Seale) was cultured in DMEM/F12 containing 10% FBS and 1% penicillin/streptomycin. BAT1 cells were differentiated as previously described (32). Briefly, BAT1 cells were grown into 90% confluence in growth medium and were then induced to differentiate with a differentiation medium containing 20 nm insulin, 1 nm T3, 125 μm indomethacin, 500 μm isobutylmethylxanthine (IBMX), and 0.5 μm dexamethasone. After 2 days of culture, cells were changed to a maintenance medium containing 20 nm insulin and 1 nm T3. To induce the thermogenic program, BAT1 adipocytes were treated with 1 μm Isop for 3 h.
Mitochondrial Membrane Potential Measurement, Triglyceride (TG) Content, and Lipolysis
Mitochondrial membrane potential was measured using a TMRE Mitochondrial Membrane Potential Kit according to the manufacturer's instruction (Abcam, Cambridge, MA). Briefly, BAT1 cells with UTX overexpression were incubated with tetramethylrhodamine (TMRE,1 μm) for 20 min and then washed with PBS for three times. The fluorescence intensity was detected using a Perkin Elmer VICTOR 3 plate reader (Perkin Elmer, Waltham, MA) with excitation 545 nm and emission 575 nm. For TG content, lipid extraction from BAT1 brown adipocytes was conducted as we previously described (33). The lipid extraction was dissolved in 2% Triton X-100 and used for triglyceride quantification using a TG kit/L-Type TG M (Wako Chemicals, Wako, Richmond, VA). For lipolysis, glycerol released into the culture medium was determined as an indicator for lipolysis, using a one-step enzymatic fluorometric method as we previously described (34).
Antibodies and Reagents
Antibodies used in immunoblotting, chromatin immunoprecipitation (ChIP) assays, and immunoprecipitation (IP) assays are as follows: trimethylated H3K27 (07–449, Millipore, Bedford, MA), acetylated H3K27 (ab 4729, Abcam, Cambridge, MA), UTX (KDM6A) (ab 36938, Abcam, for ChIP; A302–374A, Bethyl Laboratories, Montgonery, TX, for IB), Ezh2 (5246, Cell Signaling Technology, Beverly, MA), Suz12 (3737, Cell Signaling Technology), CBP (7389, Cell Signaling Technology), α-Tubulin (2144, Cell Signaling Technology), HA (12CA5, Roche), GAPDH (6C5) (sc-32233, Santa Cruz, CA). Isobutylmethylxanthine, indomethacin, dexamethasone, insulin, T3, and Isop were all purchased from Sigma Aldrich. Dulbecco's Modified Eagle's Medium Nutrient Mixture F-12 (DMEM/F12), Dulbecco's Modification of Eagle's Medium (DMEM), Opti-MEM Medium, fetal bovine serum (FBS), and penicillin/streptomycin were purchased from Life Technologies (Grand Island, NY).
Plasmid Constructs and Transfection
The MGC fully sequenced mouse UTX cDNA (Clone ID # 6516368) was purchased from GE Healthcare (Lafayette, CO) and was further cloned into pcDNA3.1 expression vectors (Life Technologies). The expression construct pcDNA3β-FLAG-CBP-HA (35) was purchased from Addgene (Cambridge, MA). The differentiated BAT1 cells were reversely transfected with expression plasmids using a Lipofectamine LTX with PLUS Reagent kit (Invitrogen, 15338100) as we previously described (36).
SiRNA Knockdown
The ON-TARGET plus Mouse Kdm6a siRNA-SMART pool (L-042844-01-0005) was purchased from GE Dharmacom (GE Healthcare). The differentiated BAT1 cells were reversely transfected with SiRNA to achieve the gene knockdown at day 6 using Lipofectamine RNAiMAX Reagent kit (Invitrogen) as we previously described (36).
Total RNA Extraction and Quantitative RT-PCR
Total RNA was extracted from adipose tissue or BAT1 cells using Tri-Reagent kit (Molecular Research Center, Cincinnati, OH) according to the manufacturer's instruction. The expression of genes of interests was assessed by quantitative RT-PCR (ABI Universal PCR Master Mix, Applied Biosystems, Foster City, CA) using a Stratagene Mx3000p thermocycler (Stratagene, La Jolla, CA) as we previously described (36). The primer and probe pairs used in the assays were purchased from Applied Biosystems.
Immunoprecipitation (IP) and Immunoblotting (IB)
IP and IB were performed as we previously described (37, 38). Briefly, BAT1 cells were harvested and homogenized in a modified radioimmunoprecipitation assay (RIPA) lysis buffer containing 50 mm Tris-HCl, 1 mm EDTA, 1% Nonidet P-40, 0.25% sodium deoxycholate, 150 mm NaCl, 1 mm phenylmethylsulfonyl fluoride, 200 mm Na3VO3, 1% protease inhibitor mixture (Sigma), and 1% phosphatase inhibitor mixture (Sigma). Cell homogenates were incubated on ice for 45 min to solubilize all proteins, and insoluble portions were removed by centrifugation at 14,000 × g at 4 °C for 15 min. 2 mg of cell lysates was incubated overnight with the appropriate antibodies and protein A/G-agarose (Santa Cruz Biotechnology) at 4 °C with constant gentle mixing. Agarose beads were collected by centrifugation, washed with ice-cold RIPA lysis buffer three times, and phosphate-buffered saline two times, and then boiled in Laemmli sample buffer for denaturation of proteins. For IB, proteins from immunoprecipitates or whole cell lysates were separated by SDS-PAGE. Proteins on the gels were transferred to nitrocellulose membrane (Bio-Rad). The transferred membranes were blocked, washed, and incubated with various primary antibodies, followed by Alexa Fluor 680-conjugated secondary antibodies (Life Science Technologies). The blots were developed with a Li-COR Imager System (Li-COR Biosciences, Lincoln, NE).
Chromatin Immunoprecipitation (ChIP) Assay
ChIP assays were performed using a ChIP assay kit (Upstate, Lake Placid, NY) as we previously described (37). For animal experiments, tissue samples were cut into small pieces and fixed with 1% of formaldehyde. The samples were then homogenized in cell lysis buffer (5 mm PIPES, 85 mm KCl, and 0.5% Nonidet P-40, supplemented with protease inhibitors, pH 8.0) using a Dounce homogenizer to isolate nuclei. The nuclei were resuspended in nuclei lysis buffer (50 mm Tris-HCl, 10 mm EDTA, and 1% SDS, supplemented with protease inhibitors, pH 8.1) and sonicated to shear genomic DNA to an average fragment length of 200–1,000 bp with a Diagenode Bioruptor (Diagenode, Denville, NJ). Lysates were centrifuged, and the supernatants were collected. Fifty microliters of each sample was removed as the input control. The supernatants underwent overnight immunoprecipitation, elution, reverse cross-linking, and protease K digestion, according to the manufacturer's manual. A mock immunoprecipitation without antibody was also included for each sample. The DNAs recovered from phenol/chloroform extraction were used for SYBR Green quantitative PCR (Applied Biosystems), and the DNA quantitation value of each sample was further normalized with the DNA quantitation of individual input control. The sequences of primers were: UCP1 Enhancer forward: 5′-CTCCTCTACAGCGTCACAGCGG-3′; reverse: 5′-AGTCTGAGGAAAGGGTTGA-3′; UCP1 START forward: 5′-CCCACTAGCAGCTCTTTGGA-3′; reverse: 5′-CTGTGGAGCAGCTCAAAGGT-3′. PGC1α MEF forward: 5′-GCTCGCTGCATTTCTTTCTT-3′; reverse: 5′-CCCCACAGACTCAAAAACCA-3′. PGC1α CRE forward: 5′-CAAAGCTGGCTTCAGTCACA-3′; reverse: 5′-AAAAGTAGGCTGGGCTGTCA-3′.
Statistics
One-way analysis of variance (ANOVA) and least-significant-difference test were performed to evaluate statistical significance using GraphPad Prism version 5.0. Statistical significance was considered at p < 0.05. All data are shown as means ± S.E. of means (S.E.).
Results
UTX Expression Is Elevated in Brown Adipocyte Differentiation and by Cold Exposure
To determine the physiological relevance of UTX in regulating brown fat functions, we first measured UTX expression during the course of brown adipocyte differentiation and in response to the cold exposure. BAT1 preadipocytes were cultured in a differentiation medium as described in the “Experimental Procedures” and were induced to be differentiated into brown adipocytes, evident by morphological changes as shown by Oil Red O staining (Fig. 1A) and dramatic up-regulation of UCP1 mRNA and protein expression (Fig. 1, B and C). We found that both UTX mRNA and protein levels displayed a slow but sustained increase during the course of BAT1 adipocyte differentiation (Fig. 1, D and E). However, there was no change in UTX mRNA expression in the differentiation process of 3T3-L1 preadipocyte (Fig. 1F), a white adipocyte cell line. We then measured UTX mRNA and protein expression in both brown adipose tissue (BAT) and white adipose tissue (WAT) of C57BL/6J mice. We found that both UTX mRNA and protein levels were higher in BAT than in WAT (Fig. 2, A and B). To determine where UTX is mainly present in adipose tissue that exhibits heterogeneity and contains various cell types, we separated brown or white adipocytes from stromal vascular fractions (SVFs) by collagenase digestion. Interestingly, UTX mRNA expression was higher in brown adipocytes than SVFs in BAT, whereas there was no such differential expression observed in WAT (Fig. 2C). We then measured UTX mRNA and protein expression in both BAT and WAT of C57BL/6J mice exposed to cold at 4 °C. Fig. 2D shows that UTX mRNA levels were induced by 6-h cold exposure in BAT of mice and declined after 7 day cold exposure, which mimics the expression pattern of BAT UCP1 in response to cold by our previous observation (39). Moreover, UTX mRNA expression in WAT depots including epididymal fat (eWAT) and subcutaneous fat (sWAT) was induced by 6-hour cold and remained at a sustained level after 7-day cold (Fig. 2D), which also resembles the expression pattern of WAT UCP1 during cold exposure (39). A similar induction of UTX protein by cold was also observed in both BAT and WAT (Fig. 2, E and F). Since UTX was induced by cold in WAT, we reckoned that the induction of UTX might be associated with the appearance of beige cells in WAT. We therefore performed immunohistochemical staining of both UCP1 and UTX protein in two continuous serial sections of WAT from mice exposed to cold at 4 °C for 7 days. Fig. 2G (left panel) shows that cold exposure induced the UCP1-positive multiocular beige cells, while UTX-positive cells were overlapped with the UCP1-positive beige cells in the next continuous section of immunohistochemical staining (Fig. 2G, right panel). Interestingly, high fat diet feeding for 12 weeks down-regulated UTX mRNA expression in both BAT and WAT depots (Fig. 2, H and I). These data suggest that UTX might be involved in regulation of brown fat functions and energy metabolism.
FIGURE 2.

UTX expression is induced by cold exposure in BAT. BAT exhibits higher UTX mRNA (A) and protein (B) levels than WAT. C, UTX mRNA levels are higher in brown adipocytes than in stromal vascular fractions (SVFs), while there is no differential expression in adipocytes and SVFs of WAT. D, UTX mRNA levels were induced by cold exposure in BAT and WAT of mice. E and F, UTX protein levels were induced by cold exposure in BAT and WAT of mice. G, UTX protein is induced in beige cells of WAT. H and I, UTX mRNA expression in BAT (D) and WAT (E) are down-regulated by high fat diet feeding (12 weeks). UTX mRNA and protein levels were measured by quantitative RT-PCR and immunoblotting, respectively, as described under “Experimental Procedures.” Immunohistochemical staining of UCP1 and UTX protein were conducted in two continuous serial sections of WAT from mice exposed to cold at 4 °C for 7 days. All data are expressed as mean ± S.E., n = 4; groups labeled with different letters are statistically different from each other. eWAT: epididymal WAT; sWAT: subcutaneous WAT.
UTX Regulates Brown Fat Gene Expression
To investigate the role of UTX in regulating the expression of the brown fat specific genes, we performed gain- or loss-of-function experiments in differentiated BAT1 cells. We first conducted a knockdown experiment on UTX expression by SiRNA to achieve gene silencing at day 6 of differentiation, aiming to study these brown fat cells at the mature adipocyte stage. The UTX mRNA in knockdown cells was inhibited by more than 80% as measured by real time RT-PCR (Fig. 3A), and the protein expression was also significantly decreased, as assessed by immunoblotting (Fig. 3B). Since UTX is a histone demethylase that preferentially targets H3K27 tri-methylation (H3K27me3) (26), we therefore validated the loss of UTX function by measuring H3K27me3 levels in BAT1 brown adipocytes. Indeed, inactivation of UTX led to a significant increase in H3K27me3 (Fig. 3B). More importantly, UTX knockdown reduced basal brown fat gene expression such as UCP1, PGC1α, Acox1 etc. (Fig. 3, C–I), and also attenuated Isoproterenol (Isop)-stimulated expression of brown fat genes (Fig. 3, C–I). However, UTX knockdown did not affect the expression of PPARγ2 (Fig. 3J), a key differentiation marker, suggesting that UTX deficiency is not likely to cause brown adipocyte de-differentiation. We then overexpressed UTX in BAT1 brown adipocytes, as shown by increased protein expression (Fig. 4A). In contrast to the loss of UTX function, over-expression of UTX in BAT1 cells gained the function of demethylation on H3K27, evident by down-regulated H3K27me3 levels (Fig. 4A). Overexpression of UTX induced expression of brown fat specific genes including UCP1, PGC1α, Acox1, Dio2, Elovl3, PGC1β (Fig. 4, B–G), as assessed by real time RT-PCR. In consistence, overexpression of UTX further promoted Isop-stimulated expression of brown fat genes (Fig. 4, B–G). These data derived from our gain- or loss- of function studies suggest that UTX might be a regulator of thermogenic program in brown adipocytes.
FIGURE 3.

Inactivation of UTX inhibits brown fat specific gene expression. A, UTX mRNA in control or knockdown cells. B, UTX protein and H3K27me3 levels in control or knockdown cells with or without isoproterenol treatment. C–J, inactivation of UTX suppresses the expression of brown fat genes including UCP1 (C), PGC1α (D), Acox1 (E), Eva1 (F), Dio2 (G), Fgf21 (H), Cidea (I), while having no effect on PPARγ2 expression (J). BAT1 cells were differentiated and then reversely transfected with UTX SiRNA as described in “Experimental Procedures.” UTX and brown fat gene mRNA and protein levels were measured by quantitative RT-PCR and immunoblotting, respectively, as described under “Experimental Procedures.” All data are expressed as mean ± S.E., n = 4; groups labeled with different letters are statistically different from each other. Isop, Isoproterenol (1 μm).
FIGURE 4.

Overexpression of UTX promotes brown fat specific gene expression. A, UTX protein and H3K27me3 levels in control or overexpression cells with or without isoproterenol treatment. B–G, overexpression of UTX promotes the expression of brown fat genes including UCP1 (B), PGC1α (C), Acox1 (D), Dio2 (E), Elovl3 (F), and PGC1β (G). BAT1 cells were differentiated and then reversely transfected with UTX expression plasmids as described under “Experimental Procedures.” UTX and H3K27me3 protein levels were detected by immunoblotting and brown fat gene mRNA levels were measured by quantitative RT-PCR, as described in the “Experimental Procedures.” All data are expressed as mean ± S.E., n = 4; groups labeled with different letters are statistically different from each other. Isop: isoproterenol l (1 μm).
UTX Inhibits Trimethylated H3K27 at the UCP1 and PGC1α Promoters
Trimethylated H3K27 (H3K27me3) is a hallmark of gene repression (15). UTX is capable of demethylating H3K27me3, limiting its ability of gene silencing (26, 40). We reasoned that if UTX indeed plays a significant role as a positive regulator of brown fat functions, it should be recruited to promoter regions of key genes involved in brown fat phenotypes and development. We therefore examined the recruitment of UTX to the promoter regions of UCP1 and PGC1α in response to β adrenergic activation, a key signal mediating brown adipocyte development and functions. Indeed, treatment of BAT1 brown adipocytes with Isop, a β adrenergic receptor agonist, enhanced the binding of UTX to the proximal transcript start site at the UCP1 promoter (Fig. 5A), as assessed by ChIP assays with SYBR Green quantitative PCR. Similarly, activation of β adrenergic signaling by Isop also recruited UTX to the upstream enhancer of the UCP1 promoter (Fig. 5A), which contains key cis-acting elements for specific expression of UCP1 in brown fat (41). We further explored whether activation of β adrenergic signaling promotes the binding of UTX to the PGC1α promoter, a critical regulator of brown fat development. We focused on two key cis-acting elements CREB and MEF2-binding sites that are important for PGC1α transcription at the PGC1α promoter (42, 43). Our ChIP quantitative PCR data demonstrated that Isop induced a strong recruitment of UTX to the CREB binding site at the PGC1α promoter (Fig. 5A). A similar trend was observed on the MEF2 site, albeit to a much lesser extent without statistical significance (Fig. 5A). We reasoned that the recruitment of UTX to the UCP1 and PGC1α promoters by the β adrenergic activation would demethylate H3K27me3 at their promoter regions. We therefore further performed ChIP assays using the antibody against H3K27me3 at the UCP1 and PGC1α promoters. In consistence, treatment of BAT1 adipocytes with Isop decreased H3K27me3 on both the upstream enhancer and the transcription start site of the UCP1 promoter and the CRE site of the PGC1α promoter (Fig. 5B). This inhibitory effect of Isop on H3K27me3 can be mimicked by overexpression of UTX in BAT1 adipocytes. Gain-of-function by overexpressing UTX reduced the basal binding of H3K27me3 and further decreased the Isop-suppression of H3K27me3 binding to the upstream enhancer and the transcription start site of the UCP1 promoter (Fig. 5B). Similar results were observed on the association of H3K27me3 with the CRE site of the PGC1α promoter (Fig. 5B). In contrast, inactivation of UTX by SiRNA knockdown up-regulated basal and partially blocked Isop suppression of H3K27me3 on the enhancer region and the transcription start site of the UCP1 promoter (Fig. 5C). Similar results were also observed on the binding of H3K27me3 to the CRE site of the PGC1α promoter (Fig. 5C).
FIGURE 5.
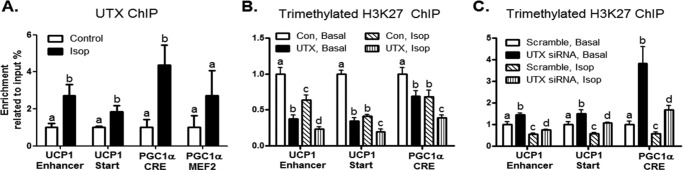
UTX inhibits trimethylated H3K27 at the UCP1 and PGC1α promoters. A, activation of β adrenergic signaling by isoproterenol recruits UTX to the UCP1 and PGC1α promoters. B, overexpression of UTX decreases H3K27me3 at the UCP1 and PGC1α promoters. C, inactivation of UTX enhances H3K27me3 at the UCP1 and PGC1α promoters. UTX overexpression or knockdown in BAT1 adipocytes was conducted as described under “Experimental Procedures.” The UTX or H3K27me3 binding to the UCP1 and PGC1α promoters was assessed by ChIP assays followed by SYBR Green quantitative PCR as described under “Experimental Procedures.” All data are expressed as mean ± S.E., n = 4; groups labeled with different letters are statistically different from each other. Isop: isoproterenol (1 μm); Start: transcription start site.
UTX Decreases Ezh2/Suz12 Binding to the UCP1 and PGC1α Promoters
H3K27 methylation is dynamically regulated by both histone methyltransferases and demethylases (15). Polycomb repressive complex 2 (PRC2) is a histone methyltransferase that preferentially target H3K27 (44). Through its histone methyltransferase subunits Ezh2 and Suz12, PRC2 methylates H3K27 to facilitate transcriptional repression (44). We thus examine the relationship between the histone demethylase UTX and histone methyltransferase PRC2 in regulation of H3K27 methylation at the UCP1 and PGC1α promoters. Our ChIP data show that activation of β adrenergic signaling by Isop reduced the bindings of the PRC2 subunits Ezh2 and Suz12 to the UCP1 and PGC1α promoters (Fig. 6, A–D). However, UTX deficiency by SiRNA knockdown promoted the bindings of Ezh2 and Suz12 to the UCP1 and PGC1α promoters in the absence or presence of Isop treatment (Fig. 6, A and B). Conversely, overexpression of UTX suppressed the bindings of the PRC2 subunits to the UCP1 and PGC1α promoters (Fig. 6, C and D). These data suggest that the histone demethylase UTX and histone methyltransferase PRC2 reciprocally regulate H3K27 methylation at the UCP1 and PGC1α promoters.
FIGURE 6.

UTX decreases Ezh2/Suz12 binding to the UCP1 and PGC1α promoters. Inactivation of UTX enhances Ezh2 (A) and Suz12 (B) bindings at the UCP1 and PGC1α promoters. Overexpression of UTX decreases Ezh2 (C) and Suz12 (D) bindings at the UCP1 and PGC1α promoters. UTX knockdown or overexpression in BAT1 adipocytes was conducted as described under “Experimental Procedures.” The Ezh2 or Suz12 binding to the UCP1 and PGC1α promoters was assessed by ChIP assays followed by SYBR Green quantitative PCR as described under “Experimental Procedures.” All data are expressed as mean ± S.E., n = 4; groups labeled with different letters are statistically different from each other. Isop: isoproterenol (1 μm); Start: transcription start site.
UTX Potentiates H3K27 Acetylation by Interacting with CBP at the UCP1 and PGC1α Promoters
H3K27 is also subjected to acetylating modification, which correlates with transcriptional activation (25). Unlike the transcriptional repressive mark H3K27me3, H3K27 acetylation (H3K27ac) is a transcriptional active mark (25). Since UTX demethylates H3K27me3 to attenuate gene silencing, it would be interesting to see whether the relief of the repressive histone mark H3K27me3 through UTX demethylation will be switched to the active mark acetylated H3K27 (H3K27ac) by histone acetylation. β adrenergic activation by Isop promoted H3K27 acetylation at both the transcription start site and the enhancer region of the UCP1 promoter and the CRE site of the PGC1α promoter (Fig. 7A). In contrast, inactivation of UTX inhibited H3K27ac at the transcription start site, but not the enhancer region of the UCP1 promoter (Fig. 7A). A similar inhibition of H3K27ac on the CRE site at the PGC1α promoter was also observed (Fig. 7A). Conversely, gain of function of UTX by overexpression promoted basal and further enhanced Isop-stimulated H3K27ac at the UCP1 promoter (Fig. 7B). Similarly, overexpression of UTX up-regulated H3K27ac at the CRE site of the PGC1α promoter (Fig. 7B). Since the histone acetyltransferases (HATs) proteins CBP and P300 are required for H3K27 acetylation (25, 45), we further examined whether regulation of H3K27ac by UTX also recruit CBP and P300. Although inactivation of UTX or Isop had no significant effects on P300 binding to the UCP1 and PGC1 promoters (Fig. 7C), CBP binding to the UCP1 and PGC1 promoters resembles the pattern of H3K27ac. UTX knockdown decreased CBP recruitment to the UCP1 and PGC1 promoters in the absence or presence of Isop, while overexpression of UTX did the opposite (Fig. 7, D and E). To further determine whether UTX directly interacts with CBP, we examined the physical interaction between UTX and CBP. We overexpressed both UTX and CBP-HA in BAT1 brown adipocytes and performed the co-immunoprecipitation assays. UTX was first immmunoprecipitated and followed by immunoblotting with the antibody against HA tag associated with CBP. Immunoprecipitation of UTX with specific anti-UTX antibody pulled down the CBP protein (Fig. 8A). Likewise, CBP was then immunoprecipitated with the HA antibody and followed by immunoblotting with the UTX antibody. Immunoprecipitation of CBP with the specific antibody against HA pulled down the UTX protein (Fig. 8B). To examine whether there is a basal interaction between UTX and CBP at endogenous levels, we isolated nuclear protein and performed co-immunoprecipitation followed by immunoblotting using the antibody against CBP instead of the antibody against HA protein that tags CBP. Our data indicate a weak basal interaction between UTX and CBP at endogenous levels. Immunoprecipitation of UTX pulled down the endogenous CBP protein evident by a faint band by immunoblotting with the CBP antibody, albeit at very low levels (Fig. 8C). Similarly, immunoprecipitation of CBP with the specific antibody against CBP pulled down the endogenous UTX protein (Fig. 8C). Taken together, our data suggest that CBP interacts with UTX at the UCP1 and PGC1α promoter regions and acetylates H3K27, which switches the transcriptional repressive state (H3K27me3) to the transcriptional active state (H3K27ac), leading to UCP1 and PGC1α gene expression.
FIGURE 7.

UTX potentiates H3K27 acetylation by interacting with CBP at the UCP1 and PGC1α promoters. A, inactivation of UTX decreases H3K27ac at the UCP1 and PGC1α promoters. B, overexpression of UTX increases H3K27ac at the UCP1 and PGC1α promoters. C, inactivation of UTX does not affect P300 binding at the UCP1 and PGC1α promoters. D, inactivation of UTX decreases CBP recruitment at the UCP1 and PGC1α promoters. E, overexpression of UTX increases CBP recruitment at the UCP1 and PGC1α promoters. UTX knockdown or overexpression in BAT1 adipocytes was conducted as described under “Experimental Procedures.” The H3K27ac, P300, or CBP binding to the UCP1 and PGC1α promoters was assessed by ChIP assays followed by SYBR Green quantitative PCR as described under “Experimental Procedures.” All data are expressed as mean ± S.E., n = 4; groups labeled with different letters are statistically different from each other. Isop: isoproterenol (1 μm); Start: transcription start site.
FIGURE 8.
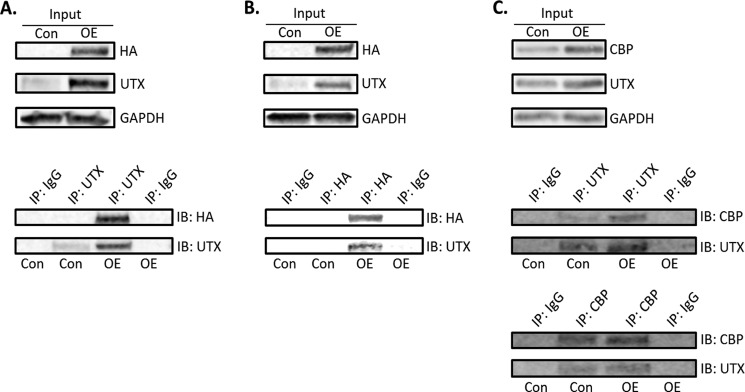
UTX physically interacts with CBP in BAT1 cells. A, immunoprecipitation of UTX pulls down the CBP protein. B, immunoprecipitation of CBP pulls down the UTX protein. C, UTX and CBP have a weak interaction at endogenous levels. BAT1 cells were reversely transfected with UTX and CBP-HA expression plasmids as described in “Experimental Procedures.” Immunoprecipitation and immunoblotting were conducted as described under “Experimental Procedures.” For A and B, the whole cell lysates were used for IP and IB, and the antibody used for IP and IB CBP-HA was the antibody against HA. For C, the nuclear protein was extracted and used for IP and IB and the antibody used for IP and IB CBP-HA was the antibody against CBP. OE: overexpression.
UTX Decreases Mitochondrial Member Potential and Regulates Lipid Metabolism in BAT1 Brown Adipocytes
We further determined whether regulation of thermogenic program by UTX would further affect mitochondrial functions and lipid metabolism in brown adipocytes. We first determined the mitochondrial membrane potentials in BAT1 brown adipocytes with UTX overexpression using a TMRE Mitochondrial Membrane Potential Kit. In consistence with the data on UTX regulation of thermogenic program we presented above, UTX overexpression decreased mitochondrial membrane potentials, using an ionophore carbonyl cyanide 4-trifluoromethoxy-phenylhydrazone (FCCP) as a positive control (Fig. 9A). Since up-regulation of mitochondrial functions may require more fatty acid supply, we therefore measure lipolysis in BATs cells with UTX knockdown or over-expression. UTX knockdown inhibited basal and Isop-stimulated lipolysis, indicated by less glycerol release into the medium (Fig. 9B, left panel), while UTX overexpression did the opposite (Fig. 9B, right panel). We reasoned that regulation of lipolysis by UTX may further affect lipid accumulation in BAT1 adipocytes. Indeed, higher TG contents were observed in UTX knockdown brown adipocytes (Fig. 9C, left panel), while BAT1 cells with UTX over-expression displayed lower TG contents (Fig. 9C, right panel).
FIGURE 9.

UTX decreases mitochondrial member potential and regulates lipid metabolism in BAT1 brown adipocytes. A, UTX overexpression decreases mitochondrial member potential in BAT1 brown adipocytes. B, UTX knockdown inhibits basal and isoproterenol-stimulated lipolysis (left panel), while UTX overexpression does the opposite (right panel). C, UTX knockdown increases triglyceride content (left panel), while UTX overexpression decreases triglyceride content in BAT1 adipocytes (right panel). Mitochondrial potential measurement was conducted using a TMRE Mitochondrial Membrane Potential Assay kit as described under “Experimental Procedures.” FCCP, an ionophore uncoupler, was used as a positive control to decrease mitochondrial membrane potentials. Lipolysis and TG content in BAT1 cells were conducted as described under “Experimental Procedures.” All data are expressed as mean ± S.E., n = 4; groups labeled with different letters are statistically different from each other. OE: overexpression; Isop: isoproterenol (1 μm).
Discussion
It has been well documented that brown/beige adipocytes function to dissipate energy as heat through adaptive thermogenesis. Understanding the molecular mechanisms underlying the brown fat thermogenic program may provide insights for the development of therapeutic approaches in the treatment of obesity. Most of the current studies investigating the mechanisms in the regulation of brown fat development focus on genetic mechanisms and cellular signaling pathways; little is known about the epigenetic mechanisms in this process. We first observed that UTX was up-regulated during the process of brown adipocyte differentiation. UTX was also induced by cold exposure in both BAT and WAT of mice, while its expression was down-regulated by high-fat diet feeding in both BAT and WAT. These data indicate that UTX might be involved in regulation of brown fat functions and energy metabolism. We therefore hypothesized that UTX plays a significant role in regulation of brown fat thermogenic program. Using gain or loss of function studies, we found that inactivation of UTX down-regulated brown fat specific gene expression, while overexpression of UTX did the opposite. These data demonstrate that UTX might be important in regulation of brown fat specific gene expression. We further explored the molecular mechanism underlying the regulation of thermogenic program by UTX. Interestingly, activation of β adrenergic signaling by Isop recruited UTX to the UCP1 and PGC1α promoters, leading to decreased H3K27me3, a histone transcriptional repressive mark. The demethylation of H3K27 followed the acetylation of H3K27 through interaction between UTX and CBP. We conclude that UTX positively regulates brown adipocyte thermogenic program through reciprocal control of H3K27me3 demethylation and H3K27 acetylation.
Most complex diseases, including obesity and diabetes are results of gene and environment interactions. One of the mechanisms that environmental factors such as diets affect gene expression patterns involves their capacity to reprogram the epigenome (16, 17). Evidence converges to suggest that epigenetic events figure prominently in the development of obesity and diabetes (18–22). UCP1 promoter activity is regulated by changes in DNA methylation status (46). In addition, the H3K9 demethylase JHDM2a directly regulates UCP1 expression, and genetic deletion of JHDM2a in mice results in obesity (47). Histone lysine methylation has also been associated with adipocyte differentiation (25). The transcriptional active mark H3K4me promotes adipogenesis through interacting with the promoter of PPARγ (48), a key transcriptional factor required for adipogenesis. Moreover, the H3K27 methyltransferase Ezh2 promotes adipogenesis through repressing the Wnt family proteins, a family of negative regulators of adipogenesis (25, 27). In the present study, we investigated the role of UTX and its target H3K27 in regulation of brown fat gene expression at the mature adipocyte stage. This raises an interesting question as to whether UTX also regulates brown adipocyte adipogenesis through demethylating H3K27me3 at genes that promote adipogenesis and subsequently affects brown fat thermogenic program.
In rodents, there exist two types of brown adipocytes (49). Traditional brown adipocytes are located in discrete areas, such as the interscapular BAT; whereas “inducible” beige adipocytes are dispersed in WAT (49–51), and can be induced by cold exposure or β3-adrenergic receptor activation (39, 52) through activation of the sympathetic nervous system (SNS) as measured neurochemically by norepinephrine turnover (NETO) (53, 54). Therefore, β adrenergic activation via cold or β adrenergic agonists is required for the development of both traditional brown fat and beige adipocytes. Interestingly, UTX is induced by cold or β adrenergic activation and up-regulates the thermogenic program in BAT1 cells (Fig. 2). Loss of UTX in BAT1 cells substantially blocks the expression of thermogenic genes induced by Isop (Fig. 3). Moreover, β adrenergic activation decreases the transcriptional repressive mark H3K27me3 and increases the active mark H3K27ac through interaction between UTX and CBP (Figs. 5–7). The reciprocal regulation of decreased H3K27 methylation coupled with increased acetylation by β adrenergic activation was significantly compromised by inactivation of UTX in BAT1 cells. These data suggest that UTX at least partially mediates the induction of brown fat thermogenic program activated by β adrenergic signaling or by SNS. This is physiologically important, since we demonstrate a potential role of UTX in regulating brown fat function and development during cold exposure through activation of SNS. However, genetic models with gain or loss of function of UTX specifically in brown fat will be required to determine the role of UTX in regulation of cold and/or diet-induced adaptive thermogenesis in vivo. It is also important to determine what signal(s) mediates the enrichment of UTX on the UCP1/PGC1α promoters in response to β adrenergic signaling. Moreover, UTX is a histone demethylase responsible for H3K27me2 and H3K27me3 but not for H3K27me1. We only examined the H3K27me3 levels throughout our studies. It is not clear whether H3K27me2 or H3K27m1 or both are also involved in the regulation of the thermogenic program in BAT1 cells.
Although both express UCP1 and share striking similarities in morphological and biological properties, traditional brown fat and beige adipocytes are derived from distinct cell origins during embryonic development (50, 51, 55). In rodents, traditional brown adipocytes are originated from the skeletal muscle lineage (50), while at least a subset of beige cells arise from the smooth muscle origin (55). A recent study shows that human brown adipocytes possess molecular features similar to those of rodent beige cells (56). We used the brown fat cell BAT1 in this study. Although both brown fat and beige cells are regulated by SNS and β adrenergic signaling and UTX at least partially mediates the induction of thermogenic program by β adrenergic activation, it is not clear whether the role of UTX in regulation of brown adipocyte function can be extrapolated to beige cells. Additional studies, involving deletion or overexpression of UTX in beige lineage cells, will be warranted to determine the role of UTX in regulation of beige cell function and development.
Brown/beige adipocyte thermogenesis is under a complex transcriptional regulation. The presence of UCP1 is a biological and functional signature of both brown adipocytes and beige cells due to its capacity to uncouple oxidative phosphorylation from ATP synthesis, thereby profoundly increasing thermogenesis and energy dissipation (6, 7). PGC1α plays a central role in regulating important pathways involved in mitochondrial biogenesis and thermogenesis (57, 58). PGC1α and UCP1 are regulated at transcriptional levels by positive and negative factors. For example, a ∼220 bp upstream enhancer element has been identified at the UCP1 promoter that mediates sympathetic-stimulated and tissue-specific expression of UCP1 (41, 59). PGC1α expression is highly induced via β-adrenergic receptor activated PKA/CREB pathway (60, 61). Two regions at the PGC1α promoter including CREB and Mef2-binding sites have been identified as key important cis-acting elements for PGC1α transcription (42, 43). We therefore chose to study the UTX regulation of epigenetic changes in the representative and phenotypic gene UCP1 of the brown adipocytes/beige cells and the master transcriptional regulator PGC1α. We examined whether UTX regulates H3K27 methylation at the specific regions such as the enhancer at the UCP1 promoter and CREB and Mef2 binding sites at the PGC1α promoter. It would be interesting to know whether UTX also demethylates H3K27me3 at other genes' promoters to regulate transcription. Unbiased approaches such as ChIP sequencing will be required to explore the gene profile UTX regulates through H3K27 demethylation.
In summary, our data strongly imply a role for UTX in the regulation of brown adipocyte thermogenic program. Our data show that UTX is up-regulated during the process of brown adipocyte differentiation and is also induced by cold exposure in both BAT and WAT of mice. Our gain or loss of function studies indicate that inactivation of UTX down-regulates brown fat specific gene expression, while overexpression of UTX does the opposite. Notably, activation of β adrenergic signaling recruits UTX to the UCP1 and PGC1α promoters, leading to decreased H3K27me3, a histone transcriptional repressive mark. UTX demethylates H3K27me3 and is subsequently associated with the HAT protein CBP, leading to increased H3K27ac. UTX positively regulate brown adipocyte thermogenic program through coordinated regulation of H3K27me3 demethylation and H3K27 acetylation, switching the transcriptional repressive state to the transcriptional active state at the promoters of UCP1 and PGC1α. We conclude that UTX plays a role in regulating brown fat specific gene expression through coordinated down-regulation of H3K27me3 and up-regulation of H3K27ac and may mediate β adrenergic activation of brown fat function.
Author Contributions
L. Z., F. L., and R. W. performed most experiments and analyzed the data. L. A. and V. R. provided technical supports and data analysis for mitochondrial membrane potential measurements. L. Y. and V. R. contributed to discussion and reviewed/edited the manuscript. H. S., B. X., and H. L. conceived the hypothesis, designed the study, analyzed the data, and wrote the manuscript.
Acknowledgment
We also thank Dr. Patrick Seale for providing us the BAT1 cells.
This work was supported by National Institutes of Health Grants R01HL107500 (to B. X.), R01DK084172 (to H. S.), American Heart Association (AHA) Grants 10SDG3900046 (to B. X.), American Diabetes Association (ADA) Grant 7-13-BS-159 (to H. S.), and seed grants from Center for Obesity Reversal at Georgia State University (to V. R., B. X., and H. S.). The authors declare that they have no conflicts of interest with the work presented in the paper.
- WAT
- white adipose tissue
- BAT
- brown adipose tissue
- TG
- triglyceride
- ChIP
- chromatin immunoprecipitation
- SVF
- stromal vascular fraction
- Isop
- Isoproterenol
- HAT
- histone acetyltransferase
- FCCP
- carbonyl cyanide 4-trifluoromethoxy-phenylhydrazone.
References
- 1. Hill J. O., Wyatt H. R., Peters J. C. (2012) Energy balance and obesity. Circulation 126, 126–132 [DOI] [PMC free article] [PubMed] [Google Scholar]
- 2. Lowell B. B., Spiegelman B. M. (2000) Towards a molecular understanding of adaptive thermogenesis. Nature 404, 652–660 [DOI] [PubMed] [Google Scholar]
- 3. Cohen P., Levy J. D., Zhang Y., Frontini A., Kolodin D. P., Svensson K. J., Lo J. C., Zeng X., Ye L., Khandekar M. J., Wu J., Gunawardana S. C., Banks A. S., Camporez J. P., Jurczak M. J., Kajimura S., Piston D. W., Mathis D., Cinti S., Shulman G. I., Seale P., Spiegelman B. M. (2014) Ablation of PRDM16 and beige adipose causes metabolic dysfunction and a subcutaneous to visceral fat switch. Cell 156, 304–316 [DOI] [PMC free article] [PubMed] [Google Scholar]
- 4. Feldmann H. M., Golozoubova V., Cannon B., Nedergaard J. (2009) UCP1 ablation induces obesity and abolishes diet-induced thermogenesis in mice exempt from thermal stress by living at thermoneutrality. Cell Metab. 9, 203–209 [DOI] [PubMed] [Google Scholar]
- 5. Seale P., Conroe H. M., Estall J., Kajimura S., Frontini A., Ishibashi J., Cohen P., Cinti S., Spiegelman B. M. (2011) Prdm16 determines the thermogenic program of subcutaneous white adipose tissue in mice. J. Clin. Invest. 121, 96–105 [DOI] [PMC free article] [PubMed] [Google Scholar]
- 6. Cannon B., Nedergaard J. (1985) The biochemistry of an inefficient tissue: brown adipose tissue. Essays in Biochemistry 20, 110–164 [PubMed] [Google Scholar]
- 7. Nicholls D. G., Locke R. M. (1984) Thermogenic mechanisms in brown fat. Physiological Reviews 64, 1–64 [DOI] [PubMed] [Google Scholar]
- 8. Kopecky J., Clarke G., Enerbäck S., Spiegelman B., Kozak L. P. (1995) Expression of the mitochondrial uncoupling protein gene from the aP2 gene promoter prevents genetic obesity. J. Clin. Invest. 96, 2914–2923 [DOI] [PMC free article] [PubMed] [Google Scholar]
- 9. Kopecký J., Hodný Z., Rossmeisl M., Syrový I., Kozak L. P. (1996) Reduction of dietary obesity in aP2-Ucp transgenic mice: physiology and adipose tissue distribution. Am. J. Physiol. 270, E768–E775 [DOI] [PubMed] [Google Scholar]
- 10. Cypess A. M., Lehman S., Williams G., Tal I., Rodman D., Goldfine A. B., Kuo F. C., Palmer E. L., Tseng Y. H., Doria A., Kolodny G. M., Kahn C. R. (2009) Identification and importance of brown adipose tissue in adult humans. N. Engl. J. Med. 360, 1509–1517 [DOI] [PMC free article] [PubMed] [Google Scholar]
- 11. van Marken Lichtenbelt W. D., Vanhommerig J. W., Smulders N. M., Drossaerts J. M., Kemerink G. J., Bouvy N. D., Schrauwen P., Teule G. J. (2009) Cold-activated brown adipose tissue in healthy men. N. Engl. J. Med. 360, 1500–1508 [DOI] [PubMed] [Google Scholar]
- 12. Virtanen K. A., Lidell M. E., Orava J., Heglind M., Westergren R., Niemi T., Taittonen M., Laine J., Savisto N. J., Enerbäck S., Nuutila P. (2009) Functional brown adipose tissue in healthy adults. N. Engl. J. Med. 360, 1518–1525 [DOI] [PubMed] [Google Scholar]
- 13. Maunakea A. K., Chepelev I., Zhao K. (2010) Epigenome mapping in normal and disease states. Circ. Res. 107, 327–339 [DOI] [PMC free article] [PubMed] [Google Scholar]
- 14. Bäckdahl L., Bushell A., Beck S. (2009) Inflammatory signalling as mediator of epigenetic modulation in tissue-specific chronic inflammation. Int J Biochem. Cell Biol. 41, 176–184 [DOI] [PubMed] [Google Scholar]
- 15. Dambacher S., Hahn M., Schotta G. (2010) Epigenetic regulation of development by histone lysine methylation. Heredity 105, 24–37 [DOI] [PubMed] [Google Scholar]
- 16. Edwards T. M., Myers J. P. (2007) Environmental exposures and gene regulation in disease etiology. Environ. Health Perspect. 115, 1264–1270 [DOI] [PMC free article] [PubMed] [Google Scholar]
- 17. Skinner M. K., Manikkam M., Guerrero-Bosagna C. (2010) Epigenetic transgenerational actions of environmental factors in disease etiology. Trends Endocrinol. Metab. 21, 214–222 [DOI] [PMC free article] [PubMed] [Google Scholar]
- 18. Campión J., Milagro F. I., Martínez J. A. (2009) Individuality and epigenetics in obesity. Obes. Rev. 10, 383–392 [DOI] [PubMed] [Google Scholar]
- 19. Holness M. J., Sugden M. C. (2006) Epigenetic regulation of metabolism in children born small for gestational age. Curr. Opin. Clin. Nutr. Metab. Care 9, 482–488 [DOI] [PubMed] [Google Scholar]
- 20. Ling C., Groop L. (2009) Epigenetics: a molecular link between environmental factors and type 2 diabetes. Diabetes 58, 2718–2725 [DOI] [PMC free article] [PubMed] [Google Scholar]
- 21. Maier S., Olek A. (2002) Diabetes: a candidate disease for efficient DNA methylation profiling. J. Nutr. 132, 2440S–2443S [DOI] [PubMed] [Google Scholar]
- 22. Szarc vel Szic K., Ndlovu M. N., Haegeman G., Vanden Berghe W. (2010) Nature or nurture: let food be your epigenetic medicine in chronic inflammatory disorders. Biochem. Pharmacol. 80, 1816–1832 [DOI] [PubMed] [Google Scholar]
- 23. Uldry M., Yang W., St-Pierre J., Lin J., Seale P., Spiegelman B. M. (2006) Complementary action of the PGC-1 coactivators in mitochondrial biogenesis and brown fat differentiation. Cell Metab. 3, 333–341 [DOI] [PubMed] [Google Scholar]
- 24. Seale P., Kajimura S., Yang W., Chin S., Rohas L. M., Uldry M., Tavernier G., Langin D., Spiegelman B. M. (2007) Transcriptional control of brown fat determination by PRDM16. Cell Metab. 6, 38–54 [DOI] [PMC free article] [PubMed] [Google Scholar]
- 25. Ge K. (2012) Epigenetic regulation of adipogenesis by histone methylation. Biochim. Biophys. Acta 1819, 727–732 [DOI] [PMC free article] [PubMed] [Google Scholar]
- 26. Hong S., Cho Y. W., Yu L. R., Yu H., Veenstra T. D., Ge K. (2007) Identification of JmjC domain-containing UTX and JMJD3 as histone H3 lysine 27 demethylases. Proc. Natl. Acad. Sci. U.S.A. 104, 18439–18444 [DOI] [PMC free article] [PubMed] [Google Scholar]
- 27. Wang L., Jin Q., Lee J. E., Su I. H., Ge K. (2010) Histone H3K27 methyltransferase Ezh2 represses Wnt genes to facilitate adipogenesis. Proc. Natl. Acad. Sci. U.S.A. 107, 7317–7322 [DOI] [PMC free article] [PubMed] [Google Scholar]
- 28. Iida A., Iwagawa T., Kuribayashi H., Satoh S., Mochizuki Y., Baba Y., Nakauchi H., Furukawa T., Koseki H., Murakami A., Watanabe S. (2014) Histone demethylase Jmjd3 is required for the development of subsets of retinal bipolar cells. Proc. Natl. Acad. Sci. U.S.A. 111, 3751–3756 [DOI] [PMC free article] [PubMed] [Google Scholar]
- 29. Lewis P. W., Müller M. M., Koletsky M. S., Cordero F., Lin S., Banaszynski L. A., Garcia B. A., Muir T. W., Becher O. J., Allis C. D. (2013) Inhibition of PRC2 activity by a gain-of-function H3 mutation found in pediatric glioblastoma. Science 340, 857–861 [DOI] [PMC free article] [PubMed] [Google Scholar]
- 30. Ntziachristos P., Tsirigos A., Welstead G. G., Trimarchi T., Bakogianni S., Xu L., Loizou E., Holmfeldt L., Strikoudis A., King B., Mullenders J., Becksfort J., Nedjic J., Paietta E., Tallman M. S., Rowe J. M., Tonon G., Satoh T., Kruidenier L., Prinjha R., Akira S., Van Vlierberghe P., Ferrando A. A., Jaenisch R., Mullighan C. G., Aifantis I. (2014) Contrasting roles of histone 3 lysine 27 demethylases in acute lymphoblastic leukaemia. Nature 514, 513–517 [DOI] [PMC free article] [PubMed] [Google Scholar]
- 31. Xue B., Rim J. S., Hogan J. C., Coulter A. A., Koza R. A., Kozak L. P. (2007) Genetic variability affects the development of brown adipocytes in white fat but not in interscapular brown fat. J. Lipid Res. 48, 41–51 [DOI] [PubMed] [Google Scholar]
- 32. Rajakumari S., Wu J., Ishibashi J., Lim H. W., Giang A. H., Won K. J., Reed R. R., Seale P. (2013) EBF2 determines and maintains brown adipocyte identity. Cell Metab. 17, 562–574 [DOI] [PMC free article] [PubMed] [Google Scholar]
- 33. Cao Q., Wang X., Jia L., Mondal A. K., Diallo A., Hawkins G. A., Das S. K., Parks J. S., Yu L., Shi H., Shi H., Xue B. (2014) Inhibiting DNA Methylation by 5-Aza-2′-deoxycytidine ameliorates atherosclerosis through suppressing macrophage inflammation. Endocrinology 155, 4925–4938 [DOI] [PMC free article] [PubMed] [Google Scholar]
- 34. Shi H., Moustaid-Moussa N., Wilkison W. O., Zemel M. B. (1999) Role of the sulfonylurea receptor in regulating human adipocyte metabolism. FASEB J. 13, 1833–1838 [DOI] [PubMed] [Google Scholar]
- 35. Zhao X., Sternsdorf T., Bolger T. A., Evans R. M., Yao T. P. (2005) Regulation of MEF2 by histone deacetylase 4- and SIRT1 deacetylase-mediated lysine modifications. Mol. Cell. Biol. 25, 8456–8464 [DOI] [PMC free article] [PubMed] [Google Scholar]
- 36. Yang X., Wang X., Liu D., Yu L., Xue B., Shi H. (2014) Epigenetic regulation of macrophage polarization by DNA methyltransferase 3b. Mol. Endocrinol. 28, 565–574 [DOI] [PMC free article] [PubMed] [Google Scholar]
- 37. Shi H., Kokoeva M. V., Inouye K., Tzameli I., Yin H., Flier J. S. (2006) TLR4 links innate immunity and fatty acid-induced insulin resistance. J. Clin. Invest. 116, 3015–3025 [DOI] [PMC free article] [PubMed] [Google Scholar]
- 38. Shi H., Tzameli I., Bjørbaek C., Flier J. S. (2004) Suppressor of cytokine signaling 3 is a physiological regulator of adipocyte insulin signaling. J. Biol. Chem. 279, 34733–34740 [DOI] [PubMed] [Google Scholar]
- 39. Xue B., Coulter A., Rim J. S., Koza R. A., Kozak L. P. (2005) Transcriptional synergy and the regulation of Ucp1 during brown adipocyte induction in white fat depots. Mol. Cell. Biol. 25, 8311–8322 [DOI] [PMC free article] [PubMed] [Google Scholar]
- 40. Gaydos L. J., Wang W., Strome S. (2014) Gene repression. H3K27me and PRC2 transmit a memory of repression across generations and during development. Science 345, 1515–1518 [DOI] [PMC free article] [PubMed] [Google Scholar]
- 41. Kozak U. C., Kopecky J., Teisinger J., Enerbäck S., Boyer B., Kozak L. P. (1994) An upstream enhancer regulating brown-fat-specific expression of the mitochondrial uncoupling protein gene. Mol. Cell. Biol. 14, 59–67 [DOI] [PMC free article] [PubMed] [Google Scholar]
- 42. Grégoire S., Xiao L., Nie J., Zhang X., Xu M., Li J., Wong J., Seto E., Yang X. J. (2007) Histone deacetylase 3 interacts with and deacetylates myocyte enhancer factor 2. Mol. Cell. Biol. 27, 1280–1295 [DOI] [PMC free article] [PubMed] [Google Scholar]
- 43. Handschin C., Rhee J., Lin J., Tarr P. T., Spiegelman B. M. (2003) An autoregulatory loop controls peroxisome proliferator-activated receptor gamma coactivator 1alpha expression in muscle. Proc. Natl. Acad. Sci. U.S.A. 100, 7111–7116 [DOI] [PMC free article] [PubMed] [Google Scholar]
- 44. Cao R., Wang L., Wang H., Xia L., Erdjument-Bromage H., Tempst P., Jones R. S., Zhang Y. (2002) Role of histone H3 lysine 27 methylation in Polycomb-group silencing. Science 298, 1039–1043 [DOI] [PubMed] [Google Scholar]
- 45. Jin Q., Yu L. R., Wang L., Zhang Z., Kasper L. H., Lee J. E., Wang C., Brindle P. K., Dent S. Y., Ge K. (2011) Distinct roles of GCN5/PCAF-mediated H3K9ac and CBP/p300-mediated H3K18/27ac in nuclear receptor transactivation. EMBO J. 30, 249–262 [DOI] [PMC free article] [PubMed] [Google Scholar]
- 46. Shore A., Karamitri A., Kemp P., Speakman J. R., Lomax M. A. (2010) Role of Ucp1 enhancer methylation and chromatin remodelling in the control of Ucp1 expression in murine adipose tissue. Diabetologia 53, 1164–1173 [DOI] [PMC free article] [PubMed] [Google Scholar]
- 47. Tateishi K., Okada Y., Kallin E. M., Zhang Y. (2009) Role of Jhdm2a in regulating metabolic gene expression and obesity resistance. Nature 458, 757–761 [DOI] [PMC free article] [PubMed] [Google Scholar]
- 48. Wang L., Xu S., Lee J. E., Baldridge A., Grullon S., Peng W., Ge K. (2013) Histone H3K9 methyltransferase G9a represses PPARγ expression and adipogenesis. EMBO J. 32, 45–59 [DOI] [PMC free article] [PubMed] [Google Scholar]
- 49. Ishibashi J., Seale P. (2010) Medicine. Beige can be slimming. Science 328, 1113–1114 [DOI] [PMC free article] [PubMed] [Google Scholar]
- 50. Seale P., Bjork B., Yang W., Kajimura S., Chin S., Kuang S., Scimè A., Devarakonda S., Conroe H. M., Erdjument-Bromage H., Tempst P., Rudnicki M. A., Beier D. R., Spiegelman B. M. (2008) PRDM16 controls a brown fat/skeletal muscle switch. Nature 454, 961–967 [DOI] [PMC free article] [PubMed] [Google Scholar]
- 51. Wu J., Boström P., Sparks L. M., Ye L., Choi J. H., Giang A. H., Khandekar M., Virtanen K. A., Nuutila P., Schaart G., Huang K., Tu H., van Marken Lichtenbelt W. D., Hoeks J., Enerbäck S., Schrauwen P., Spiegelman B. M. (2012) Beige adipocytes are a distinct type of thermogenic fat cell in mouse and human. Cell 150, 366–376 [DOI] [PMC free article] [PubMed] [Google Scholar]
- 52. Guerra C., Koza R. A., Yamashita H., Walsh K., Kozak L. P. (1998) Emergence of brown adipocytes in white fat in mice is under genetic control. Effects on body weight and adiposity. J. Clin. Invest. 102, 412–420 [DOI] [PMC free article] [PubMed] [Google Scholar]
- 53. Brito N. A., Brito M. N., Bartness T. J. (2008) Differential sympathetic drive to adipose tissues after food deprivation, cold exposure or glucoprivation. Am. J. Physiol. Regul. Integr. Comp. Physiol. 294, R1445–R1452 [DOI] [PubMed] [Google Scholar]
- 54. Vaughan C. H., Zarebidaki E., Ehlen J. C., Bartness T. J. (2014) Analysis and measurement of the sympathetic and sensory innervation of white and brown adipose tissue. Methods Enzymol. 537, 199–225 [DOI] [PMC free article] [PubMed] [Google Scholar]
- 55. Long J. Z., Svensson K. J., Tsai L., Zeng X., Roh H. C., Kong X., Rao R. R., Lou J., Lokurkar I., Baur W., Castellot J. J., Jr., Rosen E. D., Spiegelman B. M. (2014) A smooth muscle-like origin for beige adipocytes. Cell Metab. 19, 810–820 [DOI] [PMC free article] [PubMed] [Google Scholar]
- 56. Shinoda K., Luijten I. H., Hasegawa Y., Hong H., Sonne S. B., Kim M., Xue R., Chondronikola M., Cypess A. M., Tseng Y. H., Nedergaard J., Sidossis L. S., Kajimura S. (2015) Genetic and functional characterization of clonally derived adult human brown adipocytes. Nat. Med. 21, 389–394 [DOI] [PMC free article] [PubMed] [Google Scholar]
- 57. Finck B. N., Kelly D. P. (2006) PGC-1 coactivators: inducible regulators of energy metabolism in health and disease. J. Clin. Invest. 116, 615–622 [DOI] [PMC free article] [PubMed] [Google Scholar]
- 58. Lin J., Handschin C., Spiegelman B. M. (2005) Metabolic control through the PGC-1 family of transcription coactivators. Cell Metab. 1, 361–370 [DOI] [PubMed] [Google Scholar]
- 59. Rim J. S., Kozak L. P. (2002) Regulatory motifs for CREB-binding protein and Nfe2l2 transcription factors in the upstream enhancer of the mitochondrial uncoupling protein 1 gene. J. Biol. Chem. 277, 34589–34600 [DOI] [PubMed] [Google Scholar]
- 60. Cao W., Daniel K. W., Robidoux J., Puigserver P., Medvedev A. V., Bai X., Floering L. M., Spiegelman B. M., Collins S. (2004) p38 mitogen-activated protein kinase is the central regulator of cyclic AMP-dependent transcription of the brown fat uncoupling protein 1 gene. Mol. Cell. Biol. 24, 3057–3067 [DOI] [PMC free article] [PubMed] [Google Scholar]
- 61. Herzig S., Long F., Jhala U. S., Hedrick S., Quinn R., Bauer A., Rudolph D., Schutz G., Yoon C., Puigserver P., Spiegelman B., Montminy M. (2001) CREB regulates hepatic gluconeogenesis through the coactivator PGC-1. Nature 413, 179–183 [DOI] [PubMed] [Google Scholar]