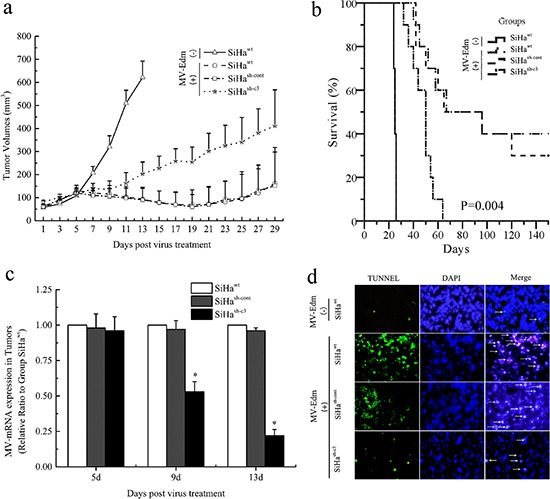
Figure 6. Deficiency in caspase 3 correlated with tumor response to oncolytic therapy in mice.

a. The increase in tumor volume after initiation of MV-Edm therapy. The data were presented as means ± SD. b. Kaplan–Meier survival curves of mice from different groups. c. The replication of MV-Edm in the xenografs was evaluated with qPCR. The data were presented as means ± SD. d. Morphological changes of apoptosis in vivo of SiHa cancer model. White arrows indicate apoptotic cells (TUNEL stain, × 200). *means P < 0.05.
