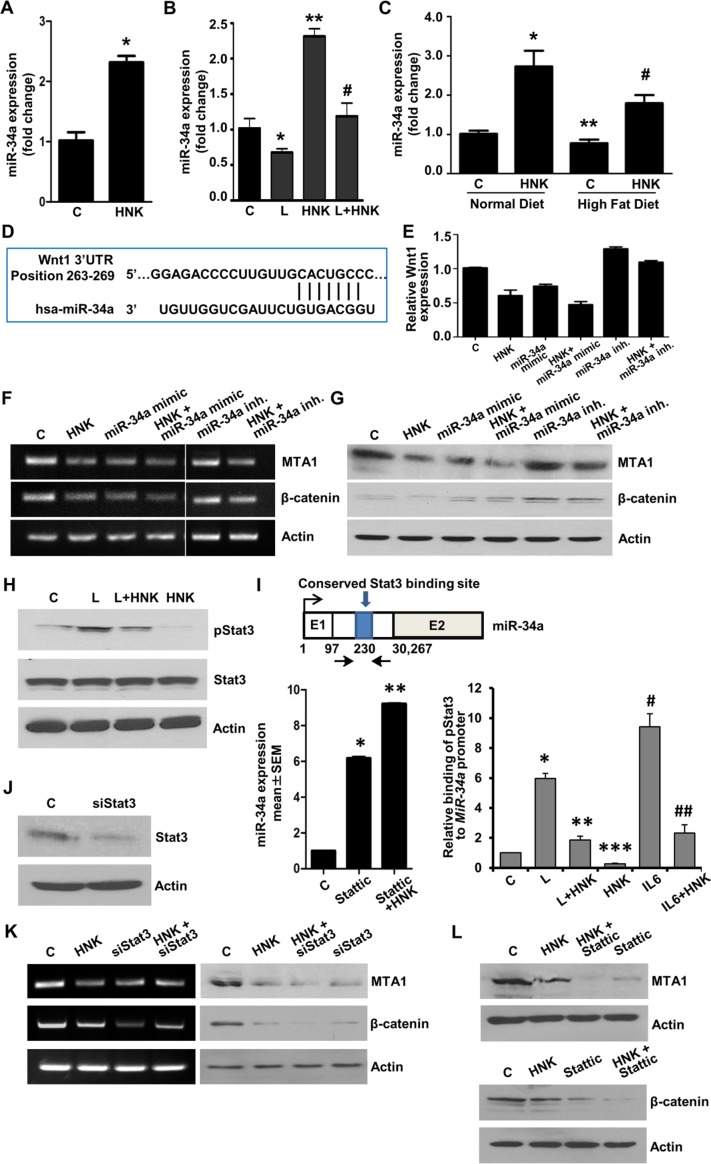
Figure 6. Involvement of miR-34a in HNK-mediated inhibition of MTA1-β-catenin axis and role of Stat3 inhibition in HNK-mediated miR34a upregulation and MTA1-β-catenin axis inhibition.
A. Expression levels of miR-34a in breast cancer cells treated with 5 μM HNK. *, P < 0.001, compared with untreated controls B. Expression levels of miR-34a in breast cancer cells treated with 100 ng/ml leptin and 5 μM HNK alone and in combination. *, P < 0.005, compared with controls; **, P < 0.001, compared to controls; #, P < 0.005, compared with leptin-treated cells. C. Expression levels of miR-34a in tumor samples from high-fat-diet (HFD) fed obese mice group +vehicle, normal-diet (ND) fed non-obese mice group + vehicle, HFD+HNK and ND+HNK is quantified by using TaqMan MicroRNA Assays-based RT-PCR. *, P < 0.001, compared with ND controls; **, P < 0.005, compared to ND controls; #, P < 0.001, compared with HFD controls. D. Schematic representation of the predicted miR-34a MREs within the 3′UTR of the Wnt1 mRNA. Alignment between the miR-34a binding site and miR-34a is shown. E. Breast cancer cells were transfected with miR-34a inhibitor or miR-34a mimic followed by treatment with vehicle (C) or HNK as indicated. Wnt1 expression was analyzed using real-time PCR analysis. F, G. Breast cancer cells were transfected with miR-34a inhibitor or miR-34a mimic followed by treatment with vehicle (C) or HNK as indicated. RT-PCR analysis F. and immunoblot analysis G. of MTA1, and β-catenin was performed. Actin was used as control. H. Immunoblot analysis of phosphorylated-Stat3, and Stat3 in breast cancer cells treated with 5 μM HNK and 100ng/ml leptin alone and in combination as indicated. I. Schematic shows map of the human MIR-34A genomic region with the indicated conserved Stat3-binding site. Expression levels of miR-34a in breast cancer cells treated with 5 μM HNK and 10 μM Stattic as indicated. *, P < 0.005, compared with controls (C); **, P < 0.005, compared to Stattic. ChIP analysis of Stat3 recruitment at the human MIR-34A in breast cancer cells treated with 100ng/ml leptin (L), 5 μM HNK and IL-6 as indicated. *, P < 0.001, compared with controls; **, P < 0.001, compared to L; ***, P < 0.001, compared to C; #, P < 0.001, compared to C; ##, P < 0.001, compared to Il-6. J. Breast cancer cells were transfected with siStat3 or control miR and expression of Stat3 was analyzed using immunoblotting. K. RT-PCR analysis of MTA1 and β-catenin in breast cancer cells transfected with siStat3 and treated with 5 μM HNK as indicated. L. Immunoblot analysis of MTA1 and β-catenin in breast cancer cells treated with 5 μM HNK and 10 μM Stattic as indicated.

