

Abstract
Liquid biopsies, examinations of tumor components in body fluids, have shown promise for predicting clinical outcomes. To evaluate tumor-associated genomic and genetic variations in plasma cell-free DNA (cfDNA) and their associations with treatment response and overall survival, we applied whole genome and targeted sequencing to examine the plasma cfDNAs derived from 20 patients with advanced prostate cancer. Sequencing-based genomic abnormality analysis revealed locus-specific gains or losses that were common in prostate cancer, such as 8q gains, AR amplifications, PTEN losses and TMPRSS2-ERG fusions. To estimate tumor burden in cfDNA, we developed a Plasma Genomic Abnormality (PGA) score by summing the most significant copy number variations. Cox regression analysis showed that PGA scores were significantly associated with overall survival (p < 0.04). After androgen deprivation therapy or chemotherapy, targeted sequencing showed significant mutational profile changes in genes involved in androgen biosynthesis, AR activation, DNA repair, and chemotherapy resistance. These changes may reflect the dynamic evolution of heterozygous tumor populations in response to these treatments. These results strongly support the feasibility of using non-invasive liquid biopsies as potential tools to study biological mechanisms underlying therapy-specific resistance and to predict disease progression in advanced prostate cancer.
Keywords: prostate cancer, liquid biopsy, plasma, cell free DNA, next generation sequencing
INTRODUCTION
Androgen deprivation therapy (ADT) has been used to treat advanced prostate cancer since 1941 [1]. In 2011, more than one-third of the estimated 2.71 million prostate cancer patients in the United States received ADT (http://seer.cancer.gov/). Response to ADT in the hormone-sensitive prostate cancer (HSPC) lasts from a few months to several years (median 18-30 months). To date, there are no known predictive factors for duration of ADT response. After the emergence of castration-resistant prostate cancer (CRPC), several new systemic anti-cancer therapies with overall survival benefit are currently considered [2]. A biochemical response to these treatments is often estimated by PSA levels. However, this estimate may be unreliable due to disease heterogeneity. Development of more sensitive and specific assays to monitor the treatment response is clearly needed.
Traditional biopsies use solid tumor tissues to assess genomic architecture. However, multiple or serial traditional biopsies can be impractical because they are potentially hazardous to patients and technically challenging. Recently, the assessment of tumor-released DNA in body fluids such as cell-free DNAs (cfDNAs) in plasma has shown promise in being able to capture the net effect of the host-tumor genetic fraction in cancer patients [3-5]. Critically, whole genome sequencing has revealed significant copy number variations (CNVs) both in somatic tumor tissues as well as in the cfDNA fractions of cancer patients [6-10]. As a result of the accessibility of sampling as well as the ability to capture the genetic heterogeneity of cancer in peripheral fluids, there has been a growing interest in developing tumor-derived cfDNA as a biomarker for detecting the presence of malignancies, monitoring treatment response, judging prognosis, or evaluating recurrence [3-19]. The examination of tumor components including circulating tumor cells and nucleic acids such as cfDNA in body fluids is often referred to as a liquid biopsy [3-5].
To determine tumor-related genomic abnormalities in plasma cfDNAs and their association with treatment response and clinical outcome, we performed whole genome sequencing-based CNV and targeted sequencing-based mutational analysis in cfDNAs derived from patients with advanced prostate cancer. To precisely reflect tumor burden and estimate treatment response, we developed two scoring algorithms based on a composite score from the cfDNA genomic abnormality profiles. Our results demonstrate that non-invasive liquid biopsy technology is feasible and has potential to serve as a powerful tool for personalized management of advanced prostate cancer.
RESULTS
Overall cfDNA genomic abnormality in advanced prostate cancer patients
We examined three samples for each patient including pre-treatment cfDNA, post-treatment cfDNA and matched lymphocyte-derived germline DNA (gDNA). Whole genome sequencing generated approximately14.48 million (ranged from 9.19 to 21.72) mappable reads per sample and ~4,560 mappable reads per genomic bin window (1Mb). CNV analysis using log2 ratios between cfDNA and matched gDNA showed somatic genomic abnormalities in all 20 patients tested. Overall, we observed more genomic abnormalities in the CRPC cohort undergoing chemotherapy than in the HSPC cohort receiving ADT alone (Supplementary Figure S1).
To further define the CNVs, we performed a detailed analysis at chromosomal regions showing frequent aberrations in prostate cancer. Among these, the genomic region at the androgen receptor (AR) was most frequently reported to be amplified [20, 21]. To examine the amplification status, we zoomed into the genomic region containing AR and observed AR locus amplification in 1 of 10 HSPC (#1080) and 3 of 10 CRPC cases (#1010, #1043 and #1060) (Figure 1). Another common genomic aberration in prostate cancer was various fusion genes at the TMPRSS2 locus [22, 23]. We observed two CRPC patients (#1003 and #1005) with genomic loss and two patients with genomic gain - one CRPC patient (#1060) and one HSPC patient (#1050). Both genomic losses resulted in the TMPRSS2-ERG fusion gene (Figure 1). Interestingly, the genomic loss at the TMPRSS2 locus was present in two CRPC patients with a pathological diagnosis of small cell carcinoma (neuro-endocrine origin). These two patients did not show AR amplification. The third most common genomic abnormality was PTEN deletion [24, 25], which was detected in four CRPC cases (#1003, #1005, #1014 and #1060) but not in any of the HSPC cases (Figure 1).
Figure 1. cfDNA genomic abnormalities detected at specific chromosomal loci.
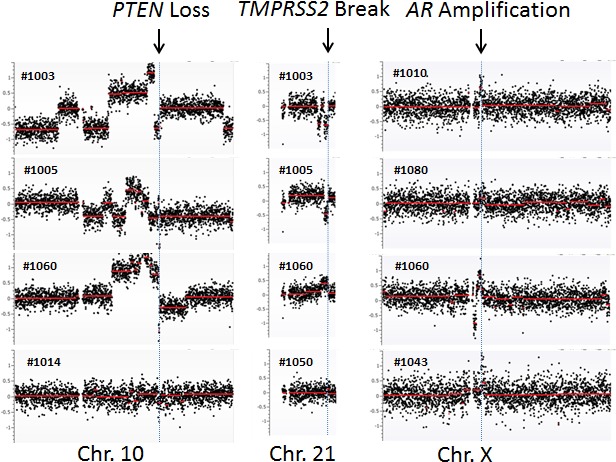
PTEN loss at chromosome 10, TMPRSS2 at chromosome 21, and AR amplification at chromosome X are shown. Arrows indicate the locations of these chromosomal aberrations.
Plasma genomic abnormality (PGA) score and its clinical association
To quantify the tumor DNA fraction in cfDNA, we summed the squared 95th-99th absolute log2 ratios as the PGA score. Similar to gross chromosomal abnormality, the PGA scores were significantly higher in the CRPC cohort than in the HSPC cohort (Figure 2). To estimate potential association of PGA scores with overall survival, we performed Cox regression analysis in 19 of the 20 patients with complete follow-up data. We found that elevated PGA scores in pre-treatment samples were significantly associated with short survival (p = 0.01, 95% CI = 1.01-1.08). We also observed this association in post-treatment samples (p = 0.04, 95% CI = 1.00-1.20). Among the 20 patients, 7 were classified as having high volume disease (Table 1), defined by the presence of either a visceral (non-lymph nodal) metastasis or >4 bone lesions with at least one present outside the spine or pelvis skeleton at the time of initiating chemotherapy for the CRPC stage. Five of the 7 high volume cancer patients showed high initial PGA scores (cutoff value >10) but only 1 of 13 low volume patients demonstrated high initial PGA score (p = 0.005, unpaired t test) (Figure 3).
Figure 2. Plasma genomic abnormality (PGA) scores in 20 patients with advanced prostate cancer.

Higher PGA scores indicated more tumor-associated somatic abnormalities in cfDNA and were associated with disease progression and overall survival.
Table 1. Clinical characteristics of 20 advanced prostate cancer patients.
| Patient ID | Age at time of Diagnosis (years) | Patient Group | Treatment | Gleason store at diagnosis | TNM staging at diagnosis | Metastatic status before treatment* | PSA (ng/ml) at time of 1st sample collection in advanced stage | PSA (ng/ml) attime of 2nd sample collection in advanced stage | Time period (days) between two sample collections | Vital status Alive=0; Dead=1 | Follow-up time (months) |
|---|---|---|---|---|---|---|---|---|---|---|---|
| 1001 | 62 | CRPC | Chemo | 9 | T4N1M1 | High Volume | 8.2 | 0.42 | 147 | 0 | 37.12 |
| 1002 | 66 | CRPC | Chemo | 7 | T2cNxM0 | Low Volume | 9.3 | 1.6 | 89 | 1 | 17.23 |
| 1003 | 54 | CRPC | Chemo | 7 | T3aN0M0 | High Volume | 107 | 162 | 84 | 1 | 644 |
| 1004 | 69 | CRPC | Chemo | 8 | T3aNxM0 | Low Volume | 3.4 | 4.6 | 92 | 0 | 49.18 |
| 1005 | 69 | CRPC | Chemo | 9 | T3bN1M0 | High Volume | 0.48 | 0.1 | 146 | 1 | 9.07 |
| 1010 | 72 | CRPC | Chemo | 9 | T3bN1M0 | High Volume | 5 | NA | 144 | 1 | 21.53 |
| 1014 | 61 | CRPC | Chemo | 7 | T2bN1M1 | High Volume | 126 | 56.8 | 99 | 1 | 19.82 |
| 1017 | 63 | CRPC | Chemo | 5 | T2aN0M0 | Low Volume | 22 | 104 | 139 | 0 | 16.21 |
| 1043 | 73 | CRPC | Chemo | 7 | T2aNxM1 | High Volume | 15.5 | 8 | 80 | 0 | 32.22 |
| 1060 | 78 | CRPC | Chemo | 7 | TxNxM1 | High Volume | 3.7 | 1.4 | 104 | 1 | 18.48 |
| 1015 | 67 | HSPC | ADT | 7 | T2cNxM0 | Low Volume | 1 | 0.9 | 98 | 0 | 53.77 |
| 1028 | 49 | HSPC | ADT | 9 | T3bN0M0 | Low Volume | 0.33 | 0.12 | 154 | 0 | 95.27 |
| 1040 | 53 | HSPC | ADT | 9 | T2NxM0 | Low Volume | 2.5 | <0.10 | 168 | 0 | 42.93 |
| 1050 | 64 | HSPC | ADT | 9 | T3bN1M1 | Low Volume | 4.2 | <0.10 | 136 | 0 | 57.47 |
| 1054 | 81 | HSPC | ADT | 7 | T2aNxM0 | Low Volume | 6A | <0.10 | 154 | 1 | 54.33 |
| 1059 | 62 | HSPC | ADT | 9 | T3bN1M0 | Low Volume | 2.9 | <0.10 | 116 | 0 | 55.20 |
| 1080 | 65 | HSPC | ADT | 8 | T3bN1M0 | Low Volume | 16 | 0.77 | 172 | 0 | 49.27 |
| 1084 | 57 | HSPC | ADT | 9 | T3bN0M0 | High Volume | 2.2 | 0.24 | 78 | 0 | 53.80 |
| 1098 | 78 | HSPC | ADT | 6 | T2aNxM0 | Low Volume | 5.7 | 0.54 | 131 | 0 | NA |
| 1104 | 67 | HSPC | ADT | 9 | T2cN1M1 | Low Volume | 37 | <0.10 | 99 | 0 | 51.60 |
High Volume Metastatic disease definition: 4 or more metastatic skeletal lesions on hone scan with at least I of the 4 being present outside the pelvic or spinal skeleton and/or presence of visceral metastatic disease (non lymph node disease)
Figure 3. PGA score differences between high and low volume prostate cancer patients (see main text for definition).

Average PGA score before treatment is significantly lower in low volume patients (n = 13) than in high volume patients (n = 7).
For the 10 HSPC patients undergoing ADT, PGA score changes between treatments were minor. This was attributable to relatively low tumor burden in this group of patients. After a median follow-up time of 53.8 months (range 42-95 months), only one patient (#1054) was deceased due to disease. This patient showed relatively high PGA scores in both pre- and post-ADT in the HSPC cohort (Figure 2). For the 10 CRPC patients receiving chemotherapy, the patients with the highest initial PGA score included #1003, 1005 and 1060. All three patients died with relatively short survival time. To estimate patients' response to treatment, we calculated their Treatment Efficacy (TEff) indexes by transforming PGA score differences between pre- and post-treatments (see method section). We found that the TEff indexes in patients 1003, 1005, and 1060 were 2, 8, and 42, respectively. Correspondingly, their overall survival times were 6, 9 and 18 months (Figure 4).
Figure 4. Comparison of PGA scores and TEff indexes in three representative CRPC patients.
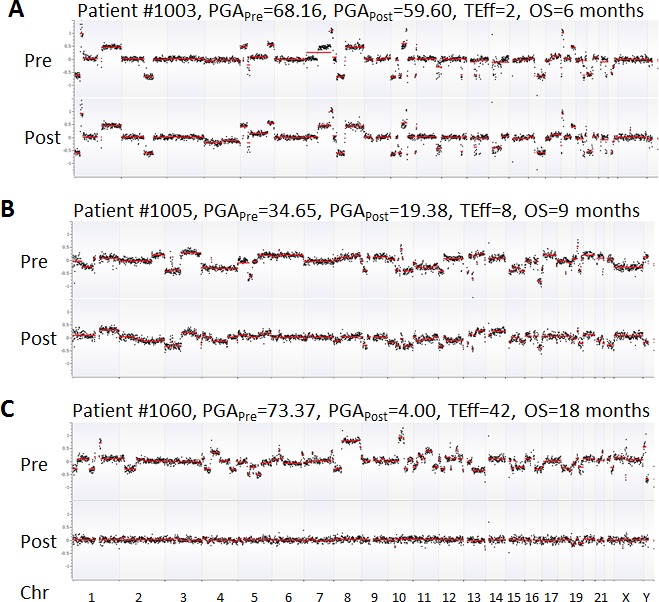
Chromosomes were shown on the x axis while GC-adjusted log2 ratios (black dots) in 1Mb windows were on the y axis. Red lines indicate the trend of copy number variations. Complete, partial and no responses to chemotherapy were displayed in A (patient 1060), B (patient 1005), and C (patient 1003), respectively. OS = overall survival.
Cancer gene mutational profiles
To identify somatic mutations in cfDNAs, we performed the targeted sequencing of 578 cancer-related genes in the 20 patients. The average mapped reads per patient was 14.46 million (range 9.11-19.74) with 44% of reads on target (range 41-48%). Sequences of all samples achieved a mean coverage of 79x (range 54-87). Among 10 HSPC patients, we identified somatic mutations in 66 genes in pre-ADT and 68 genes in post-ADT samples after removing constitutional polymorphisms (cfDNA vs. matched gDNA). Of these mutated genes, 17 were shared between pre- and post-treatment samples. Among 10 CRPC patients, we identified somatic mutations in 52 genes in pre-chemotherapy and 63 genes in post-chemotherapy samples, of which 18 genes were shared (Supplementary Tables S1-S4). To validate these mutations, we applied allele-specific PCR (AS-PCR) to examine 26 mutations in 41 samples with mutations found by sequencing technology. AS-PCR successfully confirmed 20 of these mutations (Supplementary Figure S2). The remaining 6 mutations were uncertain due to difficulty in establishing high quality AS-PCR assays.
Gene mutation profile changes between pre- and post-treatment
To examine treatment-associated pathway alterations, we analyzed the two patient cohorts separately. Overall, we observed 34 and 35 pathways showing >3 gene differences between pre- and post-treatment samples in the HSPC and CRPC cohorts, respectively. Compared to pre-treatment samples, mutations in post-treatment samples were more diverse, reflecting more pathways involved. For HSPC patients, we observed more gene mutations in post- than in pre-treatment samples in all pathways (Figure 5). Interestingly, the genes involving androgen biosynthesis and metabolism including androgen signaling, estrogen receptor signaling and GNRH signaling pathways were among the most commonly mutated. For example, GNRH signaling pathway is a target of ADT and contains 22 genes. Of those, only 1 gene mutation was detected before ADT but 7 gene mutations were detected after ADT.
Figure 5. Mutational profile changes between pre-ADT and post-ADT.
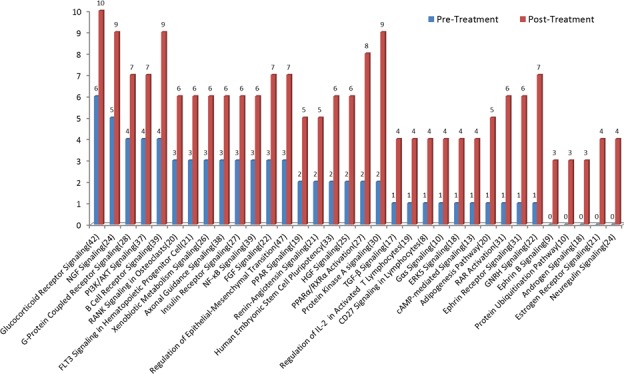
Gene mutation pathway enrichment analysis was performed in the HSPC cohort receiving standard ADT. More gene mutations were observed in post- than in pre-treatment samples. Pathways involved in androgen biosynthesis, metabolism, and androgen receptor activation are among the most commonly mutated.
For CRPC patients, 20 of 35 pathways had gene mutations in post-treatment patients only. The most common mutations in the post-treatment group included axonal guidance signaling, protein kinase A signaling and renin-angiotensin signaling pathways. Meanwhile, 6 pathways showed less gene mutations in post- than in pre-treatment samples (Figure 6). The most common mutations before chemotherapy occurred in DNA repair-related hereditary breast cancer signaling genes. Among 41 genes in the pathway, 7 mutations were detected in the pre-treatment but only 1 mutation was found in the post-treatment samples.
Figure 6. Mutational profile changes between pre- and post-chemotherapy.
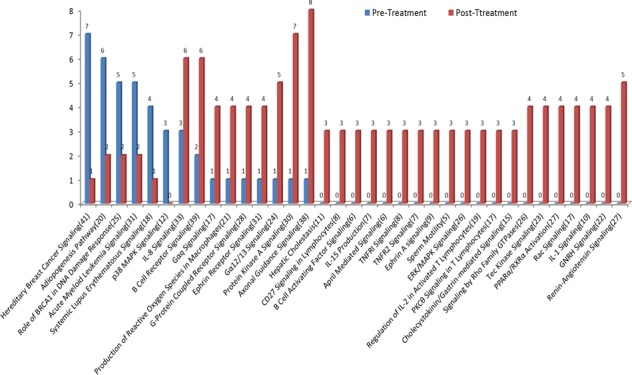
Many mutations detected after chemotherapy were not present in pre-treatment samples. The most common mutations in pre-treatment samples were in DNA repair-related hereditary breast cancer signaling pathways. The most common mutations in post-treatment samples occurred in the pathways related to AR regulation and resistance to chemotherapy including axonal guidance signaling, protein kinase A signaling, and renin-angiotensin signaling pathways.
DISCUSSION
Cancer is characterized by massive genomic abnormalities, some of which are targets for therapy or are used for monitoring response to specific treatments. Recent studies have reported that genomic abnormalities in cfDNA resemble genomic signatures of primary tumors in human cancers [3-5, 13]. In this study, we examined plasma cfDNAs in advanced prostate cancer and were able to detect somatic mutations and genomic aberrations in all of the patients after accounting for constitutional genomic abnormalities. These aberrations were often different between pre- and post-treatment, reflecting dynamic genomic evolution during stage-specific therapies. Our results suggest that somatic alterations in cfDNA may serve as sensitive biomarkers for predicting treatment response and clinical outcome in advanced prostate cancer.
To examine the repertoire of genomic aberrations in tumor tissues, biopsies are often performed. However, tissue biopsy in advanced prostate cancer is challenging because bone metastasis are predominant. Many patients do not have residual disease at their primary site due to surgical removal of the prostate. Biopsies at sites of bone or nodal metastasis are invasive, morbid, and inaccurate. These biopsies are subject to sampling bias and may not represent the overall tumor mass. Due to these limitations, liquid biopsy by sensitive detection of tumor components has emerged as an attractive alternative option. This approach is minimally invasive and can be more frequently scheduled in clinical laboratories. Because blood stream contains the cfDNAs derived from all tumor sites, the liquid biopsy assay may detect more complete repertoire of tumor genome variations [3-5, 10, 13]. It has been shown that tumor genomic abnormalities are well reflected in cfDNA during cancer progression [7, 8]. By comparing the differences between multiregional sequencing of 2 synchronous cancer tissues and shotgun sequencing of cfDNA, Chan et al show that cfDNA sequencing is able to detect genomic variations originated from different tumor sites [10]. Recently, Schutz et al found that cfDNA genomic variations are able to distinguish both benign prostatic hypertrophy and prostatitis from prostate cancer with accuracy of 90% [17]. Clearly, liquid biopsy may provide a useful tool for cancer detection, monitoring and research.
To estimate tumor DNA content, previous studies applied “genomewide z-score” [7] or “PA-score” [8]. However, these algorithms may not accurately reflect tumor DNA contribution to cfDNA because tumor genomes are not always altered in all genome segments. In addition, calculations of these scores require cfDNAs derived from a group of normal individuals as reference controls. Due to the germline-determined CNVs pre-existing in any given individual, these algorithms may generate significant bias toward the regions with pre-existing CNVs. To address this issue, we normalized cfDNA read counts using lymphcyte gDNA read counts from the same patient, significantly minimizing the biases caused by pre-existing CNVs. Additionally, we developed the PGA scoring system by summing the most significant genomic regions, avoiding potential background noises from other scoring algorithms. Our data show that PGA scores and TEff indexes are potentially useful to assess treatment response and overall survival.
Targeted sequencing in cfDNA has demonstrated potential clinical utility in guiding selection of targeted therapies [26]. By analyzing mutational profiles before and after initiating ADT, we were able to detect increased mutant genes after ~4 months of ADT in several critical pathways, including protein kinase A signaling, the PPARα/RXRα activation and GNRH signaling pathways. These pathways are associated with AR activation [27] and androgen biosynthesis [28]. One key mutated gene in these pathways is EP300, a crucial gene for prostate cancer cell proliferation [29] and hormone responsiveness of AR [30]. We also found more gene mutations in the glucocorticoid receptor (GR) signaling pathway after ADT. GR expression is stimulated by castration therapy, a mechanism that compensates for AR signaling blockade and promotes CRPC progression [31, 32]. Currently, preclinical models are often used to define the mechanisms of resistance to a specific treatment, but it is generally difficult to confirm these findings in clinical samples. Our results suggest that cfDNA-based genetic analysis may provide a powerful and easily accessible approach for studying tumor resistance in real patient samples.
Many mutations detected after treatments were not present in pre-treatment samples. These non-overlapping mutations are of interest as they may provide novel insights into the evolution of tumor genomes in response to therapy or serve as predictive biomarker for treatment response and/or prognostic biomarkers for survival. For example, PRKAR1A and NFKB2 were found to be mutated after chemotherapy. PRKAR1A is functionally linked to AR during the progression of prostate cancer [33]. Its overexpression is observed in advanced prostate cancer [33, 34] and may cause resistance to chemotherapy [35]. NFKB can be activated by the chemotherapy drug (docetaxel) and contributes to treatment resistance in prostate cancer [36-38]. These results are consistent with the common notion that stage-specific therapies increase tumor cell subpopulations carrying treatment-resistant mutations and proportionally reduce cell subpopulations carrying treatment-sensitive mutations.
In summary, we applied next generation sequencing to test cfDNAs for somatic variations in advanced prostate cancer. We developed a new scoring algorithm to estimate tumor DNA burden and predict patient's response to a specific therapy. We found that genetic and genomic profile changes after treatments are clinically and biologically associated with response to stage-specific therapies. Although the study examined a limited number of patients, the results from this study strongly support that DNA-based liquid biopsy has great potential to serve as alternative means to examine tumor genetic changes in advanced prostate cancer. Further studies are needed to justify the clinical utility of cfDNA as useful biomarker to predict treatment response and clinical outcomes.
MATERIALS AND METHODS
Sample collection
Plasma specimens from two separate cohorts of advanced prostate cancer patients were randomly selected from a hospital-based registry for biomarker development in advanced prostate cancer. Details of patient enrollment have been previously reported [39]. The plasma was derived from EDTA-treated blood. All plasma was separated within 2 hours after blood draw and frozen immediately at −80ÐC without any freeze-thaw cycle before use. Patient characteristics are presented in Table 1. Each patient provided plasma collected just before treatment and plasma collected approximately four months after initiating stage-specific therapy. The treatments were initiated after collection of the first specimen. Castration levels of testosterone (total testosterone < 50ng/dl) were confirmed at the time of the second sample collection. This study was approved by Institutional Review Boards at both the Medical College of Wisconsin and Mayo Clinic.
DNA extraction and sequencing library preparation
Blood plasma samples underwent a second centrifugation at 3000 rpm for 10 min before DNA extraction. The cfDNAs were extracted from 400-800μl of plasma using QIAamp DNA Blood Mini Kit (QIAGEN, Valencia, CA, USA). The final DNA eluent (50μl) was quantified by a Qubit 2.0 Fluorometer (Life Technology, Carlsbad, CA, USA) and stored at −80°C until use. DNA libraries were prepared using a NEXTflex DNA-Seq Kit (BIOO Scientific Corporation, Austin, TX, USA). Libraries were pooled for paired-end sequencing on a HiSeq2000 Sequencing System (Illumina, San Diego, CA, USA).
CNV calculation
Raw sequencing data (fastq files) were first mapped to the human genome (hg19) (DNASTAR, Madison, WI). Read counts from the mapped sequence files were then binned into 1Mb windows (total 3113 genomic bins) and adjusted to the global mean count for each sample. The read count ratio in each genomic bin was calculated by comparing cfDNA to lymphocyte gDNA derived from the same patient to account for constitutional CNVs. The resulting ratios were further log2 transformed and corrected for GC content [40]. The fully normalized log2 ratios in genomic bins were subjected to segmentation using the copy number analysis method (CNAM) algorithm (Golden Helix, Bozeman, MT).
PGA score and TEff index
To quantify the genomic abnormality and facilitate comparison between different samples, we defined the ith percentile of absolute log2 ratios (ALRs) as ALR.i and calculated the sum of all squared ALRs between ALR.95 and ALR.99, where ALR.95 was considered as the minimum threshold of genomic abnormality. We named this summed value “Plasma Genomic Abnormality (PGA) score”. A higher score indicates greater tumor DNA fraction in the cfDNA. The top one percentile ALRs were excluded to avoid over-estimation of genomic abnormalities because some samples showed extensive CNVs at telomere or centromere regions (Supplementary Figure S3). Although we couldn't exclude possibility of true CNV changes (for example, gene amplification), we believe that the extreme CNV changes in the regions were more likely caused by high sequence homologs and relatively low quality sequencing libraries. To quantify treatment response in each patient, we defined the TEff (Treatment Efficacy) index as the log2 ratio of PGA scores between the pre- and post-treatments: TEff index=log2(prePGA/postPGA) x10. A TEff index of less than or close to zero indicates no response to treatment while a higher TEff index is indicative of a better treatment response.
Targeted sequencing
The Comprehensive Cancer Panel (Roche NimbleGen, Madison, WI) was used for targeted sequencing. The panel covers 4Mb genomic sequences and targets 578 cancer-related genes. The genes were captured from sequencing libraries made for CNV analysis according to Roche NimbleGen's manual. Final enriched libraries were subjected to 100bp PE sequencing on a HiSeq2000 Sequencing System. Gene mutations were detected by comparing cfDNA to lymphocyte gDNA in the same patient with 2% variant alleles as the cutoff for mutation calls.
Allele specific PCR
Allele specific PCR (AS-PCR) was used to validate sequencing-detected mutations. For each mutation, three primers were designed with one common primer and two mutant-specific primers. Reactions were performed in a 25μl reaction with 4ng of pre-amplified DNA and 0.5 unit of Taq DNA polymerase (New England Biolab, Ipswich, MA). This DNA polymerase does not have 3′-5′ exonuclease activity and therefore is suitable for AS-PCR. Amplifications were carried out in a thermal cycler (Eppendorf Mastercycler pro S) including initial denaturation for 60sec at 95°C, 40 cycles of denaturation for 30sec at 95°C, annealing for 30sec at primer-dependent temperatures (Supplementary Table S5), and extension for 40sec at 72°C.
Mutation pathway enrichment analysis
To examine the functional classifications of mutant genes, we applied Ingenuity Pathway Analysis (IPA, Qiagen, CA) and treated the 578 cancer-related genes as background reference. For mutant genes, we searched for mutational profile differences between pre- and post-treatment samples. We defined >3 gene differences in a specific pathway between pre- and post-treatments as the cutoff for mutational profile changes. This analysis was useful to determine critical pathways in response to stage-specific therapy.
SUPPLEMENTARY MATERIAL FIGURES AND TABLES
Acknowledgments
We thank the HMGC Sequencing Core at Medical College of Wisconsin for providing DNA sequencing service and Great Lakes Genomics Center for providing the computational resources. This study was supported by Advancing a Healthier Wisconsin fund (Project# 5520227) and National Institute of Health (CA157881) to LW, and by John P. Vaile and Joseph and Gail Gassner Development funds for prostate cancer research, and also the study was supported by Mayo Clinic Center for Individualized Medicine to MK.
Footnotes
CONFLICTS OF INTEREST STATEMENT
The authors disclose no potential conflicts of interest.
REFERENCES
- 1.Huggins C, Hodges CV. Studies on prostatic cancer: I. The effect of castration, of estrogen and of androgen injection on serum phosphatases in metastatic carcinoma of the prostate. 1941. J Urol. 2002;168:9–12. doi: 10.1016/s0022-5347(05)64820-3. [DOI] [PubMed] [Google Scholar]
- 2.Kohli M, Tindall DJ. New developments in the medical management of prostate cancer. Mayo Clin Proc. 2010;85:77–86. doi: 10.4065/mcp.2009.0442. [DOI] [PMC free article] [PubMed] [Google Scholar]
- 3.Crowley E, Di Nicolantonio F, Loupakis F, Bardelli A. Liquid biopsy: monitoring cancer-genetics in the blood. Nat Rev Clin Oncol. 2013;10:472–484. doi: 10.1038/nrclinonc.2013.110. [DOI] [PubMed] [Google Scholar]
- 4.Diaz LA, Jr, Bardelli A. Liquid biopsies: genotyping circulating tumor DNA. J Clin Oncol. 2014;32:579–586. doi: 10.1200/JCO.2012.45.2011. [DOI] [PMC free article] [PubMed] [Google Scholar]
- 5.Heitzer E, Ulz P, Geigl JB. Circulating tumor DNA as a liquid biopsy for cancer. Clin Chem. 2015;61:112–123. doi: 10.1373/clinchem.2014.222679. [DOI] [PubMed] [Google Scholar]
- 6.Ni X, Zhuo M, Su Z, Duan J, Gao Y, Wang Z, Zong C, Bai H, Chapman AR, Zhao J, Xu L, An T, Ma Q, Wang Y, Wu M, Sun Y, et al. Reproducible copy number variation patterns among single circulating tumor cells of lung cancer patients. Proc Natl Acad Sci U S A. 2013;110:21083–21088. doi: 10.1073/pnas.1320659110. [DOI] [PMC free article] [PubMed] [Google Scholar]
- 7.Leary RJ, Sausen M, Kinde I, Papadopoulos N, Carpten JD, Craig D, O'Shaughnessy J, Kinzler KW, Parmigiani G, Vogelstein B, Diaz LA, Jr, Velculescu VE. Detection of chromosomal alterations in the circulation of cancer patients with whole-genome sequencing. Sci Transl Med. 2012;4:162ra154. doi: 10.1126/scitranslmed.3004742. [DOI] [PMC free article] [PubMed] [Google Scholar]
- 8.Heitzer E, Ulz P, Belic J, Gutschi S, Quehenberger F, Fischereder K, Benezeder T, Auer M, Pischler C, Mannweiler S, Pichler M, Eisner F, Haeusler M, Riethdorf S, Pantel K, Samonigg H, et al. Tumor-associated copy number changes in the circulation of patients with prostate cancer identified through whole-genome sequencing. Genome Med. 2013;5:30. doi: 10.1186/gm434. [DOI] [PMC free article] [PubMed] [Google Scholar]
- 9.Murtaza M, Dawson SJ, Tsui DW, Gale D, Forshew T, Piskorz AM, Parkinson C, Chin SF, Kingsbury Z, Wong AS, Marass F, Humphray S, Hadfield J, Bentley D, Chin TM, Brenton JD, et al. Non-invasive analysis of acquired resistance to cancer therapy by sequencing of plasma DNA. Nature. 2013;497:108–112. doi: 10.1038/nature12065. [DOI] [PubMed] [Google Scholar]
- 10.Chan KC, Jiang P, Zheng YW, Liao GJ, Sun H, Wong J, Siu SS, Chan WC, Chan SL, Chan AT, Lai PB, Chiu RW, Lo YM. Cancer genome scanning in plasma: detection of tumor-associated copy number aberrations, single-nucleotide variants, and tumoral heterogeneity by massively parallel sequencing. Clin Chem. 2013;59:211–224. doi: 10.1373/clinchem.2012.196014. [DOI] [PubMed] [Google Scholar]
- 11.Kaiser J. Medicine. Keeping tabs on tumor DNA. Science. 2010;327:1074. doi: 10.1126/science.327.5969.1074. [DOI] [PubMed] [Google Scholar]
- 12.Heitzer E, Auer M, Hoffmann EM, Pichler M, Gasch C, Ulz P, Lax S, Waldispuehl-Geigl J, Mauermann O, Mohan S, Pristauz G, Lackner C, Hofler G, Eisner F, Petru E, Sill H, et al. Establishment of tumor-specific copy number alterations from plasma DNA of patients with cancer. Int J Cancer. 2013;133:346–356. doi: 10.1002/ijc.28030. [DOI] [PMC free article] [PubMed] [Google Scholar]
- 13.Farris C, Trimarchi JM. Plasma-seq: a novel strategy for metastatic prostate cancer analysis. Genome Med. 2013;5:35. doi: 10.1186/gm439. [DOI] [PMC free article] [PubMed] [Google Scholar]
- 14.Mohan S, Heitzer E, Ulz P, Lafer I, Lax S, Auer M, Pichler M, Gerger A, Eisner F, Hoefler G, Bauernhofer T, Geigl JB, Speicher MR. Changes in colorectal carcinoma genomes under anti-EGFR therapy identified by whole-genome plasma DNA sequencing. PLoS Genet. 2014;10:e1004271. doi: 10.1371/journal.pgen.1004271. [DOI] [PMC free article] [PubMed] [Google Scholar]
- 15.Forshew T, Murtaza M, Parkinson C, Gale D, Tsui DW, Kaper F, Dawson SJ, Piskorz AM, Jimenez-Linan M, Bentley D, Hadfield J, May AP, Caldas C, Brenton JD, Rosenfeld N. Noninvasive identification and monitoring of cancer mutations by targeted deep sequencing of plasma DNA. Sci Transl Med. 2012;4:136ra168. doi: 10.1126/scitranslmed.3003726. [DOI] [PubMed] [Google Scholar]
- 16.Dawson SJ, Tsui DW, Murtaza M, Biggs H, Rueda OM, Chin SF, Dunning MJ, Gale D, Forshew T, Mahler-Araujo B, Rajan S, Humphray S, Becq J, Halsall D, Wallis M, Bentley D, et al. Analysis of circulating tumor DNA to monitor metastatic breast cancer. N Engl J Med. 2013;368:1199–1209. doi: 10.1056/NEJMoa1213261. [DOI] [PubMed] [Google Scholar]
- 17.Schutz E, Akbari MR, Beck J, Urnovitz H, Zhang WW, Bornemann-Kolatzki K, Mitchell WM, Nam RK, Narod SA. Chromosomal instability in cell-free DNA is a serum biomarker for prostate cancer. Clin Chem. 2015;61(1):239–248. doi: 10.1373/clinchem.2014.226571. [DOI] [PubMed] [Google Scholar]
- 18.Lebofsky R, Decraene C, Bernard V, Kamal M, Blin A, Leroy Q, Rio Frio T, Pierron G, Callens C, Bieche I, Saliou A, Madic J, Rouleau E, Bidard FC, Lantz O, Stern MH, et al. Circulating tumor DNA as a non-invasive substitute to metastasis biopsy for tumor genotyping and personalized medicine in a prospective trial across all tumor types. Mol Oncol. 2014 doi: 10.1016/j.molonc.2014.12.003. [DOI] [PMC free article] [PubMed] [Google Scholar]
- 19.Bettegowda C, Sausen M, Leary RJ, Kinde I, Wang Y, Agrawal N, Bartlett BR, Wang H, Luber B, Alani RM, Antonarakis ES, Azad NS, Bardelli A, Brem H, Cameron JL, Lee CC, et al. Detection of circulating tumor DNA in early- and late-stage human malignancies. Sci Transl Med. 2014;6:224ra224. doi: 10.1126/scitranslmed.3007094. [DOI] [PMC free article] [PubMed] [Google Scholar]
- 20.Koivisto P, Kononen J, Palmberg C, Tammela T, Hyytinen E, Isola J, Trapman J, Cleutjens K, Noordzij A, Visakorpi T, Kallioniemi OP. Androgen receptor gene amplification: a possible molecular mechanism for androgen deprivation therapy failure in prostate cancer. Cancer research. 1997;57:314–319. [PubMed] [Google Scholar]
- 21.Taplin ME, Balk SP. Androgen receptor: a key molecule in the progression of prostate cancer to hormone independence. J Cell Biochem. 2004;91:483–490. doi: 10.1002/jcb.10653. [DOI] [PubMed] [Google Scholar]
- 22.Loeb S, Bruinsma SM, Nicholson J, Briganti A, Pickles T, Kakehi Y, Carlsson SV, Roobol MJ. Active Surveillance for Prostate Cancer: A Systematic Review of Clinicopathologic Variables and Biomarkers for Risk Stratification. Eur Urol. 2014 doi: 10.1016/j.eururo.2014.10.010. [DOI] [PMC free article] [PubMed] [Google Scholar]
- 23.Yao Y, Wang H, Li B, Tang Y. Evaluation of the TMPRSS2:ERG fusion for the detection of prostate cancer: a systematic review and meta-analysis. Tumour Biol. 2014;35:2157–2166. doi: 10.1007/s13277-013-1286-x. [DOI] [PubMed] [Google Scholar]
- 24.Yoshimoto M, Ludkovski O, DeGrace D, Williams JL, Evans A, Sircar K, Bismar TA, Nuin P, Squire JA. PTEN genomic deletions that characterize aggressive prostate cancer originate close to segmental duplications. Genes Chromosomes Cancer. 2012;51:149–160. doi: 10.1002/gcc.20939. [DOI] [PubMed] [Google Scholar]
- 25.Phin S, Moore MW, Cotter PD. Genomic Rearrangements of PTEN in Prostate Cancer. Front Oncol. 2013;3:240. doi: 10.3389/fonc.2013.00240. [DOI] [PMC free article] [PubMed] [Google Scholar]
- 26.Narayan A, Carriero NJ, Gettinger SN, Kluytenaar J, Kozak KR, Yock TI, Muscato NE, Ugarelli P, Decker RH, Patel AA. Ultrasensitive measurement of hotspot mutations in tumor DNA in blood using error-suppressed multiplexed deep sequencing. Cancer Res. 2012;72:3492–3498. doi: 10.1158/0008-5472.CAN-11-4037. [DOI] [PMC free article] [PubMed] [Google Scholar]
- 27.Nazareth LV, Weigel NL. Activation of the human androgen receptor through a protein kinase A signaling pathway. J Biol Chem. 1996;271:19900–19907. doi: 10.1074/jbc.271.33.19900. [DOI] [PubMed] [Google Scholar]
- 28.Limonta P, Manea M. Gonadotropin-releasing hormone receptors as molecular therapeutic targets in prostate cancer: Current options and emerging strategies. Cancer Treat Rev. 2013;39:647–663. doi: 10.1016/j.ctrv.2012.12.003. [DOI] [PubMed] [Google Scholar]
- 29.Heemers HV, Sebo TJ, Debes JD, Regan KM, Raclaw KA, Murphy LM, Hobisch A, Culig Z, Tindall DJ. Androgen deprivation increases p300 expression in prostate cancer cells. Cancer Res. 2007;67:3422–3430. doi: 10.1158/0008-5472.CAN-06-2836. [DOI] [PubMed] [Google Scholar]
- 30.Choi KC, Park S, Lim BJ, Seong AR, Lee YH, Shiota M, Yokomizo A, Naito S, Na Y, Yoon HG. Procyanidin B3, an inhibitor of histone acetyltransferase, enhances the action of antagonist for prostate cancer cells via inhibition of p300-dependent acetylation of androgen receptor. Biochem J. 2011;433:235–244. doi: 10.1042/BJ20100980. [DOI] [PubMed] [Google Scholar]
- 31.Xie N, Cheng H, Lin D, Liu L, Yang O, Jia L, Fazli L, Gleave ME, Wang Y, Rennie P, Dong X. The expression of glucocorticoid receptor is negatively regulated by active androgen receptor signaling in prostate tumors. Int J Cancer. 2014 doi: 10.1002/ijc.29147. [DOI] [PubMed] [Google Scholar]
- 32.Arora VK, Schenkein E, Murali R, Subudhi SK, Wongvipat J, Balbas MD, Shah N, Cai L, Efstathiou E, Logothetis C, Zheng D, Sawyers CL. Glucocorticoid receptor confers resistance to antiandrogens by bypassing androgen receptor blockade. Cell. 2013;155:1309–1322. doi: 10.1016/j.cell.2013.11.012. [DOI] [PMC free article] [PubMed] [Google Scholar]
- 33.Sarwar M, Sandberg S, Abrahamsson PA, Persson JL. Protein kinase A (PKA) pathway is functionally linked to androgen receptor (AR) in the progression of prostate cancer. Urol Oncol. 2014;32:25, e21–12. doi: 10.1016/j.urolonc.2012.08.019. [DOI] [PubMed] [Google Scholar]
- 34.Merkle D, Hoffmann R. Roles of cAMP and cAMP-dependent protein kinase in the progression of prostate cancer: cross-talk with the androgen receptor. Cell Signal. 2011;23:507–515. doi: 10.1016/j.cellsig.2010.08.017. [DOI] [PubMed] [Google Scholar]
- 35.Loilome W, Juntana S, Namwat N, Bhudhisawasdi V, Puapairoj A, Sripa B, Miwa M, Saya H, Riggins GJ, Yongvanit P. PRKAR1A is overexpressed and represents a possible therapeutic target in human cholangiocarcinoma. Int J Cancer. 2011;129:34–44. doi: 10.1002/ijc.25646. [DOI] [PubMed] [Google Scholar]
- 36.Marin-Aguilera M, Codony-Servat J, Reig O, Lozano JJ, Fernandez PL, Pereira MV, Jimenez N, Donovan M, Puig P, Mengual L, Bermudo R, Font A, Gallardo E, Ribal MJ, Alcaraz A, Gascon P, et al. Epithelial-to-mesenchymal transition mediates docetaxel resistance and high risk of relapse in prostate cancer. Mol Cancer Ther. 2014;13:1270–1284. doi: 10.1158/1535-7163.MCT-13-0775. [DOI] [PubMed] [Google Scholar]
- 37.Codony-Servat J, Marin-Aguilera M, Visa L, Garcia-Albeniz X, Pineda E, Fernandez PL, Filella X, Gascon P, Mellado B. Nuclear factor-kappa B and interleukin-6 related docetaxel resistance in castration-resistant prostate cancer. Prostate. 2013;73:512–521. doi: 10.1002/pros.22591. [DOI] [PubMed] [Google Scholar]
- 38.O'Neill AJ, Prencipe M, Dowling C, Fan Y, Mulrane L, Gallagher WM, O'Connor D, O'Connor R, Devery A, Corcoran C, Rani S, O'Driscoll L, Fitzpatrick JM, Watson RW. Characterisation and manipulation of docetaxel resistant prostate cancer cell lines. Mol Cancer. 2011;10:126. doi: 10.1186/1476-4598-10-126. [DOI] [PMC free article] [PubMed] [Google Scholar]
- 39.Huang X, Yuan T, Liang M, Du M, Xia S, Dittmar R, Wang D, See W, Costello BA, Quevedo F, Tan W, Nandy D, Bevan GH, Longenbach S, Sun Z, Lu Y, et al. Exosomal miR-1290 and miR-375 as prognostic markers in castration-resistant prostate cancer. Eur Urol. 2015;67:33–41. doi: 10.1016/j.eururo.2014.07.035. [DOI] [PMC free article] [PubMed] [Google Scholar]
- 40.Diskin SJ, Li M, Hou C, Yang S, Glessner J, Hakonarson H, Bucan M, Maris JM, Wang K. Adjustment of genomic waves in signal intensities from whole-genome SNP genotyping platforms. Nucleic Acids Res. 2008;36:e126. doi: 10.1093/nar/gkn556. [DOI] [PMC free article] [PubMed] [Google Scholar]
Associated Data
This section collects any data citations, data availability statements, or supplementary materials included in this article.