Abstract
Background
In patients at increased surgical risk, TAVR with a self-expanding bioprosthesis is associated with improved 1-year survival compared with AVR. However, elderly patients may be just as concerned with quality of life improvement as with prolonged survival as a goal of treatment.
Objectives
To compare the health status outcomes for patients treated with either self-expanding transcatheter aortic valve replacement (TAVR) or surgical aortic valve replacement (AVR).
Methods
Between 2011 and 2012, 795 patients with severe aortic stenosis at increased surgical risk were randomized to TAVR or AVR in the CoreValve US Pivotal Trial. Health status was assessed at baseline, 1 month, 6 months, and 1 year using the Kansas City Cardiomyopathy Questionnaire (KCCQ), SF-12, and EQ-5D; growth curve models were used to examine changes over time.
Results
Over the 1-year follow-up period, disease-specific and generic health status improved substantially for both treatment groups. At 1-month, there was a significant interaction between the benefit of TAVR over AVR and access site. Among surviving patients eligible for iliofemoral (IF) access, there was a clinically relevant early benefit with TAVR across all disease-specific and generic health status measures. Among the non-IF cohort; however, most health status measures were similar for TAVR and AVR, although there was a trend toward early benefit with TAVR on the SF-12 physical health scale. There were no consistent differences in health status between TAVR and AVR at the later time points.
Conclusions
Health status improved substantially in surviving patients with increased surgical risk who were treated with either self-expanding TAVR or AVR. TAVR via the IF route was associated with better early health status compared with AVR, but there was no early health status benefit with non-IF TAVR compared with AVR.
Keywords: transcatheter aortic valve replacement, aortic stenosis, quality of life, health status
While patients with severe aortic stenosis previously had to choose between surgical aortic valve replacement (AVR) or medical therapy, over the last decade transcatheter aortic valve replacement (TAVR) has emerged as a viable alternative to these treatment options. Less invasive than AVR, TAVR with a balloon-expandable valve has been shown to have superior outcomes compared with medical therapy for both mortality(1) and quality of life(2). Among patients at increased risk for surgery, balloon-expandable TAVR has similar late outcomes to AVR(3), although TAVR performed via the transfemoral route did show improved early quality of life compared with AVR(4).
Recently, an alternative TAVR platform with a self-expanding bioprosthesis (CoreValve; Medtronic, Inc., Minneapolis, MN) was shown to be associated with improved survival at 1 year compared with AVR in patients at increased surgical risk(5). While improved survival is an unequivocally important benefit of the CoreValve, how this device affects patients’ symptoms, functional status, and quality of life, compared with AVR, is unknown. Since the self-expanding bioprosthesis differs from the balloon-expandable valve in terms of the device itself, the risk of particular complications (e.g., paravavular regurgitation, new pacemaker) and in the device delivery (e.g., smaller sheath size, different alternative access sites), the health status outcomes of patients treated with these different devices may also be different. These outcomes are particularly important, since elderly patients with multiple comorbidities—the typical population for whom TAVR would be considered—may be more concerned with quality of life than prolonged survival(6–7). To address this gap in knowledge, we used data from the CoreValve US High Risk Pivotal Trial to compare the health status outcomes for patients with aortic stenosis who are at increased surgical risk and are treated with either self-expanding TAVR or AVR.
METHODS
Patient population and study protocol
The design of the CoreValve US High Risk Pivotal Trial, including inclusion and exclusion criteria, study procedures, and follow-up protocols, was published previously(5). Briefly, the trial enrolled patients with severe, symptomatic aortic stenosis who were considered at increased risk for perioperative mortality with AVR. Severe aortic stenosis was defined as 1) aortic valve area ≤0.8 cm2 or aortic valve area index ≤0.5 cm2/m2 and 2) mean aortic valve gradient of >40 mmHg or peak aortic jet velocity of >4.0 m/sec. Patients also had to have New York Heart Association (NYHA) class II or higher heart failure symptoms and be considered to be at increased surgical risk—defined as a risk of death within 30 days after surgery of ≥15%, as estimated by two cardiac surgeons and one interventional cardiologist at the investigative site. Patient risk eligibility was also confirmed by consensus among at least two senior cardiac surgeons and one interventional cardiologist who were members of the national screening committee.
The approach for the TAVR procedure (iliofemoral [IF] or non-iliofemoral [NIF—performed either via subclavian artery or direct aortic approach]) was determined using computed tomography. Patients were then randomly assigned in a 1:1 ratio to treatment with TAVR or AVR. Randomization was stratified according to investigational site and intended access site (IF or NIF). The study was approved by the institutional review board at each investigational site, and all patients provided written informed consent.
Health status measures
Disease-specific and generic health status were assessed at baseline, and at 1 month, 6 months, and 1 year after enrollment using validated written questionnaires. Baseline questionnaires were administered in person after enrollment but prior to the implant procedure. Follow-up questionnaires were administered by mail from a central coordinating center. Surveys that were not returned by mail in a timely fashion were administered by telephone interview. Non-English speakers completed validated translations of the questionnaires.
Disease-specific health status was assessed by means of the Kansas City Cardiomyopathy Questionnaire (KCCQ)(8), a 23-item self-administered questionnaire that has been shown to be a reliable and valid measure of symptoms, functional status and quality of life in patients with heart failure symptoms, including those with severe, symptomatic aortic stenosis(9). The KCCQ assesses specific health domains—physical limitation, symptoms, quality of life, social limitation, and self-efficacy—the first 4 of which are combined into an overall summary score, which was the predefined primary endpoint for this study. Values for all KCCQ domains and the summary score range from 0 to 100, with higher scores indicating less symptom burden and better quality of life. The KCCQ overall summary score generally correlates with New York Heart Association functional class as follows: Class I: KCCQ 75 to 100; Class II: 60 to 74; Class III: 45 to 59; Class IV: 0 to 44.(9–10) Changes in the KCCQ of 5, 10, and 20 points correspond to small, moderate or large clinical improvements, respectively(10).
Generic health status was evaluated with the Medical Outcomes Study Short-Form 12 (SF-12) questionnaire(11) and the EuroQol (EQ-5D)(12). Derived from the Short-Form 36, the SF-12 provides mental and physical summary scores that are scaled to overall U.S. norms of 50 and a standard deviation of 10, with higher scores indicating better quality of life(11). The minimum clinically important difference for the SF-12 physical and mental summary scores is ~2 points(13). The EQ-5D is a generic health status measure consisting of 5 domains (mobility, self-care, usual activities, pain/discomfort, and anxiety/depression) that can be converted to utilities using an algorithm developed for the US population(14). Utilities are preference-based health status measures and range from 0 to 1, with 1 representing perfect health and 0 corresponding to the worst imaginable health state(15).
In addition to examining the disease-specific and generic health status of survivors, we also examined rates of acceptable and favorable outcomes after TAVR using definitions that combines mortality and quality of life into a single outcome(16). As previously described, an acceptable outcome was defined as the presence of all of the following at 6 months: 1) alive; 2) KCCQ overall summary score ≥45 (roughly equivalent to NYHA class III or better); and 3) stability or improvement in the KCCQ score from baseline to 6 months (decrease of <10 points). A favorable outcome was defined as all of the following at 1 year: 1) alive; 2) KCCQ overall summary score ≥60 (roughly equivalent to NYHA Class I-II); and 3) stability or improvement in the KCCQ score from baseline to 6 months (decrease of <10 points)(17).
Statistical analysis
The primary analysis compared the health status of patients randomized to TAVR vs. AVR on an intention-to-treat basis. As a secondary analysis, we compared treatments using a per protocol approach, where patients were included only if they received their assigned treatment via the assigned access route. Baseline characteristics, including health status, were compared between groups using 2-sample Student t-tests for continuous variables and chi-square tests for categorical variables. Mean follow-up health status scores at 1 month, 6 months, and 1 year were compared with baseline within each treatment group using paired Student t-tests. Rates of acceptable and favorable outcomes at 6 months and 1 year, respectively, were compared between groups using chi-square tests.
For each of the primary and secondary health status outcomes, longitudinal random-effects growth curve models were used to examine the relative impact of TAVR versus AVR over time(18). These growth curve models incorporate all available health status data from all follow-up time points, including those for patients who subsequently died, withdrew from the study, or were lost to follow-up. The models included baseline health status, TAVR access site (IF vs. NIF), treatment assignment, and the interaction between access site and treatment group. The pre-defined analytic plan specified that if a significant interaction (p<0.05) between treatment assignment and access site was observed on the KCCQ overall summary score at any time point, then all health status outcomes would be analyzed separately for the IF and NIF groups. The models also considered age, sex, and severe chronic obstructive pulmonary disease. The intercept and linear effects of time were estimated using both fixed and random effects. Cubic and quadratic effects of time were considered (both terms were not included in the same model to avoid over-parameterization) as well as all 2- and 3-way interactions between treatment, time, and TAVR access site. Starting with the highest order time-by-treatment interaction, variables were retained in the model if p<0.05 using a backward stepwise selection process. Estimates of differences in mean scores between treatment groups and 95% confidence intervals were obtained at each follow-up time point from these growth curve models. All analyses were performed using SAS version 9.3 (SAS Institute, Cary, North Carolina), and all tests were 2-tailed with a nominal type 1 error rate of 5% and no adjustments for multiple comparisons.
RESULTS
Patient population
From 2011 to 2012, 795 patients with severe, symptomatic aortic stenosis from 45 US centers were randomized to either self-expanding TAVR (n=394) or AVR (n=401) in the CoreValve US High Risk Pivotal Trial. Health status data were available for 709 patients (89%) at baseline, which formed our analytic cohort. Overall, the patients were elderly (mean age 83 years), had a high burden of cardiac and non-cardiac comorbidities, had severe aortic stenosis (average mean gradient 48 mm Hg), and had substantial functional limitations due to heart failure symptoms (67% NYHA III, 19% NYHA IV). Frailty indicators were common, with 9% of patients not living independently, low serum albumin (a marker of chronic disease) in 16% of patients, and an average 5-meter walk time of 9.5 seconds (gait speed ≥6 seconds is considered slow and a marker of frailty).
Eighty-four percent of patients were eligible for iliofemoral access (IF) while 16% required non-iliofemoral access (NIF), which was performed either via subclavian artery or direct aortic approach. The baseline characteristics of these patients, stratified by access site (IF vs. NIF), are shown in Table 1. Patients who required NIF access generally had more cardiac comorbidities, more peripheral vascular disease, and lower body weights compared with those who were eligible for IF access. The treatment groups were well-matched, with only minor differences between groups.
Table 1.
Baseline Characteristics and Health Status, Stratified by Access Site
| Iliofemoral | Non-Iliofemoral | |||||
|---|---|---|---|---|---|---|
| TAVR (n=315) |
AVR (n=280) |
P value | TAVR (n=61) |
AVR (n=53) |
P value | |
| Demographic and clinical characteristics | ||||||
| Age (years) | 83.4 ± 6.9 | 83.5 ± 6.3 | 0.851 | 81.9 ± 8.1 | 83.4 ± 6.5 | 0.282 |
| Male sex | 53.3% | 53.2% | 0.977 | 50.8% | 50.9% | 0.989 |
| Previous myocardial infarction | 22.2% | 23.9% | 0.622 | 37.7% | 28.3% | 0.288 |
| Previous bypass surgery | 30.8% | 30.4% | 0.908 | 21.3% | 34.0% | 0.130 |
| Previous angioplasty | 33.0% | 38.6% | 0.158 | 44.3% | 37.7% | 0.480 |
| Prior balloon valvuloplasty | 4.8% | 6.8% | 0.288 | 13.1% | 7.5% | 0.334 |
| Previous permanent pacemaker | 24.1% | 22.5% | 0.640 | 16.4% | 17.0% | 0.933 |
| Previous stroke or TIA | 17.1% | 19.3% | 0.498 | 14.8% | 32.7% | 0.024 |
| Peripheral vascular disease | 36.9% | 37.1% | 0.962 | 62.3% | 67.9% | 0.530 |
| Atrial fibrillation/flutter | 41.0% | 49.3% | 0.041 | 41.7% | 39.6% | 0.825 |
| Chronic lung disease | 44.8% | 46.1% | 0.749 | 44.3% | 34.0% | 0.262 |
| Home oxygen | 13.7% | 11.8% | 0.487 | 8.2% | 5.7% | 0.722 |
| Diabetes mellitus | 33.0% | 43.9% | 0.006 | 39.3% | 39.6% | 0.976 |
| Chronic kidney disease | 0.975 | 0.927 | ||||
| Stage 4–5 | 10.5% | 10.4% | 14.8% | 13.2% | ||
| Stage 3 | 60.0% | 60.4% | 57.4% | 60.4% | ||
| Disease severity | ||||||
| Left ventricular ejection fraction (%) | 58.0 ± 11.1 | 57.3 ± 11.8 | 0.472 | 57.1 ± 13.6 | 58.6 ± 12.6 | 0.563 |
| Mean aortic valve gradient (mm Hg) | 48.5 ± 15.3 | 47.9 ± 14.4 | 0.638 | 46.7 ± 16.5 | 46.5 ± 11.8 | 0.943 |
| Aortic valve area (cm2) | 0.7 ± 0.2 | 0.7 ± 0.2 | 0.420 | 0.7 ± 0.2 | 0.7 ± 0.2 | 0.624 |
| NYHA class | ||||||
| II | 13.3% | 12.1% | 0.664 | 18.0% | 20.8% | 0.713 |
| III | 64.8% | 69.6% | 0.206 | 68.9% | 66.0% | 0.749 |
| IV | 21.9% | 18.2% | 0.263 | 13.1% | 13.2% | 0.988 |
| STS mortality risk score (% risk of mortality) | 7.3 ± 3.1 | 7.6 ± 3.2 | 0.320 | 7.2 ± 2.6 | 7.7 ± 4.1 | 0.465 |
| Logistic EuroScore (% risk of mortality) | 18.1 ± 13.3 | 18.6 ± 13.1 | 0.656 | 16.5 ± 12.4 | 20.8 ± 13.3 | 0.078 |
| Disability and frailty measures | ||||||
| Wheelchair bound | 4.4% | 3.9% | 0.754 | 0.0% | 7.5% | 0.044 |
| Does not live independently | 9.5% | 8.9% | 0.802 | 8.2% | 7.5% | 1.000 |
| Body mass index <21 kg/m2 | 4.1% | 3.6% | 0.726 | 16.4% | 11.3% | 0.437 |
| Albumin <3.3 g/dL | 16.7% | 16.1% | 0.843 | 11.5% | 10.0% | 0.803 |
| Unplanned weight loss | 9.5% | 6.1% | 0.119 | 8.2% | 9.4% | 1.000 |
| 5-Meter gait speed (seconds) | 9.6 ± 9.2 | 9.8 ± 8.4 | 0.787 | 9.0 ± 3.5 | 8.6 ± 3.6 | 0.561 |
| Health status scores | ||||||
| KCCQ overall summary | 45.9 ± 23.6 | 46.0 ± 22.4 | 0.958 | 51.5 ± 22.1 | 51.2 ± 21.0 | 0.938 |
| KCCQ physical limitations | 45.7 ± 25.2 | 45.7 ± 25.1 | 0.992 | 50.9 ± 22.9 | 47.9 ± 24.9 | 0.501 |
| KCCQ total symptoms | 55.4 ± 25.0 | 54.6 ± 24.6 | 0.678 | 59.9 ± 22.4 | 61.2 ± 23.6 | 0.768 |
| KCCQ quality of life | 40.7 ± 24.8 | 42.1 ± 23.7 | 0.492 | 45.9 ± 24.7 | 45.1 ± 23.8 | 0.865 |
| KCCQ social limitation | 40.5 ± 30.4 | 40.5 ± 29.6 | 0.978 | 48.5 ± 30.9 | 49.4 ± 28.0 | 0.872 |
| SF-12 physical summary | 30.6 ± 9.0 | 30.7 ± 8.4 | 0.935 | 31.4 ± 10.1 | 32.8 ± 9.0 | 0.437 |
| SF-12 mental summary | 47.0 ± 12.3 | 48.7 ± 11.6 | 0.094 | 49.5 ± 10.5 | 46.8 ± 11.7 | 0.198 |
| EQ-5D utility | 0.73 ± 0.20 | 0.73 ± 0.17 | 0.607 | 0.76 ± 0.14 | 0.72 ± 0.21 | 0.229 |
TIA, transient ischemic attack; NYHA, New York Heart Association; STS, Society of Thoracic Surgeons; KCCQ, Kansas City Cardiomyopathy Questionnaire; SF-12, Short Form-12
Data are presented as mean ± SD or %
Baseline health status, stratified by access site, is shown in Table 1. In the overall population, the mean KCCQ overall summary score was 46.8 points, which is generally consistent with NYHA Class III symptoms. The mean SF-12 physical summary score was 30.9 points (~2 standard deviations below population mean), and the mean SF-12 mental summary score was 47.9 points (near population mean). Mean EQ-5D utility was 0.73. Patients who required NIF access generally had higher KCCQ and SF-12 physical summary scores compared with those eligible for IF access. There were no significant differences in baseline health status between the TAVR and AVR groups in either access stratum.
Within Group Comparisons
Health status data were available for 59%, 75%, and 74% of patients eligible for follow-up at 1 month, 6 months, and 1 year, respectively, with slightly more missing data in the AVR arm compared with the TAVR arm, particularly at the 1-month time point (Supplemental Table 1). Baseline characteristics were similar between those with and without missing 1-month health status data (Supplemental Table 2), although patients missing data were more likely to have had a major stroke during the index hospitalization and were less likely to have been discharged to home compared with those patients in the analytic cohort. The unadjusted health status scores for patients by treatment group and stratified by access site for all time points are shown in Supplemental Table 3. The within group comparisons of followup vs. baseline health status are shown in Table 2 (IF group) and Table 3 (NIF group). In general, both disease-specific and generic health status improved substantially by 1 year after TAVR or AVR, regardless of access site. These improvements were evident by 1 month with IFTAVR and by 6 months with NIF-TAVR and AVR. By 1 year, surviving patients had experienced, on average, 19–24 point increases in the KCCQ overall summary scores, 5–7 point increases in SF-12 physical summary scores, and 3–5 point increases in SF-12 mental summary scores. At 1 year, only the IF-TAVR group demonstrated a significant improvement in EQ-5D utilities, with an increase of 0.04 points compared with baseline.
Table 2.
Within group comparisons of health status after TAVR: Iliofemoral group
| TAVR | AVR | ||||||
|---|---|---|---|---|---|---|---|
| Scale/Time Point | n | Paired Difference* (95% CI) | P value | n | Paired Difference* (95% CI) | P value | |
| KCCQ Overall Summary | |||||||
| 1 month | 210 | 21.6 (17.7 to 25.5) | <0.001 | 149 | 3.5 (−1.0 to 7.9) | 0.127 | |
| 6 months | 230 | 25.8 (22.4 to 29.2) | <0.001 | 175 | 24.2 (20.2 to 28.2) | <0.001 | |
| 1 year | 205 | 24.0 (20.6 to 27.5) | <0.001 | 163 | 21.8 (17.5 to 26.0) | <0.001 | |
| KCCQ Physical Limitations | |||||||
| 1 month | 184 | 16.5 (12.0 to 21.1) | <0.001 | 134 | −3.1 (−8.2 to 2.1) | 0.240 | |
| 6 months | 207 | 15.8 (12.1 to 19.6) | <0.001 | 157 | 14.7 (10.1 to 19.2) | <0.001 | |
| 1 year | 178 | 14.8 (10.5 to 19.0) | <0.001 | 154 | 11.1 (6.3 to 15.9) | <0.001 | |
| KCCQ Total Symptoms | |||||||
| 1 month | 209 | 16.7 (13.0 to 20.4) | <0.001 | 148 | 5.2 (0.6 to 9.7) | 0.026 | |
| 6 months | 230 | 21.4 (17.8 to 25.0) | <0.001 | 175 | 21.1 (17.1 to 25.0) | <0.001 | |
| 1 year | 205 | 18.1 (14.5 to 21.7) | <0.001 | 163 | 18.5 (14.2 to 22.8) | <0.001 | |
| KCCQ Quality of Life | |||||||
| 1 month | 207 | 30.3 (26.1 to 34.5) | <0.001 | 147 | 10.2 (5.2 to 15.2) | <0.001 | |
| 6 months | 224 | 36.5 (32.6 to 40.4) | <0.001 | 172 | 32.4 (27.6 to 37.3) | <0.001 | |
| 1 year | 202 | 34.2 (30.4 to 38.0) | <0.001 | 160 | 33.6 (28.9 to 38.2) | <0.001 | |
| KCCQ Social Limitation | |||||||
| 1 month | 166 | 20.8 (15.3 to 26.3) | <0.001 | 119 | −0.7 (−7.8 to 6.4) | 0.853 | |
| 6 months | 187 | 26.5 (21.4 to 31.5) | <0.001 | 142 | 28.4 (22.9 to 34.0) | <0.001 | |
| 1 year | 163 | 25.8 (20.7 to 31.0) | <0.001 | 135 | 23.4 (17.6 to 29.3) | <0.001 | |
| SF-12 Physical Summary | |||||||
| 1 month | 186 | 5.4 (4.0 to 6.9) | <0.001 | 137 | 0.0 (−1.7 to 1.7) | 0.992 | |
| 6 months | 210 | 6.3 (4.8 to 7.8) | <0.001 | 159 | 6.8 (5.3 to 8.3) | <0.001 | |
| 1 year | 187 | 5.9 (4.2 to 7.5) | <0.001 | 147 | 5.1 (3.4 to 6.7) | <0.001 | |
| SF-12 Mental Summary | |||||||
| 1 month | 186 | 3.5 (1.7 to 5.4) | <0.001 | 137 | −2.9 (−5.1 to −0.7) | 0.011 | |
| 6 months | 210 | 5.2 (3.5 to 6.8) | <0.001 | 159 | 2.7 (0.7 to 4.6) | 0.009 | |
| 1 year | 187 | 4.8 (3.0 to 6.5) | <0.001 | 147 | 2.9 (0.9 to 4.9) | 0.004 | |
| EQ-5D Utility | |||||||
| 1 month | 204 | 0.055 (0.024 to 0.087) | <0.001 | 144 | −0.073 (−0.116 to −0.030) | 0.001 | |
| 6 months | 221 | 0.053 (0.023 to 0.082) | <0.001 | 173 | 0.040 (0.014 to 0.065) | 0.003 | |
| 1 year | 199 | 0.043 (0.015 to 0.071) | 0.003 | 155 | 0.003 (−0.029 to 0.035) | 0.870 | |
KCCQ, Kansas City Cardiomyopathy Questionnaire; SF-12, Short Form-12
Paired differences reflect changes compared with baseline
Table 3.
Within group comparisons of health status after TAVR: Non-iliofemoral group
| TAVR | AVR | ||||||
|---|---|---|---|---|---|---|---|
| Scale/Time Point | n | Paired Difference* (95% CI) | P value | n | Paired Difference* (95% CI) | P value | |
| KCCQ Overall Summary | |||||||
| 1 month | 34 | 3.3 (−7.3 to 13.9) | 0.529 | 25 | 5.4 (−6.2 to 17.0) | 0.348 | |
| 6 months | 39 | 19.0 (9.3 to 28.7) | <0.001 | 33 | 16.0 (7.1 to 24.9) | <0.001 | |
| 1 year | 38 | 18.7 (9.2 to 28.1) | <0.001 | 26 | 22.7 (14.5 to 30.8) | <0.001 | |
| KCCQ Physical Limitations | |||||||
| 1 month | 29 | −4.6 (−17.5 to 8.4) | 0.476 | 21 | 3.7 (−11.5 to 18.8) | 0.620 | |
| 6 months | 37 | 12.3 (0.2 to 24.4) | 0.047 | 30 | 13.6 (3.7 to 23.5) | 0.009 | |
| 1 year | 36 | 11.9 (−0.2 to 23.9) | 0.054 | 24 | 15.8 (7.1 to 24.4) | 0.001 | |
| KCCQ Total Symptoms | |||||||
| 1 month | 34 | 3.2 (−6.3 to 12.6) | 0.500 | 25 | 3.9 (−7.5 to 15.3) | 0.490 | |
| 6 months | 39 | 15.9 (8.0 to 23.8) | <0.001 | 33 | 11.2 (1.0 to 21.4) | 0.033 | |
| 1 year | 38 | 13.0 (5.1 to 21.0) | 0.002 | 26 | 19.4 (11.8 to 26.9) | <0.001 | |
| KCCQ Quality of Life | |||||||
| 1 month | 34 | 12.6 (−0.1 to 25.3) | 0.052 | 25 | 11.3 (−1.8 to 24.5) | 0.088 | |
| 6 months | 39 | 27.4 (17.4 to 37.3) | <0.001 | 31 | 23.1 (13.3 to 32.9) | <0.001 | |
| 1 year | 36 | 22.8 (11.6 to 34.0) | <0.001 | 26 | 31.1 (21.0 to 41.2) | <0.001 | |
| KCCQ Social Limitation | |||||||
| 1 month | 27 | −4.2 (−18.3 to 10.0) | 0.550 | 16 | 0.8 (−18.4 to 20.0) | 0.932 | |
| 6 months | 34 | 21.5 (7.8 to 35.3) | 0.003 | 26 | 11.1 (−4.2 to 26.5) | 0.148 | |
| 1 year | 31 | 24.8 (12.5 to 37.1) | <0.001 | 23 | 20.9 (8.0 to 33.9) | 0.003 | |
| SF-12 Physical Summary | |||||||
| 1 month | 29 | 1.7 (−2.4 to 5.8) | 0.412 | 21 | −1.0 (−5.7 to 3.7) | 0.667 | |
| 6 months | 38 | 6.3 (2.5 to 10.0) | 0.002 | 32 | 3.4 (−0.5 to 7.2) | 0.082 | |
| 1 year | 35 | 6.6 (2.4 to 10.8) | 0.003 | 25 | 6.1 (2.1 to 10.2) | 0.004 | |
| SF-12 Mental Summary | |||||||
| 1 month | 29 | −2.8 (−8.1 to 2.4) | 0.278 | 21 | 0.4 (−6.2 to 7.0) | 0.900 | |
| 6 months | 38 | 1.8 (−1.8 to 5.5) | 0.319 | 32 | 2.8 (−2.8 to 8.3) | 0.318 | |
| 1 year | 35 | 3.0 (−0.6 to 6.7) | 0.098 | 25 | 4.8 (−0.2 to 9.9) | 0.058 | |
| EQ-5D Utility | |||||||
| 1 month | 31 | −0.082 (−0.178 to 0.014) | 0.091 | 25 | −0.072 (−0.171 to 0.027) | 0.146 | |
| 6 months | 38 | 0.026 (−0.045 to 0.097) | 0.465 | 31 | 0.041 (−0.027 to 0.109) | 0.231 | |
| 1 year | 36 | 0.023 (−0.033 to 0.080) | 0.407 | 27 | 0.049 (−0.005 to 0.103) | 0.071 | |
KCCQ, Kansas City Cardiomyopathy Questionnaire; SF-12, Short Form-12
Paired differences reflect changes compared with baseline
Between Group Comparisons
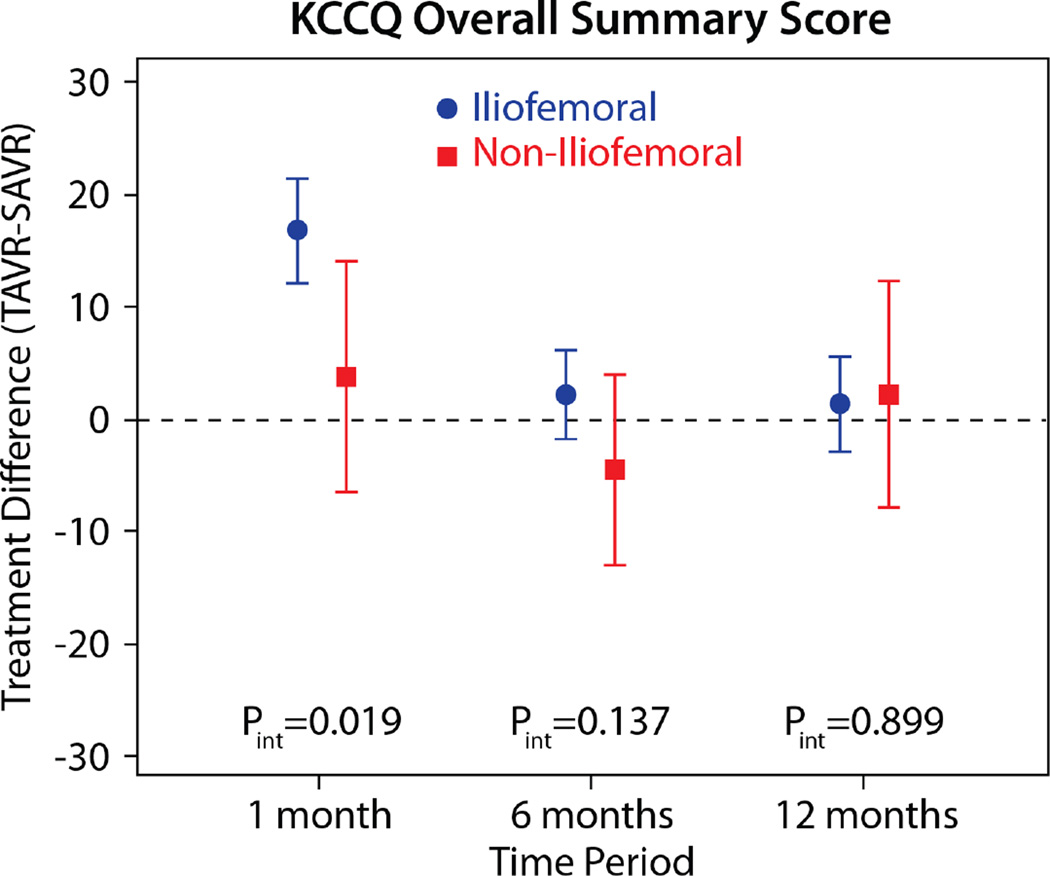
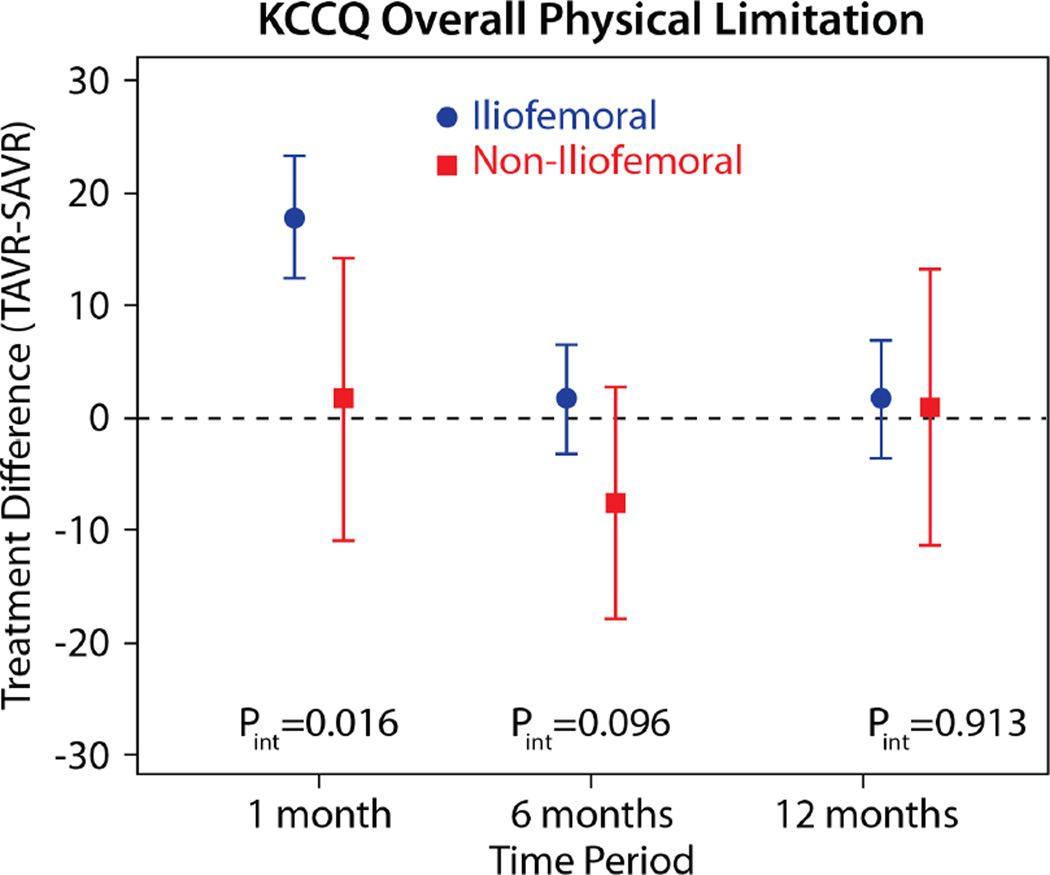
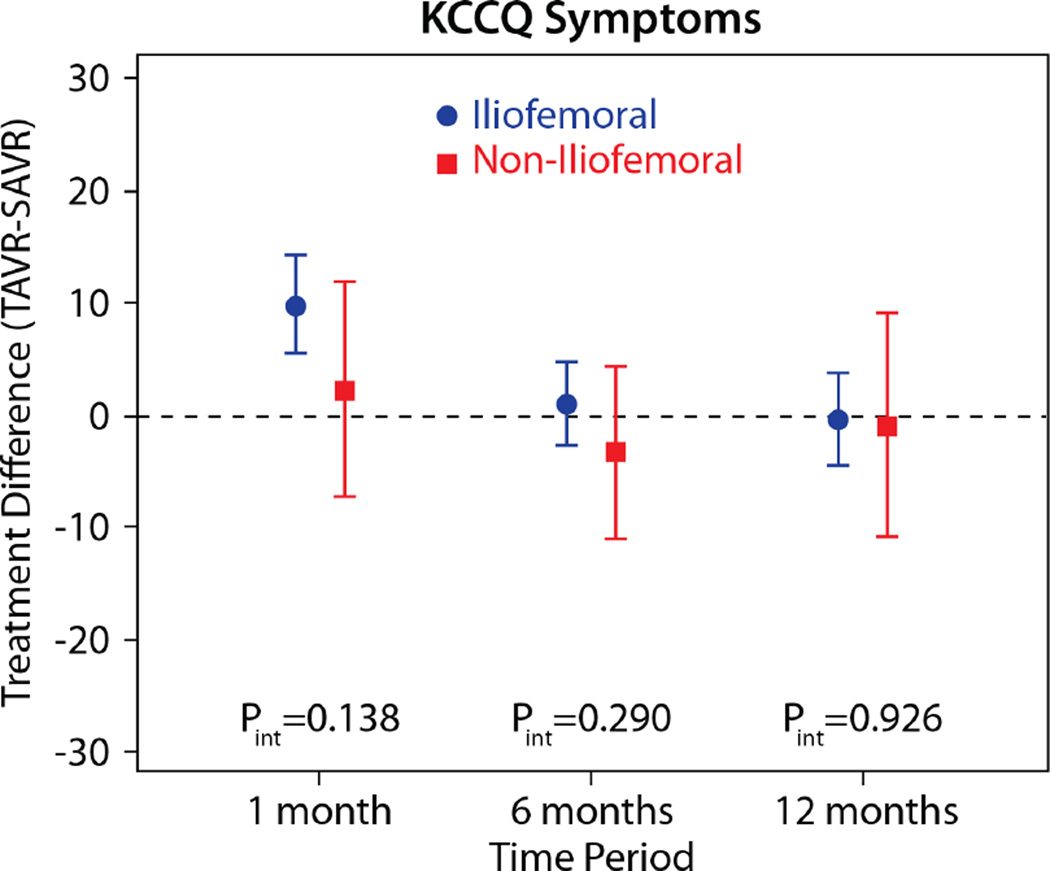
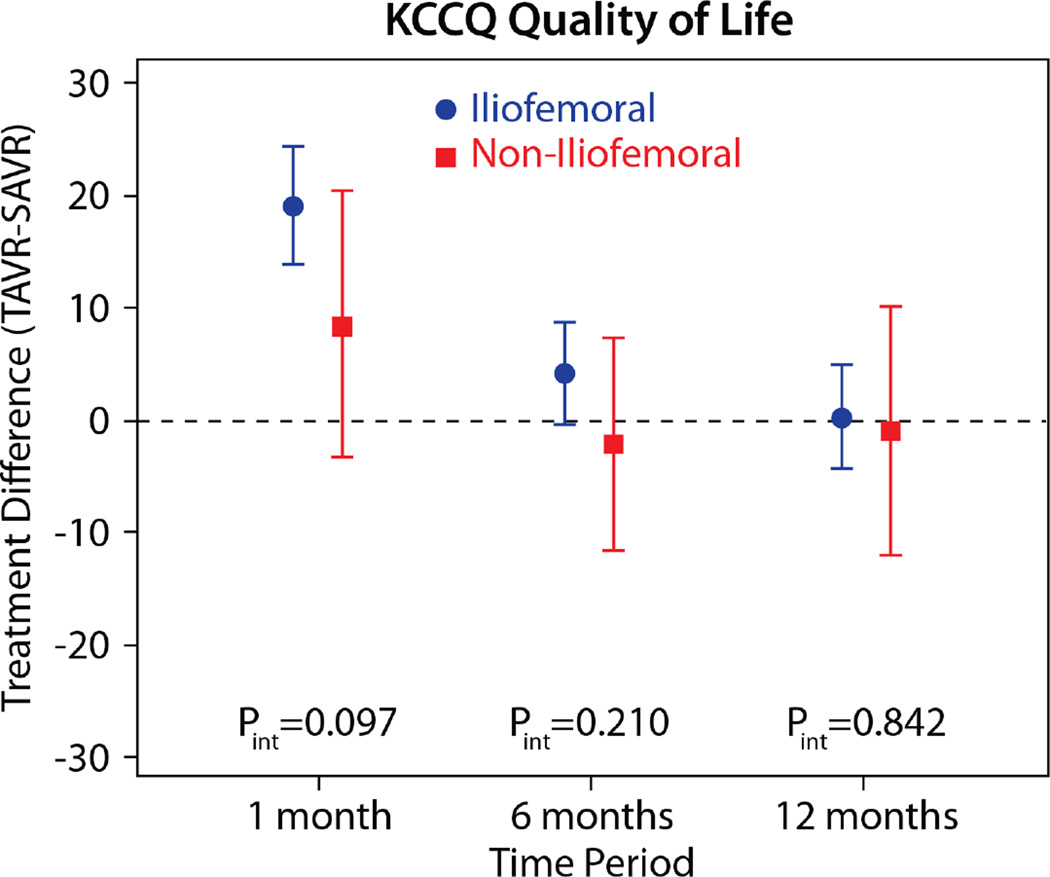
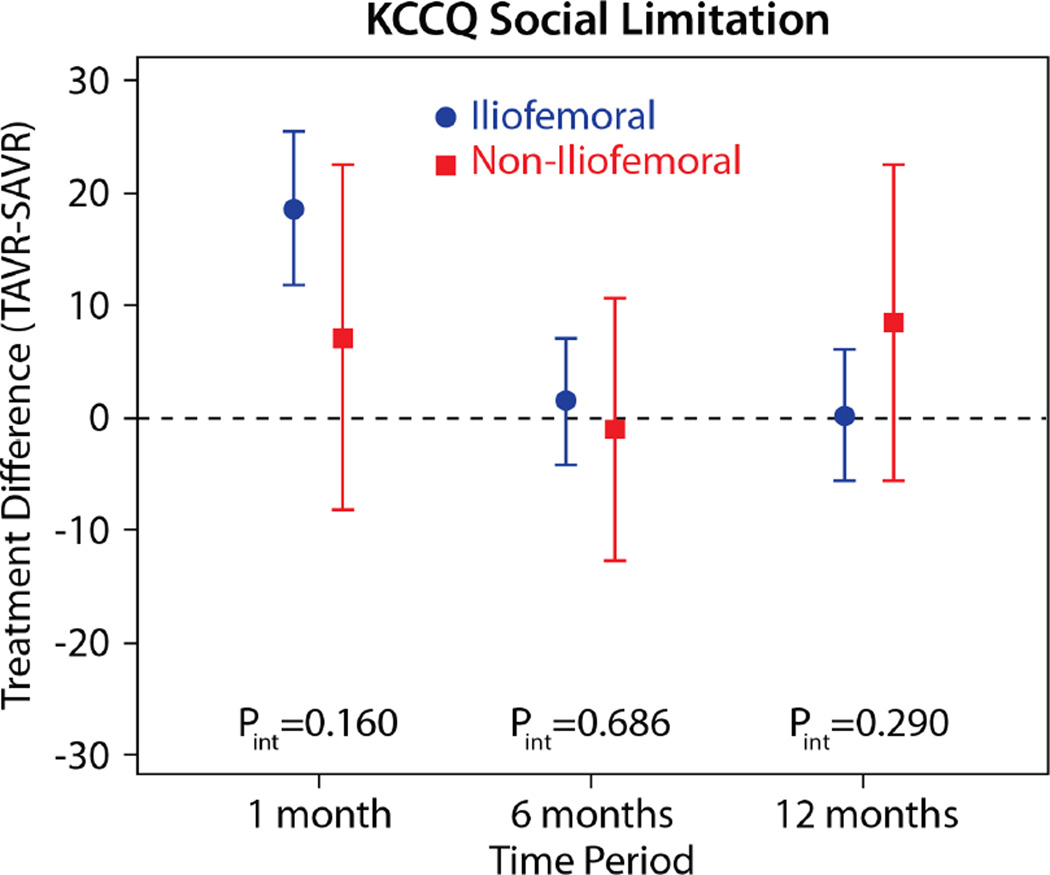
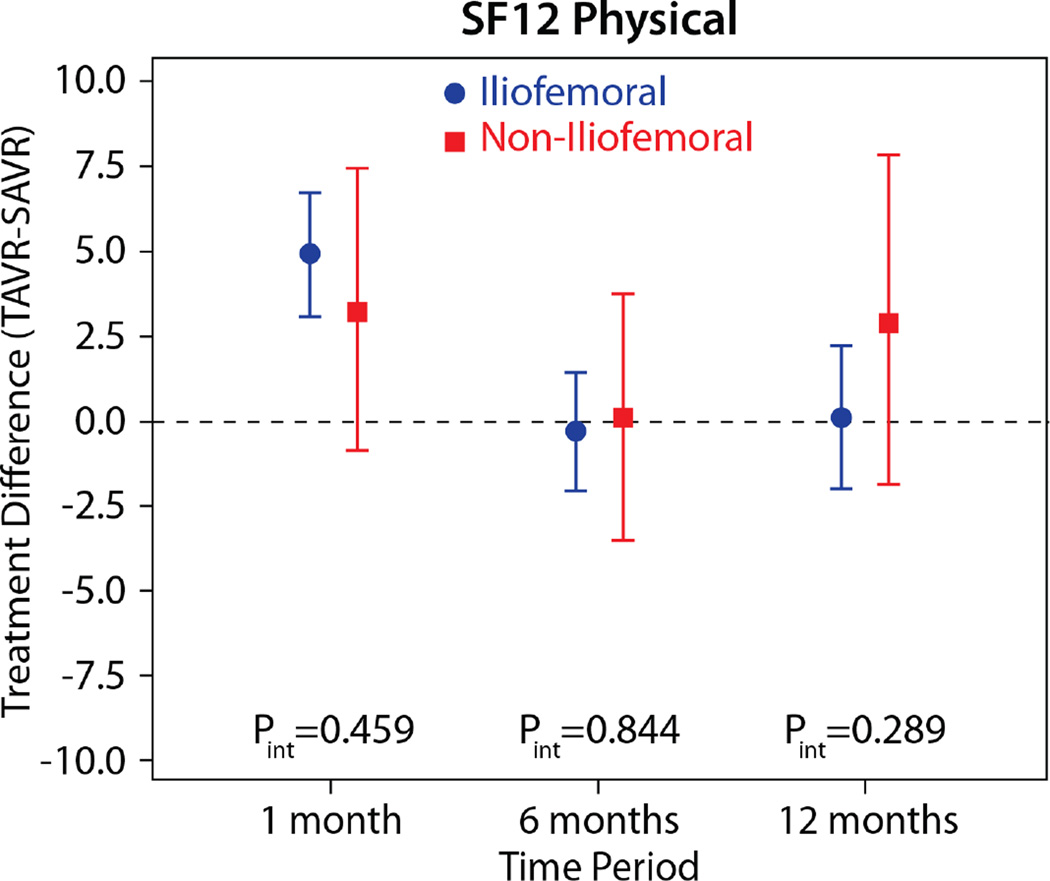
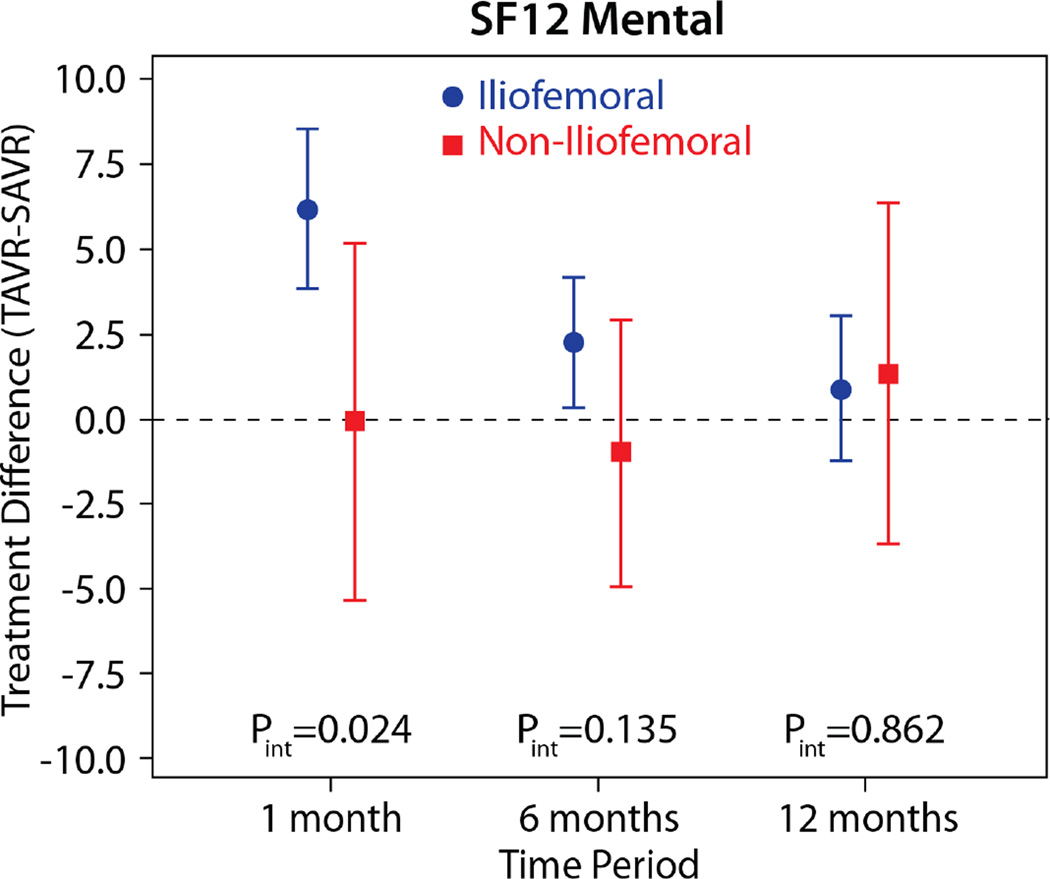
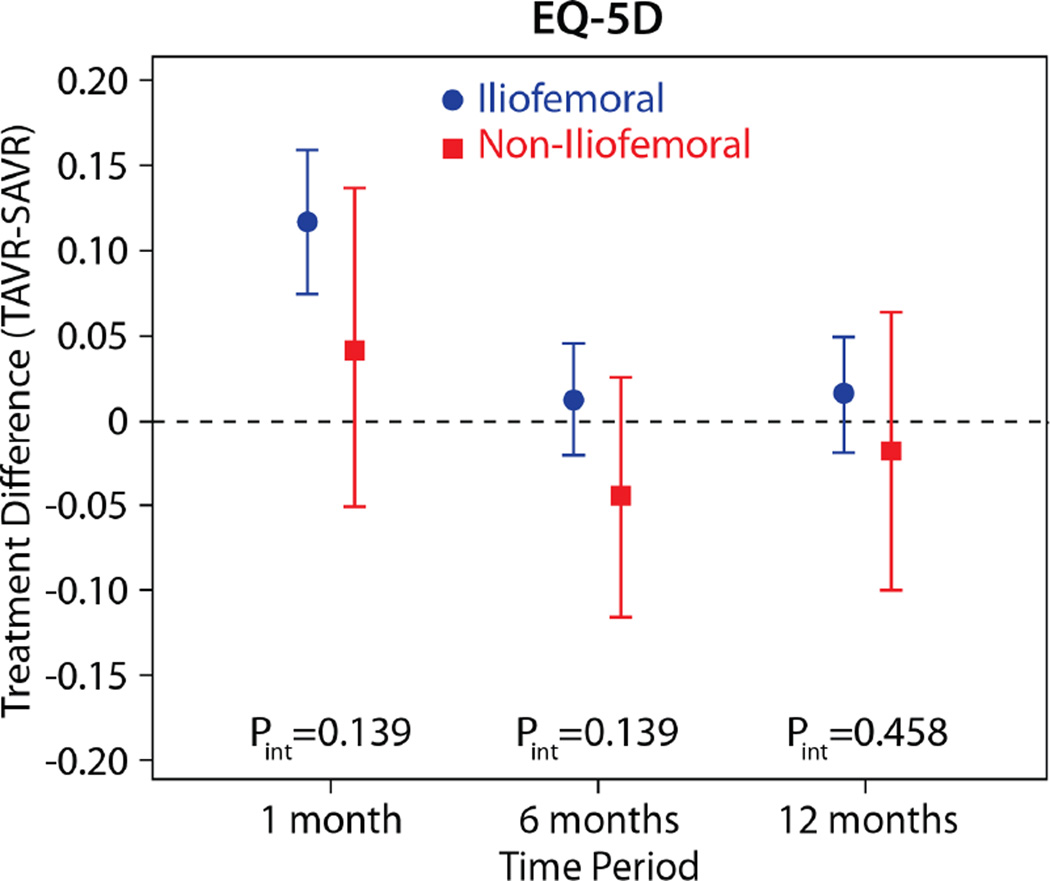
The comparisons of health status between those patients randomized to TAVR vs. AVR, according to the longitudinal growth curve models, are shown in Table 4 and Figure 1. There was a significant interaction between treatment assignment and access site for several of the key health status measures at the 1-month time point, and, thus, all analyses were stratified by access site. IF-TAVR was associated with greater early improvement in health status compared with AVR, with 16.7-point higher KCCQ overall summary scores (95% CI 12.0–21.3, p<0.001) at 1 month. However, at 6 months and 1 year, there were no differences between IF-TAVR and AVR in KCCQ overall summary scores. Similar trends (significantly better scores at 1 month for IF-TAVR vs. AVR with no differences at later time points) were observed for the KCCQ subscales, the SF-12 physical and mental summary scores, and the EQ-5D. For patients ineligible for IF access, there were no significant differences between TAVR and AVR for any of the health status measures at any time points, although confidence intervals for the differences were wide due to the much smaller sample size of the NIF cohort.
Table 4.
Between group comparisons of health status after TAVR, stratified by access site
| Iliofemoral | Non-Iliofemoral | Interaction P value† |
|||
|---|---|---|---|---|---|
| Scale/Time Point | Adjusted Mean Difference* TAVR-AVR (95% CI) |
P value | Adjusted Mean Difference* TAVR-AVR (95% CI) |
P value | |
| KCCQ Overall Summary | |||||
| 1 month | 16.7 (12.0 to 21.3) | <0.001 | 3.6 (−6.6 to 13.9) | 0.486 | 0.019 |
| 6 months | 2.1 (−1.9 to 6.1) | 0.295 | −4.6 (−13.1 to 3.8) | 0.282 | 0.138 |
| 1 year | 1.3 (−3.0 to 5.5) | 0.554 | 2.0 (−8.1 to 12.1) | 0.700 | 0.899 |
| KCCQ Physical Limitations | |||||
| 1 month | 17.8 (12.3 to 23.3) | <0.001 | 1.6 (−10.9 to 14.1) | 0.805 | 0.016 |
| 6 months | 1.6 (−3.3 to 6.5) | 0.518 | −7.6 (−17.8 to 2.6) | 0.144 | 0.096 |
| 1 year | 1.6 (−3.6 to 6.8) | 0.545 | 0.9 (−11.4 to 13.1) | 0.888 | 0.914 |
| KCCQ Total Symptoms | |||||
| 1 month | 9.9 (5.6 to 14.3) | <0.001 | 2.3 (−7.2 to 11.9) | 0.632 | 0.139 |
| 6 months | 1.1 (−2.6 to 4.9) | 0.550 | −3.2 (−11.0 to 4.5) | 0.410 | 0.290 |
| 1 year | −0.2 (−4.4 to 3.9) | 0.908 | −0.8 (−10.8 to 9.3) | 0.883 | 0.927 |
| KCCQ Quality of Life | |||||
| 1 month | 19.0 (13.7 to 24.3) | <0.001 | 8.3 (−3.5 to 20.2) | 0.169 | 0.098 |
| 6 months | 4.1 (−0.5 to 8.6) | 0.078 | −2.3 (−11.8 to 7.2) | 0.638 | 0.211 |
| 1 year | 0.2 (−4.5 to 4.9) | 0.944 | −1.1 (−12.2 to 10.1) | 0.853 | 0.842 |
| KCCQ Social Limitation | |||||
| 1 month | 18.6 (11.8 to 25.4) | <0.001 | 7.1 (−8.2 to 22.5) | 0.360 | 0.161 |
| 6 months | 1.4 (−4.2 to 7.0) | 0.620 | −1.1 (−12.8 to 10.6) | 0.850 | 0.686 |
| 1 year | 0.2 (−5.7 to 6.1) | 0.948 | 8.4 (−5.7 to 22.4) | 0.241 | 0.290 |
| SF-12 Physical | |||||
| 1 month | 4.9 (3.1 to 6.7) | <0.001 | 3.2 (−0.9 to 7.4) | 0.126 | 0.459 |
| 6 months | −0.3 (−2.1 to 1.4) | 0.721 | 0.1 (−3.5 to 3.7) | 0.975 | 0.844 |
| 1 year | 0.1 (−2.0 to 2.2) | 0.927 | 2.9 (−1.9 to 7.8) | 0.237 | 0.290 |
| SF-12 Mental | |||||
| 1 month | 6.1 (3.8 to 8.5) | <0.001 | −0.1 (−5.4 to 5.1) | 0.957 | 0.025 |
| 6 months | 2.2 (0.3 to 4.1) | 0.026 | −1.0 (−5.0 to 2.9) | 0.609 | 0.136 |
| 1 year | 0.8 (−1.3 to 3.0) | 0.456 | 1.3 (−3.7 to 6.3) | 0.610 | 0.863 |
| EQ-5D Utility | |||||
| 1 month | 0.117 (0.075 to 0.159) | <0.001 | 0.042 (−0.051 to 0.136) | 0.375 | 0.140 |
| 6 months | 0.012 (−0.021 to 0.045) | 0.486 | −0.044 (−0.115 to 0.026) | 0.219 | 0.140 |
| 1 year | 0.016 (−0.019 to 0.050) | 0.378 | −0.018 (−0.100 to 0.064) | 0.667 | 0.459 |
KCCQ, Kansas City Cardiomyopathy Questionnaire; SF-12, Short Form-12
Differences reflect the comparison of TAVR vs. AVR and are based on longitudinal growth curve models (see Methods for details)
p-value for the interaction tem between treatment assignment and access site
Figure 1. Adjusted between group differences in disease-specific health status between TAVR and AVR, based on longitudinal growth curve models.
Results are reported separately for the iliofemoral (blue circles) and non-iliofemoral (red squares). Error bars denote 95% confidence intervals. P values are for the interaction between treatment group and access site at each time point.
Rates of Acceptable and Favorable Outcomes
An acceptable outcome after TAVR or AVR, which combines survival status with health status outcomes at 6 month follow-up, occurred in 73% of TAVR patients vs. 64% of AVR patients (p=0.022; Table 5). This difference was confined to the IF cohort (75% vs. 63%, p=0.005), with no difference in the rates of favorable 6-month outcomes between TAVR and AVR among patients in the NIF access stratum. At 1 year, the rates of favorable outcomes did not differ significantly between treatment groups, regardless of access site (overall population TAVR vs. AVR: 58% vs. 51%, p=0.143).
Table 5.
Rates of Acceptable and Favorable Outcome After TAVR and AVR
| Overall Population | Iliofemoral | Non-Iliofemoral | |||||||
|---|---|---|---|---|---|---|---|---|---|
| TAVR (n=394) |
AVR (n=401) |
p-value | TAVR (n=330) |
AVR (n=333) |
P value | TAVR (n=64) |
AVR (n=68) |
P value | |
| Acceptable Outcome at 6 Months* | 72.6% | 63.6% | 0.022 | 75.5% | 63.5% | 0.005 | 58.0% | 64.1% | 0.559 |
| Favorable Outcome at 1 Year† | 57.6% | 51.4% | 0.143 | 58.5% | 51.9% | 0.149 | 52.9% | 48.8% | 0.692 |
Defined as death, KCCQ-overall summary score <45, or decrease in KCCQ-overall summary score of ≥10 points from baseline
Defined as death, KCCQ-overall summary score <60, or decrease in KCCQ-overall summary score of ≥10 points from baseline
Per Protocol Results
Of the 709 randomized patients who had baseline quality of life data, 1 TAVR patient and 6 AVR patients did not have their assigned procedure, and 6 TAVR patients required a change in access site. As such, the per protocol analytic population included 369 TAVR patients and 327 AVR patients who were randomized to and received their assigned treatment. There were no notable differences in either the within-group or between-group comparisons in the per protocol analysis compared with the intention to treat analyses (Supplemental Tables 4–6).
DISCUSSION
In this large, multicenter clinical trial of patients with severe symptomatic aortic stenosis who were at increased surgical risk, surviving patients who were treated with TAVR with a self-expanding valve or with surgical AVR both had substantial improvements in health status. Among surviving patients eligible for IF access, those treated with TAVR had an early health status benefit compared with AVR, with greater improvements in heart failure symptoms, physical function, and quality of life at 1 month. However, by 6 months, there were no differences between groups, and there was little change in health status in either group between 6 months and 1 year. Among surviving patients who required NIF access, there were no significant differences between TAVR and AVR for any of the health status measures at any of the time points.
These access-specific results are particularly interesting when compared with those from Cohort A of the PARTNER trial, which was a trial of balloon-expandable TAVR versus AVR in patients at increased surgical risk(4). In PARTNER, there was a similarly strong interaction between access site and early health status benefits, with those patients eligible for transfemoral access receiving an early benefit with TAVR compared with AVR but no such benefit among those patients who underwent transapical TAVR. The more prolonged recovery among transapical patients was posited to reflect the greater pain associated with the lateral thoractomy required for transapical access as compared with median sternotomy. In the CoreValve trial, patients who required NIF access were treated via either via the subclavian artery or a direct aortic approach—both of which might be expected to produce less post-operative pain as compared with a thoracotomy. Nonetheless, our data demonstrate that NIF-TAVR via these routes was still associated with health status and quality of life outcomes that were similar to those seen with surgical AVR—even at the 1 month timepoint.
There are several potential explanations for the apparent lack of early health status benefit with NIF-TAVR vs. AVR seen in the CoreValve trial. First, it is possible that even the mini-sternotomy or mini-thoracotomy required for the direct aortic approach (the most common NIF approach used in the trial) impacts recovery in elderly, debilitated, and frail patients to a similar extent as a full sternotomy. Second, there may be important differences in post-operative recovery between TAVR via the direct aortic or subclavian approach and surgical AVR that could not be measured by the health status instruments used in our study. Had we employed more sensitive approaches (such as a visual analog pain scale), it is possible that differences between groups would have then been detected. Finally, it is possible that there are important differences in early health status between NIF-TAVR and AVR that could not be detected owing to the small sample size in the NIF cohort of our study. Indeed, the point estimates for the difference in SF-12 physical component scores between TAVR and AVR were similar for IF and NIF patients (and the interaction test was non-significant), suggesting a potential early benefit in recovery of physical function with NIF-TAVR vs. AVR. Future studies will be necessary to determine how to optimize the health status recovery of patients requiring NIF access and to examine whether there are any differences among the alternative access sites.
It is also important to recognize that the health status outcomes reported in this study apply only to surviving patients. Since there was a survival advantage with TAVR compared with AVR in the CoreValve High Risk trial, it is possible that longer term health status benefits of TAVR could have been missed due to differential attrition of the sickest patients in the AVR group. Indeed, when we integrated survival and quality of life outcomes into a single metric, we found that patients treated with TAVR were more likely to have an acceptable outcome at 6 months compared with patients undergoing AVR with a similar trend in favorable outcomes at 1 year, regardless of access site. We believe that examining the results of the trial in this manner is both patient-centered and clinically relevant, since patients considering TAVR or AVR may value more than just survival. If a treatment saves lives but the quality of those lives is poor, this is unlikely to be viewed as a desirable outcome by patients or their treating physicians. Given the mortality benefit seen with TAVR in the CoreValve High-Risk trial, it is therefore encouraging to see that the rates of acceptable and favorable outcomes were improved as well with TAVR compared with AVR.
Limitations
This study should be interpreted in light of several important limitations. First, due to the small sheath size required for the CoreValve device, only a small proportion of patients required NIF access; as such, the comparisons of NIF-TAVR with AVR may be underpowered to detect modest yet important differences between the two treatments. Since many of the interactions of treatment by access site were highly significant at 1 month, however, it is clear that there are meaningful differences between IF-TAVR and NIF-TAVR in terms of early health status recovery. Second, there was a fair amount of missing health status data over follow-up, particularly in the AVR arm. We used growth curve models to analyze the health status data, which take advantage of all data available and limit the bias due to missing data. However, it is still possible that missing data could have influenced our results. Third, the trial was unblinded, which could have influenced how patients complete the health status assessments. Finally, the quality of life results are only reported up to 1 year, and thus, the durability of these results beyond this time frame is unknown.
Conclusions
In conclusion, in a cohort of patients with severe aortic stenosis at increased surgical risk, treatment with either AVR or TAVR with the CoreValve self-expanding bioprosthesis results in substantial improvements in disease-specific and generic health status. Surviving patients treated via the IF route experienced more rapid improvement in heart failure symptoms and functional status compared with AVR, whereas patients treated via the NIF route had similar health status outcomes as AVR. Furthermore, when integrating survival with quality of life, we found that patients treated with TAVR were more likely to have an acceptable outcome compared with patients undergoing AVR. We believe that use of these combined outcomes is particularly relevant in the elderly population of patients considering TAVR or AVR, as they best represent the overarching goals of treatment from a patient perspective.
Supplementary Material
Figure 2. Adjusted between group differences in generic health status between TAVR and AVR, based on longitudinal growth curve models.
Results are reported separately for the iliofemoral (blue circles) and non-iliofemoral (red squares). Error bars denote 95% confidence intervals. P values are for the interaction between treatment group and access site at each time point.
CLINICAL PERSPECTIVES.
What is Known?
In previous studies, among patients at increased risk for surgery, balloon-expandable TAVR via a transfemoral approach showed improved early quality of life and similar late outcomes compared with surgical AVR.
What is New?
An alternative TAVR platform with a self-expanding bioprosthesis has recently been shown to be associated with improved survival compared with AVR in patients at increased surgical risk, but how this device affects patients’ symptoms, functional status, and quality of life, compared with AVR, was unknown. Since the self-expanding bioprosthesis differs from the balloon-expandable valve in terms of the device, the routes of delivery, and the risk of particular complications, the health status outcomes of patients treated with these different devices may also be different. Using data from the CoreValve High Risk Pivotal trial, we found that-- similar to the balloon-expandable TAVR-- patients eligible for iliofemoral access had an early health status benefit compared with AVR across all disease-specific and generic health status measures, but there were no differences between groups at later time points. In contast, there were no significant health status differences at any of the time points between TAVR and AVR for patients who required non-iliofemoral access.
What is Next?
Future studies are needed to determine how to optimize the health status recovery of patients requiring non-iliofemoral access and to examine whether there are any differences among the alternative access sites (transapical, subclavian, transaortic)..
Acknowledgments
Sources of Funding: The CoreValve US Pivotal trial was sponsored by Medtronic. All analyses, the preparation of the manuscript, and the decision to submit the manuscript for publication were done independently of the study sponsor. Dr. Arnold is supported by a Career Development Grant Award (K23 HL116799) from the National Heart, Lung, and Blood Institute.
MRR: research support from Edwards Lifesciences and Medtronic; consulting income from Medtronic; MJR: honoraria from Medtronic for participation on a surgical advisory board; PNT: consulting fees from Medtronic and St. Jude Medical; BM: speaking honoraria from Medtronic, St. Jude Medical, and Abbott Vascular; DHA: royalties through his institution from Medtronic for a patent related to a triscupid-valve annuloplasty ring and from Edwards Lifesciences for a patent related to degenerative valvular disease-specific annuloplasty rings. JJP: honoraria from Boston Scientific, Abbott Vascular, and St. Jude Medical for participation on medical advisory boards; DJC: research support from Edwards Lifesciences, Medtronic, Boston Scientific, Abbott Vascular, Eli Lilly, Daiichi-Sankyo,and Astra Zeneca; consulting income from Medtronic, Abbott Vascular, Astra Zeneca, Eli Lilly, and Merck; and speaking honoraria from Astra Zeneca.
ABBREVIATIONS
- EQ-5D
EuroQol
- IF
iliofemoral
- KCCQ
Kansas City Cardiomyopathy Questionnaire
- SF-12
Medical Outcomes Study Short-Form 12 Questionnaire
- NYHA
New York Heart Association
- NIF
non-iliofemoral
- AVR
surgical aortic valve replacement
- TAVR
transcatheter aortic valve replacement
Footnotes
Publisher's Disclaimer: This is a PDF file of an unedited manuscript that has been accepted for publication. As a service to our customers we are providing this early version of the manuscript. The manuscript will undergo copyediting, typesetting, and review of the resulting proof before it is published in its final citable form. Please note that during the production process errors may be discovered which could affect the content, and all legal disclaimers that apply to the journal pertain.
Disclosures: The other authors report no potential conflicts.
Clinical Trial Registration: ClinicalTrials.gov: NCT01240902
REFERENCES
- 1.Leon MB, Smith CR, Mack M, et al. Transcatheter aortic-valve implantation for aortic stenosis in patients who cannot undergo surgery. N Engl J Med. 2010;363:1597–1607. doi: 10.1056/NEJMoa1008232. [DOI] [PubMed] [Google Scholar]
- 2.Reynolds MR, Magnuson EA, Lei Y, et al. Health-related quality of life after transcatheter aortic valve replacement in inoperable patients with severe aortic stenosis. Circulation. 2011;124:1964–1972. doi: 10.1161/CIRCULATIONAHA.111.040022. [DOI] [PubMed] [Google Scholar]
- 3.Smith CR, Leon MB, Mack MJ, et al. Transcatheter versus surgical aortic-valve replacement in high-risk patients. N Engl J Med. 2011;364:2187–2198. doi: 10.1056/NEJMoa1103510. [DOI] [PubMed] [Google Scholar]
- 4.Reynolds MR, Magnuson EA, Wang K, et al. Health-related quality of life after transcatheter or surgical aortic valve replacement in high-risk patients with severe aortic stenosis: results from the PARTNER (Placement of AoRTic TraNscathetER Valve) Trial (Cohort A) J Am Coll Cardiol. 2012;60:548–558. doi: 10.1016/j.jacc.2012.03.075. [DOI] [PubMed] [Google Scholar]
- 5.Adams DH, Popma JJ, Reardon MJ, et al. Transcatheter aortic-valve replacement with a self-expanding prosthesis. N Engl J Med. 2014;370:1790–1798. doi: 10.1056/NEJMoa1400590. [DOI] [PubMed] [Google Scholar]
- 6.Tsevat J, Dawson NV, Wu AW, et al. Health values of hospitalized patients 80 years or older. HELP Investigators. Hospitalized Elderly Longitudinal Project. JAMA. 1998;279:371–375. doi: 10.1001/jama.279.5.371. [DOI] [PubMed] [Google Scholar]
- 7.Lewis EF, Johnson PA, Johnson W, Collins C, Griffin L, Stevenson LW. Preferences for quality of life or survival expressed by patients with heart failure. J Heart Lung Transplant. 2001;20:1016–1024. doi: 10.1016/s1053-2498(01)00298-4. [DOI] [PubMed] [Google Scholar]
- 8.Green CP, Porter CB, Bresnahan DR, Spertus JA. Development and evaluation of the Kansas City Cardiomyopathy Questionnaire: a new health status measure for heart failure. Journal of the American College of Cardiology. 2000;35:1245–1255. doi: 10.1016/s0735-1097(00)00531-3. [DOI] [PubMed] [Google Scholar]
- 9.Arnold SV, Spertus JA, Lei Y, et al. Use of the Kansas City Cardiomyopathy Questionnaire for Monitoring Health Status in Patients With Aortic Stenosis. Circulation Heart failure. 2013;6:61–67. doi: 10.1161/CIRCHEARTFAILURE.112.970053. [DOI] [PubMed] [Google Scholar]
- 10.Spertus J, Peterson E, Conard MW, et al. Monitoring clinical changes in patients with heart failure: a comparison of methods. American heart journal. 2005;150:707–715. doi: 10.1016/j.ahj.2004.12.010. [DOI] [PubMed] [Google Scholar]
- 11.Ware J, Jr, Kosinski M, Keller SD. A 12-Item Short-Form Health Survey: construction of scales and preliminary tests of reliability and validity. Medical care. 1996;34:220–233. doi: 10.1097/00005650-199603000-00003. [DOI] [PubMed] [Google Scholar]
- 12.EuroQol--a new facility for the measurement of health-related quality of life. Health policy (Amsterdam, Netherlands) 1990;16:199–208. doi: 10.1016/0168-8510(90)90421-9. [DOI] [PubMed] [Google Scholar]
- 13.Ware J, Kosinski M, Bjorner JB, Turner-Bowkes DM, Gandek B, Maruish ME. User’s Manual for the SF-36v2 Health Survey. Lincoln, RI: QualityMetric Incorporated; 2007. Determining important differences in scores. [Google Scholar]
- 14.Shaw JW, Johnson JA, Coons SJ. US valuation of the EQ-5D health states: development and testing of the D1 valuation model. Medical care. 2005;43:203–220. doi: 10.1097/00005650-200503000-00003. [DOI] [PubMed] [Google Scholar]
- 15.Dyer MT, Goldsmith KA, Sharples LS, Buxton MJ. A review of health utilities using the EQ-5D in studies of cardiovascular disease. Health and quality of life outcomes. 2010;8:13. doi: 10.1186/1477-7525-8-13. [DOI] [PMC free article] [PubMed] [Google Scholar]
- 16.Arnold SV, Spertus JA, Lei Y, et al. How to Define a Poor Outcome After Transcatheter Aortic Valve Replacement: Conceptual Framework and Empirical Observations From the Placement of Aortic Transcatheter Valve (PARTNER) Trial. Circ Cardiovasc Qual Outcomes. 2013;6:591–597. doi: 10.1161/CIRCOUTCOMES.113.000354. [DOI] [PMC free article] [PubMed] [Google Scholar]
- 17.Arnold SV, Reynolds MR, Lei Y, et al. Predictors of poor outcomes after transcatheter aortic valve replacement: results from the PARTNER (Placement of Aortic Transcatheter Valve) trial. Circulation. 2014;129:2682–2690. doi: 10.1161/CIRCULATIONAHA.113.007477. [DOI] [PMC free article] [PubMed] [Google Scholar]
- 18.Jennrich RI, Schluchter MD. Unbalanced repeated-measures models with structured covariance matrices. Biometrics. 1986;42:805–820. [PubMed] [Google Scholar]
Associated Data
This section collects any data citations, data availability statements, or supplementary materials included in this article.


