

Abstract
Background
Natriuretic peptides promote natriuresis, diuresis, and vasodilation. Experimental deficiency of natriuretic peptides leads to hypertension (HTN) and cardiac hypertrophy, conditions more common among African Americans. Hospital-based studies suggest that African Americans may have reduced circulating natriuretic peptides, as compared to Caucasians, but definitive data from community-based cohorts are lacking.
Methods and Results
We examined plasma N-terminal pro B-type natriuretic peptide (NTproBNP) levels according to race in 9137 Atherosclerosis Risk in Communities (ARIC) Study participants (22% African American) without prevalent cardiovascular disease at visit 4 (1996–1998). Multivariable linear and logistic regression analyses were performed adjusting for clinical covariates. Among African Americans, percent European ancestry was determined from genetic ancestry informative markers and then examined in relation to NTproBNP levels in multivariable linear regression analysis. NTproBNP levels were significantly lower in African Americans (median, 43 pg/mL; interquartile range [IQR], 18, 88) than Caucasians (median, 68 pg/mL; IQR, 36, 124; P<0.0001). In multivariable models, adjusted log NTproBNP levels were 40% lower (95% confidence interval [CI], −43, −36) in African Americans, compared to Caucasians, which was consistent across subgroups of age, gender, HTN, diabetes, insulin resistance, and obesity. African-American race was also significantly associated with having nondetectable NTproBNP (adjusted OR, 5.74; 95% CI, 4.22, 7.80). In multivariable analyses in African Americans, a 10% increase in genetic European ancestry was associated with a 7% (95% CI, 1, 13) increase in adjusted log NTproBNP.
Conclusions
African Americans have lower levels of plasma NTproBNP than Caucasians, which may be partially owing to genetic variation. Low natriuretic peptide levels in African Americans may contribute to the greater risk for HTN and its sequalae in this population.
Keywords: ancestry informative markers, deficiency, hypertension, natriuretic peptide, race
Natriuretic peptides (NPs) are hormones with cardiovascular (CV) and metabolic effects, including the promotion of natriuresis, diuresis, and vasodilation, as well as triggering lipolysis, weight loss, and improved glucose sensitivity.1 Experimental, genetic, and clinical evidence supports that relative NP deficiencies may contribute to the development of cardiometabolic risk factors, including hypertension (HTN) and diabetes mellitus (DM).2–5 Prevalence of cardiometabolic risk factors, such as HTN, DM, and obesity, is higher in African Americans, compared to Caucasians6; however, there are limited data regarding whether NP levels differ by race.
Whereas some studies suggest that African Americans may have lower levels of NP, these predominantly included patients presenting to the emergency department with acute dyspnea, raising the possibility of confounding by comorbidities.2,7–9 Whether NP levels differ according to race in community-dwelling individuals free of prevalent CV disease (CVD) has not been specifically examined.10 Furthermore, whether there is a genetic contribution to NP levels in African Americans is not well understood. We hypothesized that African-American individuals have lower NP levels than Caucasians and tested this hypothesis in the Atherosclerosis Risk in Communities (ARIC) Study, which is a large, prospective, observational cohort study of predominantly African-American and Caucasian participants from 4 communities in the United States.
Methods
Study Population
ARIC is an ongoing, prospective, observational study of the natural history of CV risk factors and atherosclerotic diseases. Detailed study rationale, design, and procedures have been previously published.11 The original cohort included 15 792 participants recruited between 1987 and 1989 using probability sampling of middle-aged (45 to 64 years old) men and women from 4 communities in the United States (Forsyth County, NC; Jackson, MS; suburban Minneapolis, MN; and Washington County, MD). Enrollment of African Americans varied by field center (Jackson 100%; Forsyth County 12%; Minneapolis <1%; Washington County <1%). Subsequent follow-up visits occurred at 3-year intervals up to 1998, with annual telephone interviews conducted between visits and to the present. A fifth visit was recently completed (2011–2013). Institutional review boards from each site approved the study, and informed consent was obtained from all participants.
The fourth ARIC exam occurred between 1996 and 1998, was attended by 11 656 participants, and is the basis for this analysis given that plasma N-terminal pro B-type natriuretic peptide (NTproBNP) levels were measured on samples obtained at this visit. We excluded 2519 participants for the following reasons: missing plasma NT-proBNP levels (n=405); self-reported race other than African American or Caucasian (n=31); prevalent or missing status regarding prevalent CVD (defined as coronary artery disease, heart failure, atrial fibrillation/flutter, or stroke; n=1989), or missing baseline characteristics of interest (n=94). After exclusions, the final study population was comprised of 9137 individuals.
NTproBNP
Plasma samples were collected from participants at visit 4 and stored at −70°C. NTproBNP levels were measured using an electrochemiluminescent assay on a Cobas e411 analyzer (Roche Diagnostics, Indianapolis, IN), as previously described.12 The measurement range was 5 to 35 000 pg/mL, with a value of 2.5 pg/mL assigned to participants with levels below the limit of detection. The coefficient of variation was 3.5% to 4.7%.12
Covariates
Established definitions for HTN, obesity, DM, and smoking status, as previously described in ARIC, were utilized.13 Annual household income was determined by participant self-report at visit 1 (1987–1989). HTN was defined as systolic (SBP) or diastolic blood pressure (DBP) ≥140 or ≥90 mm Hg, respectively, or use of antihypertensive medications, which were classified according to the Medispan Therapeutic Classification system.14 Body mass index (BMI) was calculated from measured height and weight, with obesity defined as a BMI ≥30 kg/m2. Creatinine and fasting glucose were measured according to standardized protocols; estimated glomerular filtration rate (eGFR) was calculated with the Chronic Kidney Disease Epidemiology Collaboration (CKD-EPI) equation with chronic kidney disease (CKD) defined as an eGFR <60 mL/min per 1.73 m2.15 Prevalent DM was defined as fasting glucose ≥126 mg/dL or nonfasting glucose ≥200 mg/dL, self-report of physician diagnosis of diabetes, or use of antidiabetic medications. Among participants without DM, the homeostatic model assessment method was used to quantify insulin resistance (HOMA-IR) as fasting glucose (mg/dL)×insulin/405.16 Urine microlbuminuria was measured and categorized as previously described, with microalbuminuria defined as a urine albumin-to-creatinine ratio of 30 to 300 mg/g.17
Percent European Ancestry Among African Americans
Genotyping methods for estimating genetic ancestry among African Americans in the ARIC Study have been previously described.18,19 Briefly, genotyping was performed on stored DNA from visit 1 using the Illumina BeadLab platform at the Center for Inherited Heart Disease Research (Johns Hopkins University, Baltimore, MD). Single-nucleotide polymorphisms (SNPs) with frequencies that significantly differed between African and Caucasian ancestral populations were defined as ancestry informative markers (AIMs). Among African Americans, who represent an admixed population, percentage European ancestry (PEA) was estimated using 1350 AIMs. Race-specific frequencies of each SNP among the AIMs were estimated from West African and European samples to provide a Bayesian prior for ancestral allele frequencies. PEA was available in 1656 (86%) of African Americans in the final study population for this analysis.
Statistical Analyses
Participants were categorized according to self-reported race as African American or Caucasian. Summary statistics for covariates were calculated as counts (percentages), and medians (interquartile ranges; IQRs) for categorical and continuous data, respectively. Comparisons between African Americans and Caucasians were made by chi-square (χ2) or Wilcoxon rank-sum tests, as appropriate. A cumulative distribution plot was derived in order to compare natural log-transformed NTproBNP levels according to race. Three sensitivity analyses were performed to compare NTproBNP levels between African Americans and Caucasians when restricted to: (1) participants with detectable NTproBNP levels (≥5.0 pg/mL); (2) healthy participants, defined as no prevalent CVD, HTN, DM, CKD, past or current smoking, or use of antihypertensive medications, aspirin, or lipid-lowering therapy and BMI <25 kg/m2; and (3) participants from Forsyth County, North Carolina, which was the only ARIC field center with substantial numbers of both African Americans and Caucasians.
Multivariable linear regression was used to assess the associations between race and NTproBNP. Given the non-normal distribution (right-skewed) of NTproBNP, values were natural log transformed before entry into regression models. The multiplicative effect (percent difference) on log NTproBNP levels was estimated by exponentiating the beta coefficients (95% confidence interval [CI]) for each covariate. For example, African-American race is associated with 40% lower log NTproBNP levels than Caucasians because e−0.519=0.60. Multivariable logistic regression was used to calculate the adjusted odds of nondetectable NTproBNP levels according to race. Covariates included in multivariable models included race, age, gender, BMI, heart rate, SBP and DBP, fasting glucose, eGFR, annual household income, HTN, antihypertensive medication, DM, smoking status, and microalbuminuria. In additional analyses, HOMA-IR was added into the multivariable logistic and linear regression models to account for the association between insulin resistance and plasma NTproBNP levels. Multivariable linear regression analyses were also repeated among African Americans, with inclusion of PEA as a covariate. Before entry into regression models, all continuous variables were standardized to 1 SD change from the mean. All analyses were performed using Stata software (11.2; Stata Corp, College Station, TX).
Results
Plasma NTproBNP Levels
African Americans accounted for 22% of the study population. Compared to Caucasians, African Americans were more likely to be female, hypertensive, and have microalbuminuria; however, NTproBNP levels in African Americans (median, 43 pg/mL; IQR, 18, 88) were significantly lower than in Caucasians (median, 68 pg/mL; IQR, 36, 124; P<0.001; Table 1; Figure 1). NTproBNP levels below the limit of detection were also more frequent among African Americans (9%) than Caucasians (2%; P<0.001). Significantly lower NTproBNP levels in African Americans were also found when analyses were restricted to (1) participants with detectable levels of NTproBNP, (2) healthy participants, or (3) participants at the Forsyth County, North Carolina, field center (data not shown).
Table 1.
Baseline Characteristics of African-American and Caucasian Participants Without Prevalent Cardiovascular Disease at ARIC Visit 4 (1996–1998)
| Characteristic | African Americans n=1973 | Caucasians n=7164 | P Value |
|---|---|---|---|
| Age, y | 61 (57, 66) | 62 (58, 67) | <0.001 |
| Men, % | 35 | 43 | <0.001 |
| Household income/year, % | <0.001 | ||
| <$25 000 | 57 | 23 | |
| $25 000 to $49 999 | 26 | 38 | |
| >$50 000 | 17 | 39 | |
| Hypertension, % | 63 | 39 | <0.001 |
| Antihypertensive medication, % | 54 | 33 | <0.001 |
| Diuretic | 23 | 12 | <0.001 |
| Beta-blocker | 9 | 10 | 0.10 |
| ACE inhibitor or ARB | 11 | 10 | 0.14 |
| Ca-channel blocker | 16 | 8 | <0.001 |
| Diabetes mellitus, % | 24 | 12 | <0.001 |
| Smoking status, % | <0.001 | ||
| Current smoker | 18 | 14 | |
| Former smoker | 35 | 44 | |
| Never smoker | 47 | 42 | |
| BMI, kg/m2 | 29.5 (26.3, 33.6) | 27.4 (24.5, 30.9) | <0.001 |
| Heart rate, bpm | 68 (62, 72) | 64 (60, 72) | <0.001 |
| SBP, mm Hg | 130 (119, 145) | 123 (112, 136) | <0.001 |
| DBP, mm Hg | 75 (69, 81) | 70 (63, 76) | <0.001 |
| Fasting glucose, mg/dL | 103 (95, 115) | 99 (93, 107) | <0.001 |
| eGFR, mL/min per 1.73 m2 | 100 (88, 111) | 92 (82, 101) | <0.001 |
| UACR (mg/g), % | <0.001 | ||
| <30 | 89 | 95 | |
| 30 to 299 | 9 | 5 | |
| >300 | 3 | 1 | |
| NTproBNP, pg/mL | 43 (18, 88) | 68 (36, 124) | <0.001 |
| Undetectable NTproBNP, % | 9 | 2 | <0.001 |
| HOMA-IR* | 2.9 (2.1, 4.2) | 2.2 (1.5, 3.2) | <0.001 |
Data presented as percentage or median (interquartile range) for categorical and continuous data, respectively. ACE indicates angiotensin converting enzyme; ARB, angiotensin receptor blocker; ARIC, Atherosclerosis Risk in Communities; BMI, body mass index; bpm, beats per minute; Ca, calcium; DBP, diastolic blood pressure; eGFR, estimate glomerular filtration rate; HOMA-IR, homeostatic model for assessment of insulin resistance; NTproBNP, N terminal pro B type natriuretic peptide; SBP, systolic blood pressure; UACR, urine albumin creatinine ratio.
HOMA-IR determined only among individuals without diabetes mellitus (n=7652).
Figure 1.
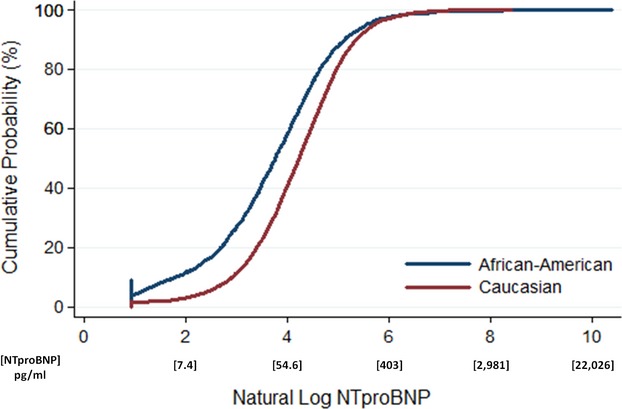
Cumulative distribution plot of log NTproBNP levels according to race in ARIC. Natural log NTproBNP values are lower in African Americans, as compared to Caucasians (P<0.001). For example, the frequency of natural log NTproBNP levels ≤4 (NTproBNP=54.6 pg/mL) is ≈60% in African Americans, compared to 40% of Caucasians. The lower limit of the natural log of NTproBNP is truncated at 0.92 based upon the lowest value of NTproBNP of 2.5 pg/mL. ARIC indicates Atherosclerosis Risk in Communities; NTproBNP, N-terminal pro B-type natriuretic peptide.
Race and Plasma NTproBNP Levels: Multivariable Analyses
In multivariable linear regression analysis, adjusted log NTproBNP levels were significantly lower (–40%; 95% CI, −43, −36) in African Americans than Caucasians, independent of other factors associated with NTproBNP levels (Figure 2). Covariates also associated with lower NTproBNP levels included male gender, higher BMI, heart rate, and DBP, as well as higher glucose and eGFR. In contrast, covariates associated with higher levels of NTproBNP included increasing age, lower household income, beta-blocker use, current smoking, higher SBP, and presence of microalbuminuria. With inclusion of HOMA-IR into the multivariable linear regression model, increased insulin resistance was also significantly associated with lower NTproBNP levels (−14%; 95% CI, −16, −11), although this did not attenuate the relationship between African-American race and lower plasma NTproBNP levels (−37%; 95% CI, −41, −33). In subgroup analyses, NTproBNP levels were consistently lower in African Americans, as compared to Caucasians (Figure 2).
Figure 2.
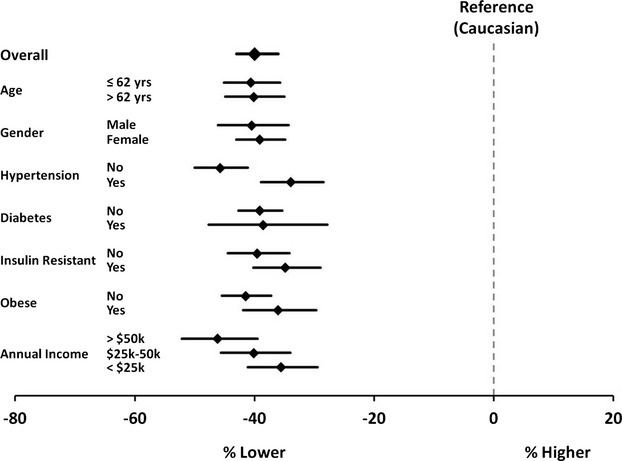
Forest plot of percent difference in log NTproBNP levels in African Americans, compared to Caucasians, overall and across subgroups of ARIC participants. African-American race is significantly associated with lower NTproBNP levels, as compared to Caucasians, in the overall study population and within subgroups. Values shown are from multivariable adjusted linear regression analyses (see Methods for covariates). For the insulin-resistant subgroups, HOMA-IR was included as an additional covariate in the multivariable adjusted analyses. ARIC indicates Atherosclerosis Risk in Communities; HOMA-IR, homeostatic model for assessment of insulin resistance; NTproBNP, N-terminal pro B-type natriuretic peptide.
Multivariable logistic regression was performed to examine factors associated with nondetectable plasma NT-proBNP levels (Table 2). After multivariable adjustment, African-American race was associated with significantly increased odds of having nondetectable levels (multivariable adjusted odds ratio [OR], 5.74; 95% CI, 4.22, 7.80). In an additional analysis with inclusion of HOMA-IR in the model, African-American race remained significantly associated with increased odds of nondetectable NTproBNP (OR, 5.51; 95% CI, 3.91, 7.77).
Table 2.
Characteristics Significantly Associated With Nondetectable Plasma NTproBNP Among ARIC Participants
| NTproBNP Nondetectable N=314 | NTproBNP Detectable N=8823 | P Value | OR* | |
|---|---|---|---|---|
| Race, African American, % | 56 | 20 | <0.001 | 5.74 (4.22, 7.80) |
| Gender, male (%) | 73 | 40 | <0.001 | 4.97 (3.61, 6.83) |
| BMI, kg/m2 | 29.9 (27.1, 32.6) | 27.8 (24.8, 31.4) | <0.0001 | 1.29 (1.12, 1.48) |
| Heart rate, bpm | 68 (64, 74) | 66 (60, 72) | <0.0001 | 1.32 (1.15, 1.52) |
| DBP, mm Hg | 74 (68, 80) | 71 (64, 77) | <0.0001 | 1.23 (1.01, 1.52) |
| Fasting glucose, mg/dL | 105 (98, 116) | 99 (93, 108) | <0.0001 | 1.19 (1.05, 1.35) |
| eGFR, mL/min per 1.73 m2 | 102 (91, 111) | 94 (83, 103) | <0.0001 | 1.18 (1.00, 1.38) |
Nondetectable plasma defined as NTproBNP <5 pg/mL. Data presented as percentage or median (interquartile range) for categorical and continuous data, respectively. ARIC indicates Atherosclerosis Risk in Communities; BMI, body mass index; bpm, beats per minute; DBP, diastolic blood pressure; eGFR, estimate glomerular filtration rate; NTproBNP, N terminal pro B type natriuretic peptide; OR, odds ratio.
OR adjusted for all covariates listed plus age, annual household income, history of hypertension, systolic blood pressure, antihypertensive medication class, diabetes mellitus, smoking status, and the presence of microalbuminuria. ORs for continuous variables reflect odds per 1 SD (BMI=5.5 kg/m2; heart rate=9.5 bpm; DBP=10 mm Hg; fasting glucose=31 mg/dL; eGFR=16.5 mL/min per 1.73 m2).
Influence of Genetic Ancestry on Plasma NTproBNP Levels Among African Americans
Among the 1656 African Americans in whom PEA data were available, median PEA was 15% (IQR, 11, 23). In multivariable linear regression models, a 1 SD (10%) increase in PEA was associated with 7% (95% CI, 1, 13) higher adjusted NTproBNP levels (P=0.025; Figure 3).
Figure 3.
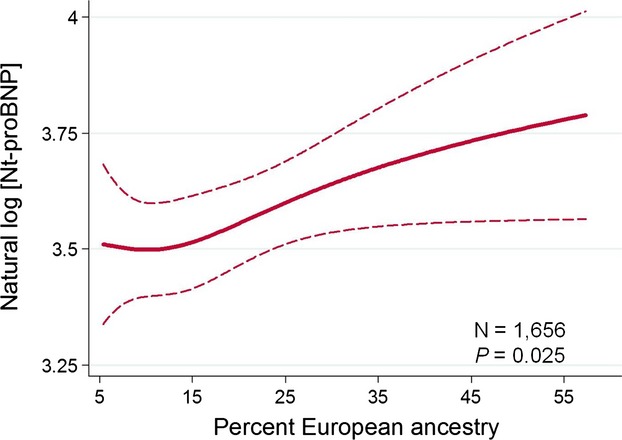
The relationship between genetically determined percent European ancestry and plasma NTproBNP levels among self-reported African Americans in ARIC. Among self-reported African Americans, with increasing proportion of European ancestry, there is a significant increase in plasma NTproBNP levels. ARIC indicates Atherosclerosis Risk in Communities; NTproBNP, N-terminal pro B-type natriuretic peptide.
Discussion
Our principal finding is that African Americans have substantially lower plasma NTproBNP levels, compared to Caucasians. The lower levels of plasma NTproBNP in African-American individuals were observed across clinically relevant subgroups and appeared to be independent of other factors associated with low levels of NTproBNP, including obesity and insulin resistance. PEA among African Americans also correlated with NTproBNP levels, which not only supports the observation of racial differences in NP levels, but also suggests a genetic basis for lower NP levels between individuals of West-African and European ancestry. Given that previous experimental, genetic, and clinical studies support that reductions in NP secretion are associated with salt-sensitive HTN and incident DM,2,4 our finding of lower levels of circulating NP levels in African-American individuals may, in part, explain the increased susceptibility to HTN and DM. Furthermore, the relative reduction in NTproBNP level in African Americans versus Caucasians observed in our study (≈40%) is comparable to that reported with obesity (20% to 40%),20 suggesting physiological and clinical significance.
Previous studies of hospitalized patients suggest that African Americans may have lower NP levels than Caucasians.2,7–9 However, these studies largely evaluated persons presenting to the emergency department, such that the coexistence of prevalent CVD and risk factors may have confounded the associations between race and NP levels.7,9,21 In contrast, the ARIC Study afforded the opportunity to examine the impact of race on NP levels in a community-based cohort of more than 9000 individuals free of prevalent CVD. This sample size also allowed adjustment for confounding factors, and we found that African Americans had lower plasma NTproBNP levels than Caucasians, despite greater frequencies of female gender, HTN, microalbuminuria, and lower socioeconomic status among African Americans, each of which correlated with higher, rather than lower, levels of NP. Moreover, the finding of lower levels of plasma NTproBNP in African Americans was independent of other factors previously reported to be associated with low levels of NTproBNP, including obesity, insulin resistance, and DM. The significant and independent association between PEA and NTproBNP levels among African Americans also suggests a genetic basis for lower NP levels in African Americans.
Mechanisms for Reduced NTproBNP Levels in African Americans
African Americans have a higher prevalence of HTN, left ventricular hypertrophy, and microalbuminuria, conditions that should raise NP levels.6,22–24 Consequently, the finding in ARIC that African-American individuals have lower NP levels, compared to white individuals, is counterintuitive and suggests that nonhemodynamic factors may contribute. The association between PEA and NTproBNP levels among African Americans indicates an underlying genetic component. One biologically plausible way in which NP levels may be decreased is through impaired synthesis or reduced release from cardiomyocytes. Indeed, previous studies indicate that variations in processes related to the synthesis of NTproBNP, such as genetic polymorphisms in the NPPB gene that influence transcription, translation, and/or post-translational processing, may contribute to lower NTproBNP levels, although there are limited data on racial differences in the genetics of the NP system.25
Alternatively, non-NPPB gene variations that affect NP production and processing may be involved as well. For example, corin is a protein that is partly responsible for cleavage of NPs into the active carboxy-terminus hormone and inactive amino-terminus propeptide.26 Variants in the corin gene are more common among African Americans, and experimental mouse models overexpressing the corin variant observed in African Americans demonstrate increased salt sensitivity, HTN, and hypertrophy, thereby recapitulating the clinical phenotype.4,27 However, variation in the corin gene may not fully explain the observed lower levels of NTproBNP in ARIC given that the assay used detects both the 76-amino-acid NTproBNP as well as the full 108-amino-acid prohormone (proBNP),28 suggesting that NP levels in African Americans may, in part, be regulated upstream of corin. Future studies quantifying circulating proBNP, NTproBNP, and BNP levels may help clarify the role of corin mutations in African Americans, but are beyond the scope of this study.
Clearance of NTproBNP is not mediated through the same processes that lead to clearance of the active hormone, BNP.29 Therefore, it is also possible that the lower levels of NTproBNP observed among African Americans may be related to enhanced clearance in African Americans, compared to Caucasians. BNP levels were not measured in ARIC; however, NTproBNP and BNP levels have previously been demonstrated to be highly correlated,30,31 suggesting that lower NTproBNP levels also reflect lower BNP levels, and that differences in NP between races may be determined upstream of clearance in NP regulation pathways. However, further studies are needed to elucidate and clarify the relative importance of synthesis, release, and clearance mechanisms to the lower NP levels observed in African Americans.
Strengths and Limitations
Strengths of the present investigation include the large sample size, routine measurement of plasma NTproBNP in a community-dwelling population, standard ascertainment of clinical characteristics, use of multivariable adjusted analyses, and consistency of the finding of lower plasma NTproBNP levels across several sensitivity and subgroup analyses. However, limitations should be noted. Plasma NTproBNP levels in ambulatory community-dwelling participants may be below the limit of detection; however, in a sensitivity analysis restricted to individuals with detectable levels, plasma NTproBNP remained significantly lower in African Americans, as compared to Caucasians. Plasma BNP was not measured in ARIC; therefore, it is possible that active NP hormone levels may not differ according to race. However, NTproBNP and BNP levels are highly correlated, even within a range of values well below thresholds diagnostic of heart failure.30–32 Atrial natriuretic peptide (ANP) was not measured in ARIC, although other studies have indicated that mid-regional pro-ANP levels may also be lower in African Americans, compared to Caucasians.9 We did not assess cardiac structure and function with echocardiography, given that these measures were not obtained during ARIC visit 4. However, compared to Caucasians, African Americans tend to have greater wall thickness,24 which is typically associated with higher NP levels and therefore should bias the result toward the null; however, we found that plasma NTproBNP levels were significantly lower in African Americans, lending further validity to these results. Though we adjusted for multiple factors that may contribute to NTproBNP levels, there may be residual confounding. In the estimation of PEA, which is based upon samples from West Africa and Europe, there may be misclassification bias owing to inability to account for local ancestry. Further studies are needed to elucidate specific genetic loci related to NP levels in African Americans. Finally, in this cross-sectional study, we cannot determine a causal association between low plasma NP levels and HTN, obesity, and/or DM. However, it has previously been demonstrated in ARIC that low plasma NP levels are associated with increased risk for DM.2,3
Conclusion
We found a strong and independent association between race and NP levels. The lower NTproBNP levels observed in African Americans, compared to Caucasians, may help to explain racial disparities in cardiometabolic risk given that lower NP levels may increase the risk of HTN, obesity, and DM, conditions more prevalent among African Americans. However, further studies are needed to confirm the causal role of NPs and clarify the mechanisms leading to lower levels of NP, of which our results suggest that genetic variation likely contributes. Ultimately, augmentation of the NP system in individuals with a relative NP deficiency may prove to be an efficacious strategy for the prevention of cardiometabolic risk.
Acknowledgments
The authors thank the staff and participants of the ARIC Study for their important contributions.
Source of Funding
The Atherosclerosis Risk in Communities Study is carried out as a collaborative study supported by National Heart, Lung, and Blood Institute (NHLBI) contracts (HHSN268201100005C, HHSN268201100006C, HHSN268201100007C, HHSN268201100008C, HHSN268201100009C, HHSN268201100010C, HHSN268201100011C, and HHSN268201100012C). Gupta is supported by Award No. K12HL109019 from the NHLBI. The project described was supported by CTSA Award No. UL1TR000445 from the National Center for Advancing Translational Sciences (NCATS). Its contents are solely the responsibility of the authors and do not necessarily represent official views of the NCATS or the National Institutes of Health.
Disclosures
None.
References
- Wang TJ. The natriuretic peptides and fat metabolism. N Engl J Med. 2012;367:377–378. doi: 10.1056/NEJMcibr1204796. [DOI] [PubMed] [Google Scholar]
- Lazo M, Young JH, Brancati FL, Coresh J, Whelton S, Ndumele CE, Hoogeveen R, Ballantyne CM, Selvin E. NH2-terminal pro-brain natriuretic peptide and risk of diabetes. Diabetes. 2013;62:3189–3193. doi: 10.2337/db13-0478. [DOI] [PMC free article] [PubMed] [Google Scholar]
- Magnusson M, Jujic A, Hedblad B, Engstrom G, Persson M, Struck J, Morgenthaler NG, Nilsson P, Newton-Cheh C, Wang TJ, Melander O. Low plasma level of atrial natriuretic peptide predicts development of diabetes: the prospective Malmo Diet and Cancer Study. J Clin Endocrinol Metab. 2012;97:638–645. doi: 10.1210/jc.2011-2425. [DOI] [PMC free article] [PubMed] [Google Scholar]
- Wang W, Cui Y, Shen J, Jiang J, Chen S, Peng J, Wu Q. Salt-sensitive hypertension and cardiac hypertrophy in transgenic mice expressing a corin variant identified in blacks. Hypertension. 2012;60:1352–1358. doi: 10.1161/HYPERTENSIONAHA.112.201244. [DOI] [PMC free article] [PubMed] [Google Scholar]
- Abdullah SM, Khera A, Das SR, Stanek HG, Canham RM, Chung AK, Morrow DA, Drazner MH, McGuire DK, de Lemos JA. Relation of coronary atherosclerosis determined by electron beam computed tomography and plasma levels of N-terminal pro-brain natriuretic peptide in a multiethnic population-based sample (the Dallas Heart Study) Am J Cardiol. 2005;96:1284–1289. doi: 10.1016/j.amjcard.2005.06.073. [DOI] [PubMed] [Google Scholar]
- Go AS, Mozaffarian D, Roger VL, Benjamin EJ, Berry JD, Blaha MJ, Dai S, Ford ES, Fox CS, Franco S, Fullerton HJ, Gillespie C, Hailpern SM, Heit JA, Howard VJ, Huffman MD, Judd SE, Kissela BM, Kittner SJ, Lackland DT, Lichtman JH, Lisabeth LD, Mackey RH, Magid DJ, Marcus GM, Marelli A, Matchar DB, McGuire DK, Mohler ER, III, Moy CS, Mussolino ME, Neumar RW, Nichol G, Pandey DK, Paynter NP, Reeves MJ, Sorlie PD, Stein J, Towfighi A, Turan TN, Virani SS, Wong ND, Woo D, Turner MB American Heart Association Statistics C, Stroke Statistics S. Heart disease and stroke statistics—2014 update: a report from the American Heart Association. Circulation. 2014;129:e28–e292. doi: 10.1161/01.cir.0000441139.02102.80. [DOI] [PMC free article] [PubMed] [Google Scholar]
- Krauser DG, Chen AA, Tung R, Anwaruddin S, Baggish AL, Januzzi JL., Jr Neither race nor gender influences the usefulness of amino-terminal pro-brain natriuretic peptide testing in dyspneic subjects: a ProBNP investigation of dyspnea in the emergency department (PRIDE) substudy. J Card Fail. 2006;12:452–457. doi: 10.1016/j.cardfail.2006.04.005. [DOI] [PubMed] [Google Scholar]
- Montagnana M, Lippi G, Salvagno GL, Guidi GC. Reference ranges and diagnostic thresholds of laboratory markers of cardiac damage and dysfunction in a population of apparently healthy black Africans. Clin Chem Lab Med. 2008;46:714–716. doi: 10.1515/cclm.2008.130. [DOI] [PubMed] [Google Scholar]
- Daniels LB, Clopton P, Potocki M, Mueller C, McCord J, Richards M, Hartmann O, Anand IS, Wu AH, Nowak R, Peacock WF, Ponikowski P, Mockel M, Hogan C, Filippatos GS, Di Somma S, Ng L, Neath SX, Christenson R, Morgenthaler NG, Anker SD, Maisel AS. Influence of age, race, sex, and body mass index on interpretation of midregional pro atrial natriuretic peptide for the diagnosis of acute heart failure: results from the BACH multinational study. Eur J Heart Fail. 2012;14:22–31. doi: 10.1093/eurjhf/hfr157. [DOI] [PubMed] [Google Scholar]
- Choi EY, Bahrami H, Wu CO, Greenland P, Cushman M, Daniels LB, Almeida AL, Yoneyama K, Opdahl A, Jain A, Criqui MH, Siscovick D, Darwin C, Maisel A, Bluemke DA, Lima JA. N-terminal pro-B-type natriuretic peptide, left ventricular mass, and incident heart failure: Multi-Ethnic Study of Atherosclerosis. Circ Heart Fail. 2012;5:727–734. doi: 10.1161/CIRCHEARTFAILURE.112.968701. [DOI] [PMC free article] [PubMed] [Google Scholar]
- The Atherosclerosis Risk in Communities (ARIC) study: design and objectives. The ARIC investigators. Am J Epidemiol. 1989;129:687–702. [PubMed] [Google Scholar]
- Nambi V, Liu X, Chambless LE, de Lemos JA, Virani SS, Agarwal S, Boerwinkle E, Hoogeveen RC, Aguilar D, Astor BC, Srinivas PR, Deswal A, Mosley TH, Coresh J, Folsom AR, Heiss G, Ballantyne CM. Troponin T and N-terminal pro-B-type natriuretic peptide: a biomarker approach to predict heart failure risk—the Atherosclerosis Risk in Communities study. Clin Chem. 2013;59:1802–1810. doi: 10.1373/clinchem.2013.203638. [DOI] [PMC free article] [PubMed] [Google Scholar]
- Folsom AR, Yamagishi K, Hozawa A, Chambless LE. Absolute and attributable risks of heart failure incidence in relation to optimal risk factors. Circ Heart Fail. 2009;2:11–17. doi: 10.1161/CIRCHEARTFAILURE.108.794933. [DOI] [PMC free article] [PubMed] [Google Scholar]
- Gress TW, Nieto FJ, Shahar E, Wofford MR, Brancati FL. Hypertension and antihypertensive therapy as risk factors for type 2 diabetes mellitus. Atherosclerosis Risk in Communities study. N Engl J Med. 2000;342:905–912. doi: 10.1056/NEJM200003303421301. [DOI] [PubMed] [Google Scholar]
- Kottgen A, Russell SD, Loehr LR, Crainiceanu CM, Rosamond WD, Chang PP, Chambless LE, Coresh J. Reduced kidney function as a risk factor for incident heart failure: the Atherosclerosis Risk in Communities (ARIC) study. J Am Soc Nephrol. 2007;18:1307–1315. doi: 10.1681/ASN.2006101159. [DOI] [PubMed] [Google Scholar]
- Vardeny O, Gupta DK, Claggett B, Burke S, Shah A, Loehr L, Rasmussen-Torvik L, Selvin E, Chang PP, Aguilar D, Solomon SD. Insulin resistance and incident heart failure the ARIC study (Atherosclerosis Risk in Communities) JACC Heart Fail. 2013;1:531–536. doi: 10.1016/j.jchf.2013.07.006. [DOI] [PMC free article] [PubMed] [Google Scholar]
- Blecker S, Matsushita K, Kottgen A, Loehr LR, Bertoni AG, Boulware LE, Coresh J. High-normal albuminuria and risk of heart failure in the community. Am J Kidney Dis. 2011;58:47–55. doi: 10.1053/j.ajkd.2011.02.391. [DOI] [PMC free article] [PubMed] [Google Scholar]
- Cheng CY, Reich D, Coresh J, Boerwinkle E, Patterson N, Li M, North KE, Tandon A, Bailey-Wilson JE, Wilson JG, Kao WH. Admixture mapping of obesity-related traits in African Americans: the Atherosclerosis Risk in Communities (ARIC) study. Obesity (Silver Spring) 2010;18:563–572. doi: 10.1038/oby.2009.282. [DOI] [PMC free article] [PubMed] [Google Scholar]
- Maruthur NM, Kao WH, Clark JM, Brancati FL, Cheng CY, Pankow JS, Selvin E. Does genetic ancestry explain higher values of glycated hemoglobin in African Americans? Diabetes. 2011;60:2434–2438. doi: 10.2337/db11-0319. [DOI] [PMC free article] [PubMed] [Google Scholar]
- Wang TJ, Larson MG, Levy D, Benjamin EJ, Leip EP, Wilson PW, Vasan RS. Impact of obesity on plasma natriuretic peptide levels. Circulation. 2004;109:594–600. doi: 10.1161/01.CIR.0000112582.16683.EA. [DOI] [PubMed] [Google Scholar]
- Maisel AS, Krishnaswamy P, Nowak RM, McCord J, Hollander JE, Duc P, Omland T, Storrow AB, Abraham WT, Wu AH, Clopton P, Steg PG, Westheim A, Knudsen CW, Perez A, Kazanegra R, Herrmann HC, McCullough PA Breathing Not Properly Multinational Study I. Rapid measurement of B-type natriuretic peptide in the emergency diagnosis of heart failure. N Engl J Med. 2002;347:161–167. doi: 10.1056/NEJMoa020233. [DOI] [PubMed] [Google Scholar]
- McClellan WM, Warnock DG, Judd S, Muntner P, Kewalramani R, Cushman M, McClure LA, Newsome BB, Howard G. Albuminuria and racial disparities in the risk for ESRD. J Am Soc Nephrol. 2011;22:1721–1728. doi: 10.1681/ASN.2010101085. [DOI] [PMC free article] [PubMed] [Google Scholar]
- Bryson CL, Ross HJ, Boyko EJ, Young BA. Racial and ethnic variations in albuminuria in the US third national health and nutrition examination survey (NHANES III) population: associations with diabetes and level of CKD. Am J Kidney Dis. 2006;48:720–726. doi: 10.1053/j.ajkd.2006.07.023. [DOI] [PubMed] [Google Scholar]
- Drazner MH, Dries DL, Peshock RM, Cooper RS, Klassen C, Kazi F, Willett D, Victor RG. Left ventricular hypertrophy is more prevalent in blacks than whites in the general population: the Dallas Heart Study. Hypertension. 2005;46:124–129. doi: 10.1161/01.HYP.0000169972.96201.8e. [DOI] [PubMed] [Google Scholar]
- Lanfear DE, Stolker JM, Marsh S, Rich MW, McLeod HL. Genetic variation in the B-type natiuretic peptide pathway affects BNP levels. Cardiovasc Drugs Ther. 2007;21:55–62. doi: 10.1007/s10557-007-6007-5. [DOI] [PubMed] [Google Scholar]
- Yan W, Wu F, Morser J, Wu Q. Corin, a transmembrane cardiac serine protease, acts as a pro-atrial natriuretic peptide-converting enzyme. Proc Natl Acad Sci USA. 2000;97:8525–8529. doi: 10.1073/pnas.150149097. [DOI] [PMC free article] [PubMed] [Google Scholar]
- Dries DL, Victor RG, Rame JE, Cooper RS, Wu X, Zhu X, Leonard D, Ho SI, Wu Q, Post W, Drazner MH. Corin gene minor allele defined by 2 missense mutations is common in blacks and associated with high blood pressure and hypertension. Circulation. 2005;112:2403–2410. doi: 10.1161/CIRCULATIONAHA.105.568881. [DOI] [PubMed] [Google Scholar]
- 2014. Indianapolis, IN Roche Diagnostics Corp Probnp II [package insert]
- Martinez-Rumayor A, Richards AM, Burnett JC, Januzzi JL., Jr Biology of the natriuretic peptides. Am J Cardiol. 2008;101:3–8. doi: 10.1016/j.amjcard.2007.11.012. [DOI] [PubMed] [Google Scholar]
- Austin WJ, Bhalla V, Hernandez-Arce I, Isakson SR, Beede J, Clopton P, Maisel AS, Fitzgerald RL. Correlation and prognostic utility of B-type natriuretic peptide and its amino-terminal fragment in patients with chronic kidney disease. Am J Clin Pathol. 2006;126:506–512. doi: 10.1309/M7AAXA0J1THMNCDF. [DOI] [PubMed] [Google Scholar]
- Richards M, Nicholls MG, Espiner EA, Lainchbury JG, Troughton RW, Elliott J, Frampton CM, Crozier IG, Yandle TG, Doughty R, MacMahon S, Sharpe N Christchurch Cardioendocrine Research G, Australia-New Zealand Heart Failure G. Comparison of B-type natriuretic peptides for assessment of cardiac function and prognosis in stable ischemic heart disease. J Am Coll Cardiol. 2006;47:52–60. doi: 10.1016/j.jacc.2005.06.085. [DOI] [PubMed] [Google Scholar]
- de Lemos JA, McGuire DK, Khera A, Das SR, Murphy SA, Omland T, Drazner MH. Screening the population for left ventricular hypertrophy and left ventricular systolic dysfunction using natriuretic peptides: results from the Dallas Heart Study. Am Heart J. 2009;157:746–753. doi: 10.1016/j.ahj.2008.12.017. [DOI] [PubMed] [Google Scholar]