

Abstract
Background
Volume overload is frequently encountered and is associated with cardiovascular risk factors in patients with chronic kidney disease (CKD). However, the relationship between volume overload and adverse outcomes in CKD is not fully understood.
Methods and Results
A prospective cohort of 338 patients with stage 3 to 5 CKD was followed for a median of 2.1 years. The study participants were stratified by the presence or absence of volume overload, defined as an overhydration index assessed by bioimpedance spectroscopy exceeding 7%, the 90th percentile for the healthy population. The primary outcome was the composite of estimated glomerular filtration rate decline ≥50% or end-stage renal disease. The secondary outcome included a composite of morbidity and mortality from cardiovascular causes. Animal models were used to simulate fluid retention observed in human CKD. We found that patients with volume overload were at a higher risk of the primary and secondary end points in the adjusted Cox models. Furthermore, overhydration appears to be more important than hypertension in predicting an elevated risk. In rats subjected to unilateral nephrectomy and a high-salt diet, the extracellular water significantly increased. This fluid retention was associated with an increase in blood pressure, proteinuria, renal inflammation with macrophage infiltration and tumor necrosis factor-α overexpression, glomerular sclerosis, and cardiac fibrosis. Diuretic treatment with indapamide attenuated these changes, suggesting that fluid retention might play a role in the development of adverse outcomes.
Conclusions
Volume overload contributes to CKD progression and cardiovascular diseases. Further research is warranted to clarify whether the correction of volume overload would improve outcomes for CKD patients.
Keywords: bioimpedance, cardiovascular disease, chronic kidney disease, hypertension, overhydration, volume overload
Chronic kidney disease (CKD) is increasingly recognized as a public health problem worldwide.1 CKD substantially increases the risks of end-stage renal disease (ESRD) and cardiovascular disease (CVD) and is associated with considerable healthcare costs.2 There is convincing evidence that the development of ESRD and CVD could be delayed by a multidisciplinary approach that controls modifiable risk factors.3,4 We previously demonstrated that volume overload is common in CKD patients and is associated with anemia, hypertension, proteinuria, arterial stiffness, and inflammation,5,6 which are strong predictors of CKD progression and CVD events. Consequently, volume overload shows great promise as a potential modifiable risk factor.
Volume overload has been linked to increased morbidity and mortality in patients undergoing long-term hemodialysis and in patients with acute kidney injury.7,8 However, the available evidence detailing the effects of volume overload in CKD patients does not use a valid technique for measuring the level of fluid status, and the values obtained cannot be compared directly with the values in the normal population. Few studies have been conducted to evaluate the association of volume overload with adverse outcomes in patients with non–dialysis-dependent CKD,9 and even fewer have been conducted by using animal models.
We hypothesized that volume overload might contribute significantly to the development of adverse clinical outcomes in patients with non–dialysis-dependent CKD. In the present study, we examined the association between volume overload and renal and cardiovascular outcomes in 338 adult patients with stage 3 to 5 CKD by using the Body Composition Monitor (BCM, Fresenius Medical Care, Bad Homburg, Germany), a novel bioimpedance spectroscopy device, to measure the volume status. Furthermore, we examined the effect of high-salt–induced fluid retention on renal and cardiac damage in uninephrectomized rats. This animal model closely simulates the volume overload observed in human CKD and provides opportunities to investigate causality and disease-specific mechanisms.
Materials and Methods
Patients and Laboratory Measurements
The study design and population were previously described.6 Briefly, 338 patients with stage 3 to 5 CKD who were referred to the nephrology clinic at Taipei Tzu Chi Hospital, Taiwan between September 1, 2011, and December 31, 2012, were enrolled in the study and were followed until June 30, 2014. In all of the patients, a thorough medical history was taken and the medical chart was reviewed at the time of study enrollment. Diabetes mellitus was assumed to be present in patients who reported the current or past use of insulin and/or oral antidiabetic agents. Hypertension was defined on the basis of a blood pressure (BP) ≥140/90 mm Hg or current therapy for hypertension. The presence of CVD was defined as a medical history and clinical findings of congestive heart failure, coronary artery disease, as documented by coronary angiography or a history of myocardial infarction, and/or cerebrovascular disease. The primary outcome was the first occurrence of a decline in the estimated glomerular filtration rate (eGFR) ≥50% or ESRD needing chronic dialysis. The secondary outcome, morbidity and mortality from cardiovascular causes, was a composite of the first occurrence of myocardial infarction, hospitalization for congestive heart failure or unstable angina, or death from cardiovascular causes. Changes in the eGFR were confirmed at least 4 weeks after the treatment of potentially reversible factors. The timing of the initiation of chronic dialysis was determined according to the regulations of the National Health Insurance Administration of Taiwan. CVD deaths included fatal myocardial infarction, congestive heart failure, arrhythmia, and sudden death. The patients were followed every 3 months. For the primary outcome, patients were censored at the time of their last outpatient visit, death, or end of follow-up period, whereas for the secondary outcome, patients were censored at the time of their last outpatient visit, noncardiovascular death, or end of follow-up period. The study protocol was approved by the Institutional Review Board of Taipei Tzu Chi Hospital. Informed consent was obtained from all of the participants, and our study complies with the Declaration of Helsinki.
BP was measured by use of an automated oscillometric sphygmomanometry (Welch Allyn, Series 300). All of the study personnel were trained to use the device, to select an appropriately sized arm cuff, and to start the measurements after 10 minutes of rest with the subject having voided and being seated quietly in a straight-back chair with the arm at heart level. The plasma levels of interleukin 6 (IL-6), tumor necrosis factor α (TNF-α) (R&D Systems), and N-terminal pro-brain natriuretic peptide (NT-proBNP) (Roche Diagnostics) were measured by using commercially available ELISA kits according to the manufacturer’s instructions. The serum albumin level was determined by using a bromocresol purple (BCP) assay. Proteinuria was expressed as the ratio of urine protein to creatinine (UPCR) determined by using the first morning void.
Measurement of Human Volume Status
The fluid status was assessed by using the BCM and was represented by the level of overhydration (OH). The BCM measures the electrical responses at 50 different frequencies from 5 to 1000 kHz. OH is derived from the impedance data based on a unique 3-compartment model of OH, lean tissue mass, and adipose tissue mass.10 OH is the difference between the amount of extracellular water (ECW) in tissue that is detected by the BCM and the amount of ECW in tissue that is predicted by using physiological models under normal (euvolemic) conditions. Therefore, the OH value obtained from the BCM can be compared directly with the value for the normal population. Volume overload was defined as a relative OH value (OH normalized to ECW or OH/ECW) ≥7%, which corresponds to the value of the 90th percentile for the healthy population.11 The same reference range of OH has been validated in Taiwanese individuals.6 The investigators and participants were blinded to the OH results.
Animals and Laboratory Measurements
Because the clinical observations do not represent causality, animal models are used to simulate and elucidate the volume overload observed in human CKD. Three-week-old male Sprague–Dawley rats (n=40) were randomly assigned to receive a sham operation or uninephrectomy (anesthetized with pentobarbital 50 mg/kg IP) and were then subjected to either a normal-salt (0.4%) or high-salt (8.0%) diet from 4 to 8 weeks of age. The salt-loaded uninephrectomized rats were treated with indapamide (IDP, 3 mg/kg per day orally) to investigate the role of volume overload in exacerbating cardiac and renal injury in CKD. Five different experimental groups were created: sham-operated rats raised with a normal- (Sham+NS) or high-salt diet (Sham+HS), uninephrectomized rats raised with a normal- (UNX+NS) or high-salt diet (UNX+HS), and IDP-treated UNX+HS rats (UNX+HS+IDP). All of the rats were housed in a room maintained at 21 to 23°C with a 12-hour light/dark cycle and were provided food and water ad libitum. All of the rats were placed in metabolic cages for 24 hours, and food and water consumption, urine volume, and urine sodium, protein, and creatinine levels were measured at baseline and after 4 weeks of different salt intake. At the end of the experiment, the rats were killed by decapitation, and the serum, kidneys, and hearts were collected. The kidney and heart samples were fixed in 10% formalin solution and then embedded in paraffin for histological analysis. The harvested kidney and heart tissues were frozen in liquid nitrogen and stored at −80°C for protein isolation. All of the animal studies were performed under a protocol approved by the ethics committees on animal research of the Faculty of Medicine, National Yang-Ming University.
Systolic BP (SBP) was measured by using the tail-cuff method (NIBP-06, Singa Technology Corporation). Conscious rats were put in restrainers for habituation 10 to 15 minutes prior to readings being taken. The serum levels of TNF-α (R&D Systems) were measured by using commercially available ELISA kits according to the manufacturer’s instructions. Frozen renal samples were homogenized (1 mL/0.1 g kidney tissues) and sonicated with homogenizing buffer. The homogenate was then centrifuged to remove tissue debris. The supernatant was aliquoted and stored at −20°C. An ELISA was performed to assess TNF-α (BD Biosciences). Proteinuria was expressed as UPCR. For the morphological evaluations, paraffinized kidney sections (3-μm thickness) were stained with periodic acid–Schiff (PAS) reagents (Sigma-Aldrich) and analyzed semiquantitatively for the severity of glomerulosclerosis as described previously. Glomerulosclerosis was graded on a scale of 0 to 4, with 0 indicating normal, 1 indicating 1% to 25% of glomeruli with sclerotic lesions, 2 indicating 26% to 50% of glomeruli with sclerotic lesions, 3 indicating 51% to 75%, and 4 indicating >75% of sclerotic glomeruli. In a similar manner, cardiac fibrosis was scored for all conditions on Masson trichrome–stained (Sigma-Aldrich) sections. The blue region of the section represented collagen-enriched areas, and the cellular elements stained red. High-power fields (magnification ×400) were selected randomly and digitalized by using a video camera; software (Image-Pro PLUS version 6.0) was subsequently used to compute the percentage of the blue-stained region in the total area. ED1 (AbD Serotec) immunostaining was used as a marker of rat macrophages in renal tissues. The infiltration of macrophages was assessed by counting the ED-1–positive cells in 10 to 15 randomly selected cortical fields (magnification ×400).
Measurement of Animal Volume Status
The ImpediVet (ImpediMed) analyzes whole-body bioimpedance data to determine the total body water (TBW) and ECW. The ECW/TBW was then taken as a measure of volume status. Briefly, the rats were anesthetized and measured for length and weight. The animal was placed in the prone position and shaved to allow adequate skin contact at the sites of needle placement. Four needles (25 gauge × 25 mm) bent at 90°, 5 mm from the tip, were inserted under the skin at the base of the tail, at the intercept between the front of the ears and the longitudinal midline and at 2 cm from these sites toward the tip of the tail and the nose. The measurements were initiated after the leads were attached to the needles. Volume status was measured at baseline and at the end of the experiment.
Statistical Analysis
All of the variables were expressed as the frequencies and percentages for categorical data and as the mean±SD values or medians and interquartile ranges for continuous data with or without a normal distribution, respectively. Differences between 2 groups were compared by using the χ2 test for categorical variables and unpaired t test or Mann–Whitney U test for continuous variables. Differences among >2 groups were compared by using χ2 statistics, 1-way or 2-way ANOVA followed by appropriate post-hoc tests, or Kruskal–Wallis test, as appropriate. Cumulative survival curves for the composite outcome were generated by using the Kaplan–Meier method. Cox proportional hazards modeling was used to estimate the hazard ratios (HRs) with unadjusted, minimally adjusted (for age and sex), and multivariable adjusted models (for age, sex, CVD, diabetes mellitus, SBP, the use of angiotensin-converting enzyme inhibitors/angiotensin II receptor blockers, eGFR, and UPCR cut at 0.5, which is the border between microalbuminuria and macroalbuminuria). Because the event rate was relatively low, we avoided overfitting the model by selecting 8 covariates for multivariable adjustments.12 Furthermore, we did not adjust for related covariates such as NT-proBNP or serum albumin due to their strong correlation with fluid retention. The proportional hazard assumption, which was the constant HR over time, was assessed by comparing the estimated log–log survival curves for all of the time-independent covariates. All of the assessed log–log survival plots graphically showed 2 parallel lines, indicating no violation of the assumption. A 2-tailed P value <0.05 was considered statistically significant. The analyses were performed by using SPSS version 20.0 (SPSS Inc).
Results
Patients
Primary outcome
The baseline characteristics of the patients, divided based on the absence or presence of volume overload, are presented in Table 1. During a median follow up of 2.1 years, 78 patients in the volume-overload group (44.6%) reached the primary end point, compared with 22 in the euvolemia group (13.5%). In addition, 71 patients (21%) progressed to ESRD needing chronic dialysis. The decline in eGFR in patients with volume overload was significantly faster than those without volume overload (eGFR slope: −4.3 [−12.6, 1.2] versus −1.7 [−7.8, 2.7] mL/min per 1.73 m2 per year, respectively; P<0.05). Kaplan–Meier survival analysis showed a significantly higher CKD progression or ESRD in the patients with volume overload (P<0.001 by the log-rank test). In the multivariable regression analysis (Table 2), the patients with volume overload had greater than double the risk of the composite end point (adjusted HR 2.45, 95% confidence interval [CI] 1.45 to 4.13; P=0.001). To further elucidate the contribution of elevated OH levels, we performed multivariable Cox analyses with OH as a continuous variable. These analyses confirmed an increased risk of the composite end point (adjusted HR 1.26, 95% CI 1.12 to 1.42; P<0.001) for every 1-L increase in OH.
Table 1.
Comparisons of CKD Patients With or Without Volume Overload
| Characteristics | Total (n=338) | Euvolemia (n=163) | Volume Overload (n=175) | P Value* |
|---|---|---|---|---|
| OH, % | 8.3±8.6 | 1.3±3.9 | 14.9±6.2 | <0.001 |
| ECW/TBW, % | 47.2±3.3 | 44.9±2.4 | 49.3±2.7 | <0.001 |
| NT-proBNP, ng/L | 241.7 (77.9 to 771.3) | 112.0 (46.0 to 280.5) | 530.7 (177.4 to 1275.0) | <0.001 |
| Age, y | 65.7±13.5 | 65.0±14.2 | 66.4±12.8 | 0.32 |
| Male sex, n (%) | 233 (68.9) | 111 (68.1) | 122 (69.7) | 0.75 |
| Smoking history, n (%) | 71 (21.0) | 32 (19.6) | 39 (22.3) | 0.55 |
| DM, n (%) | 153 (45.3) | 45 (27.6) | 108 (61.7) | <0.001 |
| CVD, n (%) | 79 (23.4) | 23 (14.1) | 56 (32) | <0.001 |
| SBP, mm Hg | 138±17 | 133±15 | 142±18 | <0.001 |
| Diuretics, n (%) | 113 (33.4) | 42 (25.8) | 71 (40.6) | 0.004 |
| RAS blockers, n (%) | 200 (59.2) | 95 (58.3) | 105 (60) | 0.75 |
| Statins, n (%) | 87 (25.7) | 37 (22.7) | 50 (28.6) | 0.22 |
| baPWV, m/s | 15.9±3.0 | 15.1±2.8 | 16.2±2.8 | <0.001 |
| BMI, kg/m2 | 25.8±4.3 | 25.7±4.1 | 26.1±4.3 | 0.46 |
| eGFR,† mL/min per 1.73 m2 | 28.7±15.0 | 31.5±14.8 | 26.1±14.7 | 0.001 |
| UPCR, g/g | 0.92 (0.31 to 2.45) | 0.49 (0.22 to 1.26) | 1.67 (0.62 to 4.19) | <0.001 |
| Serum sodium, meq/L | 136.4±4.1 | 135.6±4.2 | 137.0±3.0 | 0.001 |
| Albumin, g/dL | 3.6±0.4 | 3.8±0.3 | 3.4±0.4 | <0.001 |
| IL-6, pg/mL | 3.55 (2.08 to 6.13) | 2.87 (1.64 to 4.59) | 4.28 (2.62 to 8.33) | <0.001 |
| TNF-α, pg/mL | 6.73 (4.69 to 9.42) | 5.63 (4.13 to 8.07) | 7.96 (5.37 to 10.34) | <0.001 |
baPWV indicates brachial-ankle pulse wave velocity; BMI, body mass index; CKD, chronic kidney disease; CVD, cardiovascular disease; DM, diabetes mellitus; ECW, extracellular water; eGFR, estimated glomerular filtration rate; IL-6, interleukin-6; MDRD, modification of diet in renal disease; NT-proBNP, N-terminal pro-brain natriuretic peptide; OH, overhydration; RAS, renin-angiotensin system; SBP, systolic blood pressure; TBW, total body water; TNF-α, tumor necrosis factor α; UPCR, urine protein-creatinine ratio.
Comparison between euvolemia and volume overload.
eGFR calculated by MDRD equation.
Table 2.
HRs for Renal and Cardiovascular Outcomes by Categorical or Continuous Measure of OH
| OH | Unadjusted | Model 1 | Model 2 | Model 3 |
|---|---|---|---|---|
| HR (95% CI) | HR (95% CI) | HR (95% CI) | HR (95% CI) | |
| Primary outcome: eGFR decline ≥50% or chronic dialysis | ||||
| ≥7% vs <7% | 4.33 (2.69 to 6.97)* | 4.56 (2.83 to 7.36)* | 3.63 (2.20 to 5.99)* | 2.44 (1.44 to 4.13)† |
| 1 L increase | 1.29 (1.19 to 1.39)* | 1.34 (1.23 to 1.45)* | 1.26 (1.14 to 1.39)* | 1.25 (1.11 to 1.41)* |
| Secondary outcome: cardiovascular morbidity or mortality | ||||
| ≥7% vs <7% | 6.37 (2.85 to 14.23)* | 6.22 (2.78 to 13.92)* | 3.84 (1.68 to 8.76)† | 2.71 (1.14 to 6.48)† |
| 1 L increase | 1.28 (1.15 to 1.43)* | 1.42 (1.25 to 1.62)* | 1.28 (1.09 to 1.50)† | 1.25 (1.04 to 1.51)† |
Model 1 is adjusted for age and sex. Model 2 is adjusted for the model 1 variables and for cardiovascular disease, diabetes mellitus, systolic blood pressure, and the use of angiotensin-converting enzyme inhibitors/angiotensin II receptor blockers. Model 3 is adjusted for the model 2 variables and for eGFR, and a urine protein–creatinine ratio cut-off value of 0.5. eGFR indicates estimated glomerular filtration rate; HR, hazard ratio; OH, overhydration.
P<0.001.
P<0.05.
Secondary outcome
Volume overload had a similar predictive effect in cardiovascular morbidity and mortality (Table 2). Forty-seven patients reached the secondary end point (40 in the volume-overload group [22.9%] and 7 in the euvolemia group [4.3%]). Thirteen patients died of cardiovascular causes (11 in the volume-overload group [6.3%] and 2 in the euvolemia group [1.2%]). The rate of first hospitalization for congestive heart failure was significantly higher in the volume-overload group (24 patients [13.7%] compared with 2 in the euvolemia group [1.2%]). There was also a significant difference between the number of coronary events in the volume-overload group (13 patients [7.4%] compared with 5 in the euvolemia group [3.1%]).
Overhydration, hypertension, and outcomes
The patients were further classified according to the baseline SBP (categories: <140 or ≥140 mm Hg) and OH (categories: <7 or ≥7%) to investigate if volume overload had a higher predictive value of an increased risk for the composite outcome than hypertension. The following 4 groups could be identified: patients who are normohydrated and normotensive (32%), patients who are hypertensive despite being normohydrated (17%, non–volume-dependent hypertension); patients who are normotensive despite being volume overloaded (22%); and patients who are both volume overloaded and hypertensive (29%, volume-dependent hypertension) (Table 3, Figure 1). Kaplan–Meier analyses revealed a significant association between volume overload and the primary or secondary outcome (P<0.001 by the log-rank test) (Figure 2). By multivariable regression analysis, the risk of primary or secondary outcome in patients with volume-dependent hypertension was significantly greater compared with patients who are normohydrated and normotensive. In contrast, the HR was not statistically significant for patients with non–volume-dependent hypertension compared with patients who are normohydrated and normotensive (Table 4).
Table 3.
Characteristics of CKD Patients Classified According to the Presence or Absence of Hypertension (SBP <140 or ≥140 mm Hg) and Volume Overload (OH <7% or ≥7%)
| Characteristics | SBP <140, OH <7 (n=105) | SBP ≥140, OH <7 (n=58) | SBP <140, OH ≥7 (n=76) | SBP ≥140, OH ≥7 (n=99) | P Value |
|---|---|---|---|---|---|
| SBP, mm Hg | 125±9 | 149±11 | 126±10 | 155±13 | <0.001 |
| OH, % | 1.2±3.7 | 1.5±4.3 | 13.2±4.3 | 16.1±7.1 | <0.001 |
| Age, y | 63±15 | 69±12 | 68±12 | 66±13 | 0.01 |
| Male sex, n (%) | 75 (71) | 36 (62) | 55 (72) | 66 (67) | 0.53 |
| DM, n (%) | 26 (25) | 19 (33) | 51 (67) | 57 (58) | <0.001 |
| CVD, n (%) | 13 (12) | 10 (17) | 27 (36) | 29 (29) | 0.001 |
| Diuretics, n (%) | 26 (25) | 16 (28) | 30 (40) | 41 (41) | 0.04 |
| RAS blockers, n (%) | 62 (59) | 33 (57) | 44 (58) | 61 (62) | 0.94 |
| Statins, n (%) | 25 (24) | 12 (21) | 24 (32) | 26 (26) | 0.50 |
| baPWV, m/s | 14.6±2.5 | 16.7±3.7 | 15.9±2.6 | 17.0±2.9 | <0.001 |
| BMI, kg/m2 | 25.2±4.1 | 26.4±4.4 | 25.8±4.1 | 26.2±4.4 | 0.26 |
| NT-proBNP, ng/L | 85 (38 to 224) | 142 (68 to 515) | 336 (90 to 1013) | 610 (277 to 1712) | <0.001 |
| Serum sodium, meq/L | 136±4 | 135±4 | 137±4 | 137±4 | 0.008 |
| eGFR, mL/min per 1.73 m2 | 31.1±16.0 | 28.8±15.4 | 26.8±15.2 | 23.4±14.5 | 0.004 |
| UPCR, g/g | 0.4 (0.2 to 1.0) | 0.7 (0.3 to 1.6) | 1.0 (0.4 to 2.6) | 2.6 (1.0 to 4.5) | <0.001 |
| Albumin, g/dL | 3.8±0.3 | 3.7±0.4 | 3.5±0.4 | 3.4±0.4 | <0.001 |
| IL-6, pg/mL | 2.7 (1.5 to 4.2) | 3.0 (1.7 to 4.9) | 4.4 (3.1 to 9.2) | 4.2 (2.6 to 7.1) | <0.001 |
| TNF-α, pg/mL | 5.5 (3.8 to 7.7) | 6.1 (4.3 to 9.0) | 7.9 (5.0 to 10.8) | 8.0 (5.7 to 10.3) | <0.001 |
baPWV indicates brachial-ankle pulse wave velocity; BMI, body mass index; CKD, chronic kidney disease; CVD, cardiovascular disease; DM, diabetes mellitus; eGFR, estimated glomerular filtration rate; IL-6, interleukin-6; NT-proBNP, N-terminal pro-brain natriuretic peptide; OH, overhydration; RAS, renin-angiotensin system; SBP, systolic blood pressure; TNF-α, tumor necrosis factor α; UPCR, urine protein-creatinine ratio.
Figure 1.
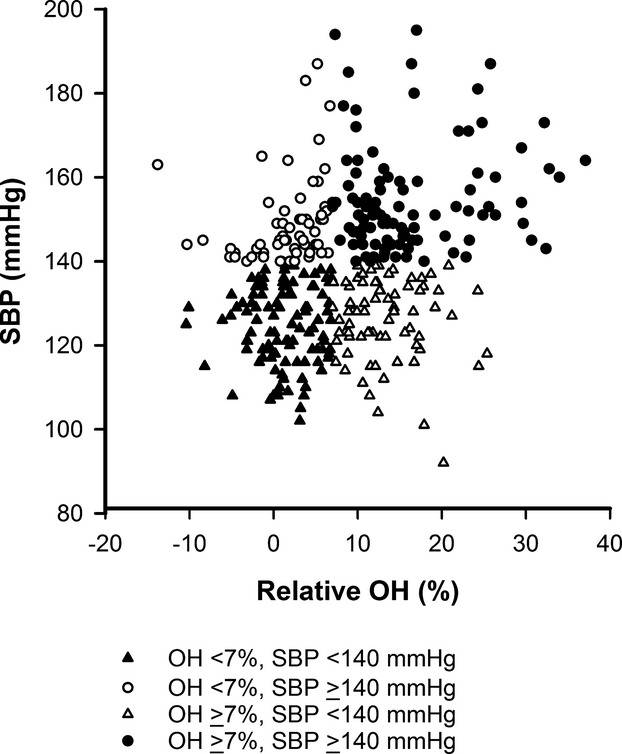
Relationship between relative overhydration (OH) and systolic blood pressure (SBP). The patients were classified into 4 groups according to the baseline SBP (<140 or ≥140 mm Hg) and OH (<7 or ≥7%).
Figure 2.
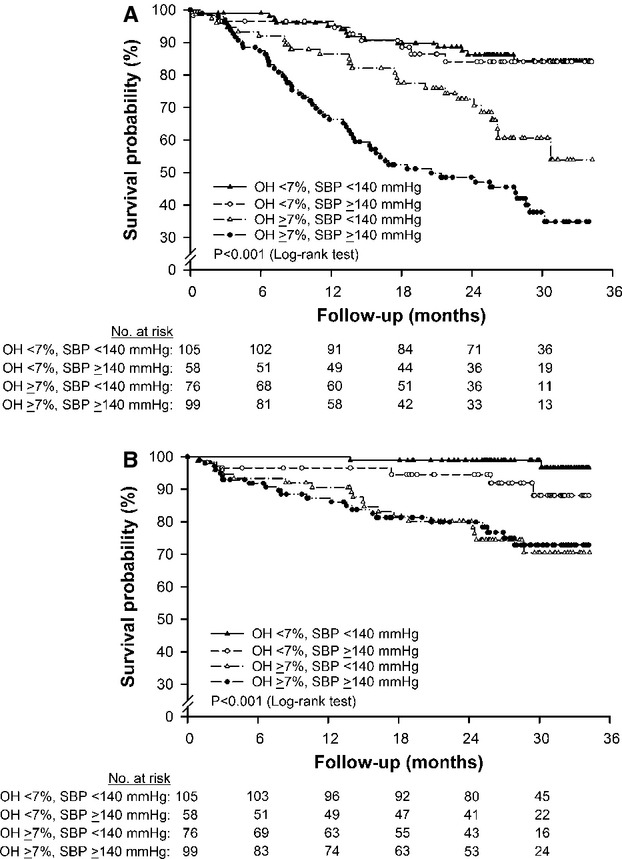
Kaplan–Meier survival curve for renal (A) and cardiovascular (B) outcomes. The patients were classified into 4 groups according to the baseline systolic blood pressure (SBP; <140 or ≥140 mm Hg) and overhydration (OH; <7 or ≥7%). The patients with volume overload demonstrated a substantially increased risk compared with those without volume overload.
Table 4.
HRs for Renal and Cardiovascular Outcomes According to the Presence or Absence of Hypertension (SBP <140 or ≥140 mm Hg) and Volume Overload (OH <7 or ≥7%)
| Unadjusted | Model 1 | Model 2 | Model 3 | |
|---|---|---|---|---|
| HR (95% CI) | HR (95% CI) | HR (95% CI) | HR (95% CI) | |
| Primary outcome: eGFR decline ≥50% or chronic dialysis | ||||
| SBP <140, OH <7 | 1.0 | 1.0 | 1.0 | 1.0 |
| SBP ≥140, OH <7 | 1.10 (0.46 to 2.62) | 1.07 (0.44 to 2.56) | 0.94 (0.36 to 2.48) | 0.92 (0.36 to 2.37) |
| SBP <140, OH ≥7 | 2.94 (1.53 to 5.67)* | 3.09 (1.59 to 5.98)* | 2.52 (1.26 to 5.00)* | 1.94 (0.95 to 3.94) |
| SBP ≥140, OH ≥7 | 5.95 (3.29 to 10.74)† | 6.12 (3.38 to 11.09)† | 4.94 (2.24 to 10.87)† | 2.82 (1.29 to 6.14)* |
| Secondary outcome: cardiovascular morbidity or mortality | ||||
| SBP <140, OH <7 | 1.0 | 1.0 | 1.0 | 1.0 |
| SBP ≥140, OH <7 | 4.82 (0.94 to 24.84) | 4.11 (0.80 to 21.20) | 2.89 (0.50 to 16.59) | 3.23 (0.58 to 18.11) |
| SBP <140, OH ≥7 | 14.98 (3.47 to 64.65)† | 13.63 (3.15 to 58.97)† | 7.30 (1.65 to 32.30)* | 5.81 (1.27 to 26.47)* |
| SBP ≥140, OH ≥7 | 14.44 (3.39 to 61.45)† | 13.48 (3.17 to 57.36)† | 7.38 (1.47 to 37.05)* | 5.20 (1.04 to 26.06)* |
Model 1 is adjusted for age and sex. Model 2 is adjusted for the model 1 variables and for cardiovascular disease, diabetes mellitus, SBP, and the use of angiotensin-converting enzyme inhibitors/angiotensin II receptor blockers. Model 3 is adjusted for the model 2 variables and for eGFR and a urine protein–creatinine ratio cut-off value of 0.5. eGFR indicates estimated glomerular filtration rate; HR, hazard ratio; OH, overhydration; SBP, systolic blood pressure.
P<0.05.
P<0.001.
Animals
Fluid retention, hypertension, and proteinuria
At baseline, there were no significant difference among the 5 groups. At 4 weeks, water intake, urine output, and urine sodium excretion were significantly higher in the rats receiving a high-salt diet (Figure 3A through 3C). Consistent with our expectations, the UNX+HS rats had a significantly higher ratio of ECW/TBW, and SBP and more proteinuria than the control rats (Sham+NS, Sham+HS, and UNX+NS), suggesting that animal models of CKD are particularly salt sensitive. Diuretic treatment with IDP (UNX+HS+IDP) significantly reduced ECW/TBW, SBP, and proteinuria in the UNX+HS rats (Figure 3D through 3F). What was more intriguing is that the changes in proteinuria were not significantly correlated with SBP changes. The results of the animal study at 4 weeks are shown in Table 5.
Figure 3.
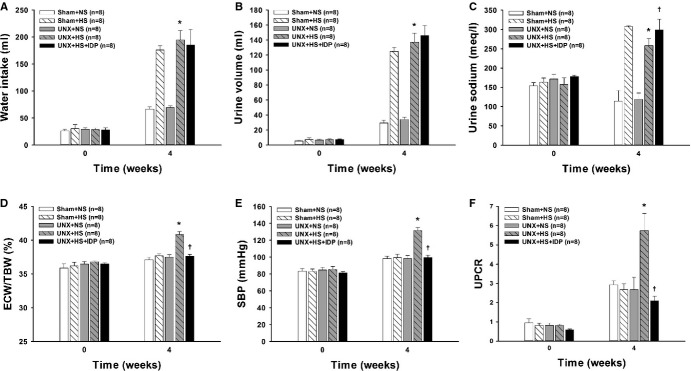
Metabolic caging studies in the rats at baseline and after 4 weeks on normal- or high-salt diets. A, Changes in water intake, (B) urine volume, (C) urine sodium, (D) the ratio of extracellular water to the total body water (ECW/TBW), (E) systolic blood pressure (SBP), and (F) urine protein–creatinine ratio (UPCR). N=8 in each group. ‡P<0.001 vs Sham+NS and UNX+NS; *P<0.001 vs Sham+NS and UNX+NS (A and B). ‡P<0.001 vs Sham+NS, UNX+NS, and UNX+HS; *P<0.001 vs Sham+NS, Sham+HS, and UNX+NS; †P<0.001 vs Sham+NS, UNX+NS, and UNX+HS (C). *P<0.001 vs Sham+NS, Sham+HS, and UNX+NS; †P<0.001 vs UNX+HS (D through F) (2-way ANOVA with Bonferroni’s post-hoc tests). IDP indicates indapamide; Sham+HS, sham-operated rats raised with high salt diet; Sham+NS, sham-operated rats raised with a normal diet; UNX+HS, uninephrectomized rats raised with high salt diet; UNX+NS, uninephrectomized rats raised with a normal diet.
Table 5.
Results of the Animal Study at 4 Weeks
| Sham+NS (n=8) | Sham+HS (n=8) | UNX+NS (n=8) | UNX+HS (n=8) | UNX+HS+IDP (n=8) | |
|---|---|---|---|---|---|
| Water intake, mL/d | 60.7±5.2 | 171.9±24.4 | 65.6±5.6 | 192.6±49.8 | 172.0±29.8 |
| Food intake, g/d | 30.6±3.1 | 31.5±2.7 | 30.3±1.6 | 32.2±4.3 | 31.2±2.3 |
| Body weight, g | 310.9±23.2 | 257.2±11.1 | 288.8±44.6 | 267.5±27.4 | 305.4±22.2 |
| Urine volume, mL/d | 24.4±5.5 | 122.6±15.3 | 30.0±4.7 | 141.7±38.2 | 130.1±21.8 |
| Urine Na, mmol/L | 95±42 | 320±16 | 105±9 | 251±26 | 320±71 |
| ECW, L | 0.067±0.010 | 0.067±0.008 | 0.070±0.010 | 0.065±0.009 | 0.072±0.009 |
| TBW, L | 0.186±0.023 | 0.178±0.022 | 0.188±0.030 | 0.163±0.021 | 0.195±0.022 |
| ECW/TBW, % | 37.4±0.9 | 37.5±0.7 | 37.2±1.0 | 40.3±0.9 | 37.3±1.2 |
| SBP, mm Hg | 101±3 | 102±4 | 98±5 | 134±11 | 102±6 |
| UPCR, g/g | 2.85±0.67 | 2.75±0.91 | 2.97±1.12 | 5.08±1.31 | 1.86±0.47 |
| Serum TNF-α, pg/mL | 6.78±1.08 | 7.40±2.34 | 10.88±2.79 | 17.80±7.04 | 10.46±2.55 |
| Renal TNF-α, pg/μg | 3.02±0.40 | 3.82±0.56 | 3.00±0.32 | 6.01±3.92 | 3.04±0.69 |
ECW indicates extracellular water; SBP, systolic blood pressure; Sham+NS, sham-operated rats raised with normal-salt diet; Sham+HS, sham-operated rats raised with high-salt diet; TBW, total body water; TNF-α, tumor necrosis factor α; UNX+NS, uninephrectomized rats raised with normal-salt diet; UNX+HS, uninephrectomized rats raised with high salt diet; UNX+HS+IDP, indapamide-treated UNX+HS rats; UPCR, urine protein–creatinine ratio.
Systemic and renal inflammation
At 4 weeks, the serum and renal levels of TNF-α were higher in the UNX+HS rats than in the control rats (Sham+NS, Sham+HS, and UNX+NS). Diuretic treatment with IDP blunted the increase of the inflammatory mediator (Figure 4A and 4B). The UNX+HS rats also had a marked increase in renal macrophage infiltrations compared with the control rats (Sham+NS, Sham+HS, and UNX+NS). This increase was prevented with IDP (Figure 5A and 5B).
Figure 4.
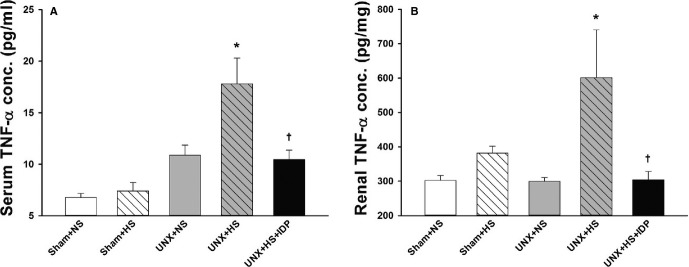
Systemic and renal inflammation in the rats after 4 weeks on normal- or high-salt diets. A, Tumor necrosis factor-α (TNF-α) level in the serum. N=8 in each group. *P<0.01 vs Sham+NS, Sham+HS, and UNX+NS; †P<0.01 vs UNX+HS. B, TNF-α level in the kidney homogenate. N=8 in each group. *P<0.05 vs Sham+NS and UNX+NS; †P<0.05 vs UNX+HS (1-way ANOVA with Tukey’s post-hoc tests). ANOVA indicates analysis of variance; IDP, indapamide; Sham+HS, sham-operated rats raised with high salt diet; Sham+NS, sham-operated rats raised with a normal diet; UNX+HS, uninephrectomized rats raised with high salt diet; UNX+NS, uninephrectomized rats raised with a normal diet.
Figure 5.

Renal and cardiac histology in the rats after 4 weeks on normal- or high-salt diets. A, Representative microphotographs of immunohistochemistry for ED1 in the renal cortex. B, Quantitative ED1-positive macrophage infiltration (number of positive cells per high power field). Significantly greater macrophage infiltrations were elicited in the UNX+HS rats. C, Representative microphotographs of PAS staining in the renal cortex. D, Quantitative analysis of collagen deposition (% stained area in the glomeruli). Significantly greater glomerular damage was elicited in the UNX+HS rats. E, Representative microphotographs of Masson staining in the heart. F, Quantitative analysis of collagen deposition (% stained area in the cardiac tissue). Significantly greater cardiac interstitial fibrosis was elicited in the UNX+HS rats. *P<0.05 vs Sham+NS, Sham+HS, and UNX+NS; †P<0.05 vs UNX+HS (1-way ANOVA with Tukey’s post-hoc tests). Magnification ×400. ANOVA indicates analysis of variance; IDP, indapamide; PAS, periodic acid-Schiff; Sham+HS, sham-operated rats raised with high salt diet; Sham+NS, sham-operated rats raised with a normal diet; UNX+HS, uninephrectomized rats raised with high salt diet; UNX+NS, uninephrectomized rats raised with a normal diet.
Renal glomerular sclerosis and cardiac interstitial fibrosis
Glomerular sclerosis was increased in the UNX+HS rats compared with the control rats (Sham+NS, Sham+HS, and UNX+NS) at 4 weeks and was reduced by diuretic treatment with IDP (Figure 5C and 5D). Cardiac interstitial fibrosis was also increased in the UNX+HS rats compared with the control rats (Sham+NS, Sham+HS, and UNX+NS) at 4 weeks and was improved with IDP (Figure 5E and 5F).
Discussion
In our prospective cohort of patients with stage 3 to 5 CKD, we determined that volume overload was independently correlated with renal and cardiovascular outcomes. In addition, the patients with volume-dependent hypertension had a substantially higher risk of adverse outcomes than did the patients with non–volume-dependent hypertension. Fluid retention appears to be more important than hypertension and has a higher predictive value of an elevated risk. We also demonstrated that a reduction in renal mass by unilateral nephrectomy and a high-salt intake in rats caused increased ECW volume, hypertension, and renal and cardiac injury, including proteinuria, glomerular sclerosis together with renal macrophage infiltrations, and cardiac interstitial fibrosis. Diuretic treatment with IDP decreased fluid retention and BP, which, in turn, led to a decrease in renal and cardiac injury. The results of our study suggest that natriuresis could play an important role in the prevention of CKD and CVD and highlight the need for an optimal strategy for volume management in CKD patients in clinical practice.
Patients with CKD frequently are salt sensitive. The potential consequences of high dietary salt intake, including fluid retention and higher BP, are more common in the context of CKD. When subjected to volume overload, the left ventricular chamber dilates and remodels in an eccentric manner. In contrast, concentric remodeling is considered an early stage of cardiac adaptation to increased workload.13 Left ventricular hypertrophy is an important risk factor for adverse cardiovascular outcomes in patients with CKD.14,15 Eccentric left ventricular hypertrophy is associated with a poorer prognosis than concentric hypertrophy,16 indicating that volume overload might be of particular relevance in the pathogenesis of CVD in these patients. Furthermore, elevated right and left ventricular end-diastolic pressure due to fluid retention ultimately lead to increased renal venous pressure.17 Hemodynamically, an increase in the renal venous pressure results in decreased renal perfusion, which initiates a vicious circle by causing sodium retention, the expansion of plasma volume, and a further worsening of renal function.18
Until recently, it was thought that the effect of salt on renal and cardiovascular outcomes is driven primarily through changes in BP. However, the results of our study showed that CKD patients with volume overload had an increased risk of adverse renal or cardiovascular outcomes independently of the presence or absence of hypertension. The risk was not significantly different between hypertensives and nonhypertensives without volume overload. In addition, our study determined that in CKD rats receiving a high-salt diet, proteinuria was substantially increased. However, the changes in proteinuria were independent of SBP changes, suggesting that the harmful renal effects of dietary sodium might beyond the effects of elevated systemic BP. Vogt et al also determined that changes in proteinuria with sodium restriction were independent of the BP-lowering effect, suggesting that the relationship between sodium intake and proteinuria might have been driven in part by changes in the glomerular structure or function.19
Vegter et al conducted a post hoc analysis of the first and second Ramipril Efficacy in Nephropathy trials to evaluate the association of sodium intake with proteinuria and progression to ESRD among 500 CKD patients without diabetes receiving ramipril therapy.20 In their study, they showed that high dietary salt appears to blunt the antiproteinuric effect of the ACE inhibitor and to increase the risk of ESRD but is independent of BP control. In a recent study enrolling a prospective cohort of 328 CKD patients on maintenance hemodialysis, we demonstrated that the inverse association of aldosterone with CVD events is due to the confounding effect of volume overload.21 Our findings are in agreement with previous evidence and suggest that treatment with renin-angiotensin system blockers might lead to improved CVD outcomes only in those CKD patients who have achieved strict volume control. In the first double-blind randomized controlled trial assessing the effect of salt restriction on BP and proteinuria in hypertensive patients with CKD stage 3 or 4, McMahon et al determined that sodium restriction reduced extracellular volume, BP, and proteinuria without significant adverse effects over a short 2-week intervention.22 These findings suggest that patients with CKD might be particularly susceptible to the detrimental effects of salt-induced fluid retention and provide evidence to support salt restriction and volume control in CKD.
The detrimental effects of excess salt intake might occur via fluid retention, hypertension, and nonvolume, nonpressure pathways. Recent research indicates that other mediators, such as endothelial activation and proinflammatory cytokines, might play a more pronounced role than previously thought. Despite interaction, salt toxicity could act independently through different pathophysiological mechanisms on the target organ. Circumferential stretch of venous endothelial cells from venous congestion induces proinflammatory endothelial activation.23 In the present study, patients or animals with volume overload had significantly higher proinflammatory cytokines such as IL-6 or TNF-α compared with the patients or animals without volume overload. Accumulating evidence has shown that inflammation affcts myocardial and renal function and contributes to both the development of CVD and the progression of CKD.
Excess sodium might have direct toxic effects on blood vessels through mediating factors such as oxidative stress, inflammation, and endothelial cell dysfunction.24 Dietary salt, by facilitating the glomerular and cardiac expression of transforming growth factor β, might directly promote the development of glomerulosclerosis and cardiac interstitial fibrosis.25 Additionally, 2 recent studies demonstrated that increased sodium concentrations dramatically boost the induction of murine and human Th17 cells in vitro.26 High salt conditions activate the p38/MAPK pathway that involves the serum glucocorticoid kinase 1 during cytokine-induced Th17 polarization. Pathogenic Th17 cells are highly proinflammatory cells that have been shown to mediate human and experimental renal diseases.27 Th17 effector cells directly induce renal inflammation by activating neutrophils or by participating in macrophage-mediated tissue injury. Therefore, increased dietary salt intake might represent an environmental risk factor for the development of CKD through the induction of pathogenic Th17 cells.
Study Limitations
A strength of this study is its combined use of a prospective cohort study and animal study. However, certain limitations of the study should be acknowledged. As is the case for any observational study, we were unable to establish the causality of the relationship between volume overload and outcomes. Although the results of the animal study supported the hypothesis that salt-induced volume overload could result in renal and cardiovascular damage, it was difficult to untangle the complex relationship between salt and volume. It is unclear whether the relationship involved salt toxicity or adverse effects from fluid retention. Another limitation was the lack of data regarding the dietary salt and fluid intake in CKD patients. As shown in Table 1, 113 (33.4%) of study participants were receiving diuretic treatment. Twenty-four-hour urinary sodium excretion is a good proxy for salt intake in the steady state, but it can be falsely elevated in patients taking a diuretic. Furthermore, patients on diuretic therapy might have different levels of hydration status during the course of the day, and there is a room for misinterpretation of hydration status in such patients. Finally, the overall CVD event rate was low in the present study, as reflected by a relatively wide CI in the secondary end point. Although CKD patients in Western countries frequently die of CVD before developing ESRD, CKD patients in Taiwan are more likely to develop ESRD than to have a cardiovascular event.28 The limited number of CVD events also limits the ability to adjust for other potentially important covariates of interest.
Conclusions
Volume overload exhibits a strong association with CKD progression and CVD morbidity or mortality in patients with stage 3 to 5 CKD. In animal models of CKD, salt-induced fluid retention results in renal and cardiovascular damage, which is ameliorated by diuretics. Therefore, our findings suggest that volume overload is an important mechanism contributing to the adverse outcomes observed in CKD and requires appropriate management. Further research is warranted to clarify whether the correction of volume overload should be one of the main targets to achieve better outcomes in patients with CKD.
Sources of Funding
This work was supported in part by grants from the National Science Council (NSC 99-2314-B-010-004-MY3; NSC 102-2314-B-010-004-MY3; NSC 102-2314-B-303-003; MOST 103-2314-B-303-005-MY2), Taipei Tzu Chi Hospital (TCRD-TPE-NSC-102-08; TCRD-TPE-103-RT-4), Taipei Veterans General Hospital (V102C-143; V103C-001), and Ministry of Education, Aim for the Top University Plan in Taiwan.
Disclosures
None.
References
- Levey AS, Atkins R, Coresh J, Cohen EP, Collins AJ, Eckardt KU, Nahas ME, Jaber BL, Jadoul M, Levin A, Powe NR, Rossert J, Wheeler DC, Lameire N, Eknoyan G. Chronic kidney disease as a global public health problem: approaches and initiatives—a position statement from Kidney Disease Improving Global Outcomes. Kidney Int. 2007;72:247–259. doi: 10.1038/sj.ki.5002343. [DOI] [PubMed] [Google Scholar]
- Wen CP, Cheng TY, Tsai MK, Chang YC, Chan HT, Tsai SP, Chiang PH, Hsu CC, Sung PK, Hsu YH, Wen SF. All-cause mortality attributable to chronic kidney disease: a prospective cohort study based on 462293 adults in Taiwan. Lancet. 2008;371:2173–2182. doi: 10.1016/S0140-6736(08)60952-6. [DOI] [PubMed] [Google Scholar]
- Hsu TW, Liu JS, Hung SC, Kuo KL, Chang YK, Chen YC, Hsu CC, Tarng DC. Renoprotective effect of renin-angiotensin system blockade among advanced chronic kidney disease non-dialyzed patients with hypertension and anemia. JAMA Intern Med. 2014;174:347–354. doi: 10.1001/jamainternmed.2013.12700. [DOI] [PubMed] [Google Scholar]
- Chen YR, Yang Y, Wang SC, Chiu PF, Chou WY, Lin CY, Chang JM, Chen TW, Ferng SH, Lin CL. Effectiveness of multidisciplinary care for chronic kidney disease in Taiwan: a 3-year prospective cohort study. Nephrol Dial Transplant. 2013;28:671–682. doi: 10.1093/ndt/gfs469. [DOI] [PubMed] [Google Scholar]
- Hung SC, Kuo KL, Peng CH, Wu CH, Wang YC, Tarng DC. Association of fluid retention with anemia and clinical outcomes among patients with chronic kidney disease. J Am Heart Assoc. 2015;4:e001480. doi: 10.1161/JAHA.114.001480. doi: 10.1161/JAHA.114.001480. [DOI] [PMC free article] [PubMed] [Google Scholar]
- Hung SC, Kuo KL, Peng CH, Wu CH, Lien YC, Wang YC, Tarng DC. Volume overload correlates with cardiovascular risk factors in patients with chronic kidney disease. Kidney Int. 2014;85:703–709. doi: 10.1038/ki.2013.336. [DOI] [PubMed] [Google Scholar]
- Kalantar-Zadeh K, Regidor DL, Kovesdy CP, Van Wyck D, Bunnapradist S, Horwich TB, Fonarow GC. Fluid retention is associated with cardiovascular mortality in patients undergoing long-term hemodialysis. Circulation. 2009;119:671–679. doi: 10.1161/CIRCULATIONAHA.108.807362. [DOI] [PMC free article] [PubMed] [Google Scholar]
- Bouchard J, Soroko SB, Chertow GM, Himmelfarb J, Ikizler TA, Paganini EP, Mehta RL. Fluid accumulation, survival, and recovery of kidney function in critically ill patients with acute kidney injury. Kidney Int. 2009;76:422–427. doi: 10.1038/ki.2009.159. [DOI] [PubMed] [Google Scholar]
- Tsai YC, Tsai JC, Chen SC, Chiu YW, Hwang SJ, Hung CC, Chen TH, Kuo MC, Chen HC. Association of fluid overload with kidney disease progression in advanced CKD: a prospective cohort study. Am J Kidney Dis. 2014;63:68–75. doi: 10.1053/j.ajkd.2013.06.011. [DOI] [PubMed] [Google Scholar]
- Chamney PW, Wabel P, Moissl UM, Müller MJ, Bosy-Westphal A, Korth O, Fuller NJ. A whole-body model to distinguish excess fluid from the hydration of major body tissues. Am J Clin Nutr. 2007;85:80–89. doi: 10.1093/ajcn/85.1.80. [DOI] [PubMed] [Google Scholar]
- Wieskotten S, Heinke S, Wabel P, Moissl U, Becker J, Pirlich M, Keymling M, Isermann R. Bioimpedance-based identification of malnutrition using fuzzy logic. Physiol Meas. 2008;29:639–654. doi: 10.1088/0967-3334/29/5/009. [DOI] [PubMed] [Google Scholar]
- Laupacis A, Sekar N, Stiell IG. Clinical prediction rules. A review and suggested modifications of methodological standards. JAMA. 1997;277:488–494. [PubMed] [Google Scholar]
- Selvetella G, Lembo G. Mechanisms of cardiac hypertrophy. Heart Fail Clin. 2005;1:263–273. doi: 10.1016/j.hfc.2005.03.006. [DOI] [PubMed] [Google Scholar]
- Schiffrin EL, Lipman ML, Mann JF. Chronic kidney disease: effects on the cardiovascular system. Circulation. 2007;116:85–97. doi: 10.1161/CIRCULATIONAHA.106.678342. [DOI] [PubMed] [Google Scholar]
- Essig M, Escoubet B, de Zuttere D, Blanchet F, Arnoult F, Dupuis E, Michel C, Mignon F, Mentre F, Clerici C, Vrtovsnik F. Cardiovascular remodelling and extracellular fluid excess in early stages of chronic kidney disease. Nephrol Dial Transplant. 2008;23:239–248. doi: 10.1093/ndt/gfm542. [DOI] [PubMed] [Google Scholar]
- Levin A, Singer J, Thompson CR, Ross H, Lewis M. Prevalent left ventricular hypertrophy in the predialysis population: identifying opportunities for intervention. Am J Kidney Dis. 1996;27:347–354. doi: 10.1016/s0272-6386(96)90357-1. [DOI] [PubMed] [Google Scholar]
- Sarraf M, Masoumi A, Schrier RW. Cardiorenal syndrome in acute decompensated heart failure. Clin J Am Soc Nephrol. 2009;4:2013–2026. doi: 10.2215/CJN.03150509. [DOI] [PubMed] [Google Scholar]
- Firth JD, Raine AE, Ledingham JG. Raised venous pressure: a direct cause of renal sodium retention in oedema? Lancet. 1998;1:1033–1035. doi: 10.1016/s0140-6736(88)91851-x. [DOI] [PubMed] [Google Scholar]
- Vogt L, Waanders F, Boomsma F, de Zeeuw D, Navis G. Effects of dietary sodium and hydrochlorothiazide on the antiproteinuric efficacy of losartan. J Am Soc Nephrol. 2008;19:999–1007. doi: 10.1681/ASN.2007060693. [DOI] [PMC free article] [PubMed] [Google Scholar]
- Vegter S, Perna A, Postma MJ, Navis G, Remuzzi G, Ruggenenti P. Sodium intake, ACE inhibition, and progression to ESRD. J Am Soc Nephrol. 2012;23:165–173. doi: 10.1681/ASN.2011040430. [DOI] [PMC free article] [PubMed] [Google Scholar]
- Hung SC, Lin YP, Huang HL, Pu HF, Tarng DC. Aldosterone and mortality in hemodialysis patients: role of volume overload. PLoS One. 2013;8:e57511. doi: 10.1371/journal.pone.0057511. [DOI] [PMC free article] [PubMed] [Google Scholar]
- McMahon EJ, Bauer JD, Hawley CM, Isbel NM, Stowasser M, Johnson DW, Campbell KL. A randomized trial of dietary sodium restriction in CKD. J Am Soc Nephrol. 2013;24:2096–2103. doi: 10.1681/ASN.2013030285. [DOI] [PMC free article] [PubMed] [Google Scholar]
- Gnanaraj JF, von Haehling S, Anker SD, Raj DS, Radhakrishnan J. The relevance of congestion in the cardio-renal syndrome. Kidney Int. 2013;83:384–391. doi: 10.1038/ki.2012.406. [DOI] [PubMed] [Google Scholar]
- Al-Solaiman Y, Jesri A, Zhao Y, Morrow JD, Egan BM. Low-sodium DASH reduces oxidative stress and improves vascular function in salt-sensitive humans. J Hum Hypertens. 2009;23:826–835. doi: 10.1038/jhh.2009.32. [DOI] [PMC free article] [PubMed] [Google Scholar]
- Ying WZ, Sanders PW. Dietary salt modulates renal production of transforming growth factor-β in rats. Am J Physiol Renal Physiol. 1998;274:F635–F641. doi: 10.1152/ajprenal.1998.274.4.F635. [DOI] [PubMed] [Google Scholar]
- Wu C, Yosef N, Thalhamer T, Zhu C, Xiao S, Kishi Y, Regev A, Kuchroo VK. Induction of pathogenic TH17 cells by inducible salt-sensing kinase SGK1. Nature. 2013;496:513–517. doi: 10.1038/nature11984. [DOI] [PMC free article] [PubMed] [Google Scholar]
- Kitching AR, Holdsworth SR. The emergence of TH17 cells as effectors of renal injury. J Am Soc Nephrol. 2011;22:235–238. doi: 10.1681/ASN.2010050536. [DOI] [PubMed] [Google Scholar]
- Chiu YL, Chien KL, Lin SL, Chen YM, Tsai TJ, Wu KD. Outcomes of stage 3–5 chronic kidney disease before end-stage renal disease at a single center in Taiwan. Nephron Clin Pract. 2008;109:c109–c118. doi: 10.1159/000145453. [DOI] [PubMed] [Google Scholar]