

Abstract
Background
Calcium is a shortfall essential nutrient that has been a mainstay of osteoporosis management. Recent and limited findings have prompted concern about the contribution of calcium supplementation to cardiovascular risk. A proposed mechanism is through the acceleration of coronary artery calcification. Determining causality between calcium intake and coronary artery calcification has been hindered by a lack of sensitive methodology to monitor early vascular calcium accumulation. The primary study aim was to assess the impact of high calcium intake on coronary artery calcification using innovative calcium tracer kinetic modeling in Ossabaw swine with diet-induced metabolic syndrome. Secondary end points (in vitro wire myography, histopathology, intravascular ultrasound) assessed coronary disease.
Methods and Results
Pigs (n =24; aged ≈15 months) were fed an atherogenic diet with adequate calcium (0.33% by weight) or high calcium (1.90% from calcium carbonate or dairy) for 6 months. Following 5 months of feeding, all pigs were dosed intravenously with 41Ca, a rare isotope that can be measured in serum and tissues at a sensitivity of 10−18 mol/L by accelerator mass spectrometry. Kinetic modeling evaluated early coronary artery calcification using 41Ca values measured in serial blood samples (collected over 27 days) and coronary artery samples obtained at sacrifice. Serum disappearance of 41Ca and total coronary artery 41Ca accumulation did not differ among groups. Secondary end points demonstrated no treatment differences in coronary artery disease or function.
Conclusion
There was no detectable effect of high calcium diets (from dairy or calcium carbonate) on coronary artery calcium deposition in metabolic syndrome swine.
Keywords: calcium, coronary disease, diet, isotopes, nutrition
In recent years, the potential contribution of dietary and supplemental calcium to elevating cardiovascular risk has been widely debated.1,2 Adequate intakes of calcium, along with vitamin D, have been encouraged due to the important physiological and structural roles of these nutrients, particularly in reducing bone fracture risk. Moreover, supplemental calcium has been advocated3 because the amount of calcium obtained from foods consistently falls short of current dietary recommendations.4 Although traditionally regarded as safe, recent findings have led to concerns regarding a putative association between calcium supplementation and myocardial infarction and cardiovascular-related mortality,5–8 prompted by a randomized controlled trial that demonstrated elevated cardiovascular event risk with calcium supplementation versus placebo among postmenopausal women.9 Evidence from observational studies and exploratory analysis of a randomized controlled trial, however, has failed to demonstrate associations between calcium intake and coronary artery calcium scores in adults.10–12 Furthermore, a recent meta-analysis did not demonstrate an increased risk for heart disease or all-cause mortality risk in elderly women taking calcium supplementation with or without vitamin D versus those assigned to placebo.13 Currently, the available literature is sparse and inconclusive. Because both cardiovascular disease and osteoporosis contribute significantly to mortality and morbidity,14,15 further assessment of the casual relationship between calcium intake and cardiovascular risk is of importance.
A suggested mechanism by which supplemental calcium may elevate cardiovascular risk is through the acceleration of vascular calcification induced by acute elevations in circulating calcium.16 Vascular calcification is a clinical indicator of atherosclerosis and may predict cardiovascular-related mortality.17 The investigation of a causal role of dietary or supplemental calcium in cardiovascular-related outcomes has been hampered by a lack of sensitive experimental methodology for assessing early vascular calcification and by the extensive intervention period necessary to monitor coronary artery disease (CAD) progression in human populations.
In the present study, we used a relevant animal model for the study of CAD and both innovative and traditional methods for detecting soft tissue calcium, cardiovascular function, and CAD burden. The Ossabaw miniature swine model has translational relevance to humans because it demonstrates the full spectrum of human disease progression from metabolic syndrome to CAD with calcified atherosclerotic plaques when fed an atherogenic diet.18,19 Furthermore, their size makes the Ossabaw pig an ideal model for using imaging techniques and kinetic studies that necessitate ample blood and tissue sampling. Our group has demonstrated previously that the Ossabaw pig is an adequate model for assessing coronary artery calcification (CAC) through the use of novel calcium tracer kinetic modeling.20 The isotope 41Ca is a long-lived (t1/2 >105 years) calcium tracer that can be measured in low concentrations (10−18 mol/L) by accelerator mass spectrometry. Previously, our group has used 41Ca tracer kinetics to monitor bone turnover and bone calcium retention.21 We recently verified that compartmental kinetic modeling of 41Ca can be used to assess early CAD-associated calcium deposition in the coronary arteries.20
The primary aim of this study was to investigate the impact of high calcium intake from a supplemental source (calcium carbonate [CaCO3]) or dairy on coronary artery calcium deposition in the Ossabaw miniature swine fed an atherogenic diet, using novel 41Ca tracer kinetics to characterize early CAC. Secondary objectives included the investigation of the effect of high calcium intake on cardiovascular function and CAD progression, using more traditional techniques including in vitro wire myography, histopathology, and intravascular ultrasound.
Materials and Methods
Animals and Diets
This protocol was approved by the animal care and use committees of Purdue University and the Indiana University School of Medicine. Female Ossabaw miniature swine (n =24) aged 14 to 16 months (sexually mature) were randomized to 1 of 3 dietary calcium conditions (n =8 per group) including a control condition (adequate calcium; 0.33% Ca by weight) and elevated calcium conditions from CaCO3 (1.90% Ca) or from dairy (1.90% Ca). The compositions of the experimental diets are listed in Table1. The calcium composition of the dairy diet was achieved through the addition of 7.50% nonfat dry milk and 6.85% TruCal D50 (Glanbia Nutritionals), a milk mineral complex. The TruCal D50 is a dairy ingredient that is derived from milk and that provides milk minerals in a profile similar to that of milk (per 100 g: 24 800 mg Ca, 620 mg sodium, 700 mg potassium, 1400 mg magnesium, 12 500 mg phosphorous) without providing additional lactose that has the potential to cause gastrointestinal side effects in the pigs when fed in large quantities. The 2 high-calcium diets (CaCO3 and dairy) were designed with the intention of reflecting human calcium intakes at the tolerable upper limit recommended by the Institute of Medicine (≈2000 to 2500 mg/day). All diets were supplemented with phosphorous to prevent deficiency due to calcium binding, with the dairy diet containing the most phosphorous (1.85% by weight versus 0.90%) to reflect the mineral composition of a human diet that incorporates high amounts of dairy. All pigs were placed on a high-fat, high-cholesterol atherogenic diet to induce early development of CAD. The atherogenic diet consisted of standard chow supplemented with cholesterol (2.0% wt/wt), hydrogenated coconut oil (4.70%), hydrogenated soybean oil (8.40%), cholate (0.70%), and high-fructose corn syrup (5.0%). Pigs were meal fed 1500 g of their assigned diet daily for 1.5 hours to encourage gorging behavior. If applicable, leftover food was weighed and recorded to calculate true total food and calcium intakes.
Table 1.
Composition of Experimental Diets
| Control | Dairy | CaCO3 | |
|---|---|---|---|
| 0.33% Ca | 1.90% Ca | 1.90% Ca | |
| 0.90% P | 1.85% P | 0.90% P | |
| Chow diet | 53.98 | 53.98 | 53.98 |
| Hydrogenated soybean oil | 8.40 | 8.40 | 8.40 |
| Cholesterol | 2.00 | 2.00 | 2.00 |
| Cholate | 0.70 | 0.70 | 0.70 |
| High-fructose corn syrup | 5.00 | 5.00 | 5.00 |
| Hydrogenated coconut oil | 4.70 | 4.70 | 4.70 |
| Nonfat dry milk | — | 7.50 | — |
| Milk mineral complex* | — | 6.85 | — |
| Monosodium phosphate | 2.28 | 2.28 | 2.28 |
| Calcium carbonate | 0.55 | — | 4.49 |
| Soy hulls | 17.66 | 6.77 | 14.55 |
| Soy protein concentrate† | 3.90 | 1.49 | 3.21 |
| Fructose† | 0.84 | 0.32 | 0.69 |
Data presented as percentage of diet (wt/wt). Macronutrient composition of the 3 diets is as follows: 40% kilocalories from fat, 23% kilocalories from protein, and 37% kilocalories from carbohydrate.
P indicate phosphorous.
The milk mineral complex used was TruCal D50.
Soy protein concentrate and fructose were added to balance the energy and protein contents of the diet.
The pigs were housed and fed in individual pens with a 12-hour light–dark cycle. Water was provided ad libitum. One pig died early in the intervention period due to apparent kidney disease, and 1 pig died during catheter insertion surgery, accounting for the final sample size of 22 for some of the study end points.
Body weights were measured weekly. Pigs were acclimated to restraint in a specialized sling22 regularly throughout the intervention period. Conscious systolic and diastolic blood pressures were measured weekly using a noninvasive blood pressure cuff on the left forelimb while the pig was elevated and resting in the restraint sling.
Intravenous Catheter Insertion and Blood Collection
After 5 months of dietary intervention, all pigs underwent placement of a central venous line catheter into the left or right jugular vein. Anesthesia was maintained by mask with 3% to 5% isoflurane in 100% oxygen as a carrier gas. Body temperature, heart rate, blood pressure, and respiratory rate were continuously monitored throughout the procedure.
Following a 24-hour recovery period, baseline venous blood samples (10 mL) were obtained by jugular catheter after an overnight fast. An iStat Clinical analyzer (Abbott Point of Care Inc) was used to immediately analyze ionized calcium, glucose, and creatinine on fresh whole blood. Subsequently, all pigs received an intravenous infusion of 50 nCi 41Ca as 41CaCl2 in 3 mL of sterile saline over 2 minutes by jugular catheter, and blood (10 mL) was drawn through the same catheter at 5, 15, and 30 minutes; at 1, 1.5, 2, 2.5, 3, 4, 5, 7, 10, 12, and 24 hours; and then at 2, 3, 5, 7, 9, 11, 16, 18, 23, and 27 days following the intravenous delivery of the 41Ca dose. Blood specimens were centrifuged, and the serum fraction was separated and stored at −40°C for future analysis.
Pharmacokinetics
To assess serum calcium response to a test meal, half-rations of the typical daily portions of test diet (750 g) were given concurrently with the 41Ca dose to ensure that all pigs could complete the serving within 60 minutes. Serum total calcium was measured in the samples drawn over the first 12 hours (as listed earlier) using a COBAS Integra 400 analyzer (Roche Diagnostics). Baseline-adjusted calcium concentration versus time curves were constructed, and area under the concentration–time curve (AUC0–t) was estimated using SAS 9.2 (SAS Institute). The peak change in serum calcium over the 12-hour span was defined as the Cmax (mmol/L), and the time to reach the Cmax was defined as the Tmax (minutes).
Serum Assays
Fasted serum samples were analyzed for calcium, phosphorous, triglyceride, total cholesterol, and high-density lipoprotein cholesterol (HDL-C) concentrations using a COBAS Integra 400 analyzer. Low-density lipoprotein cholesterol (LDL-C) content was calculated with the Friedewald equation.23
Serum C-reactive protein, a marker of chronic inflammation that may predict atherosclerosis risk,24 was assessed using a porcine C-reactive protein enzyme-linked immunoassay (Alpco Diagnostics).
In Vivo Analysis
Anesthesia
A central venous line was used to administer anesthesia solution for in vivo imaging and sacrifice. Pigs were anesthetized with 10 mL of telazol solution (tiletamine and zolazepam; 10 mg/mL) and xylazine (10 mg/mL), which was given in a slow intravenous push through the venous catheter. The pigs were placed on inhalational anesthesia by mask and given 5% isoflurane carried on 100% oxygen for 5 minutes. This was interrupted briefly as the animals were intubated to ensure that a proper airway was maintained. Inhalational anesthesia was continued using isoflurane ranging from 0.5% to 3.5% with 100% oxygen as carrier gas. Pigs were continuously monitored for blood oxygen saturation, electrocardiogram, heart rate, blood pressure, capillary refill time, mucosal membrane color, and respiratory rate.
Dual-phase Electrocardiogram-grated Dynamic Contrast-enhanced Computed Tomography
Dynamic contrast-enhanced computed tomography (CT) provided high-resolution temporal and spatial CT images suitable for quantification of cardiac function (Figure1). Left ventricular volumes were segmented across the cardiac cycle, and end-diastolic and -systolic phases were used to estimate ventricular stroke volume and ejection fractions. Calcified lesions were evaluated, as described previously, in published work, and CAC scores were assigned by trained personnel using a previously published scoring system based on number and area of calcified lesions detected.25
Figure 1.
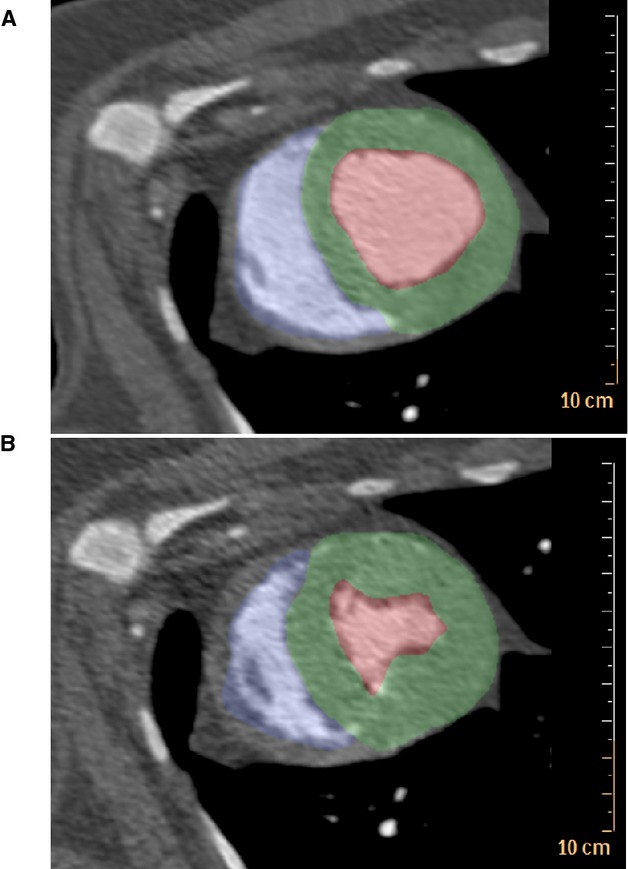
ECG-gated dynamic contrast-enhanced computed tomography allowed for quantification of end-diastolic volume and end-systolic volume to assess cardiac function in Ossabaw swine with metabolic syndrome. A, Diastole. B, Systole. Blue indicates the right ventricular cavity. Green indicates the left ventricle; Red indicates the left ventricular cavity.
Intravascular Ultrasound
After induction of anesthesia, intravascular ultrasound was performed in the left anterior descending (LAD) coronary artery, as described previously.18 Intravascular ultrasound images were analyzed using ImageJ software (National Institutes of Health) for every 1 mm in the proximal 15 mm of the LAD coronary artery to pair with the arterial segment used for in vitro wire myography studies described below. An initial area was obtained by tracing the tunica media–tunica intima boundary; this represented an “initial” lumen. A secondary measurement was obtained by tracing the actual lumen (Figure2). Plaque burden was determined by calculating (IL−AL)/IL×100, in which IL is the initial lumen and AL is the actual lumen.
Figure 2.
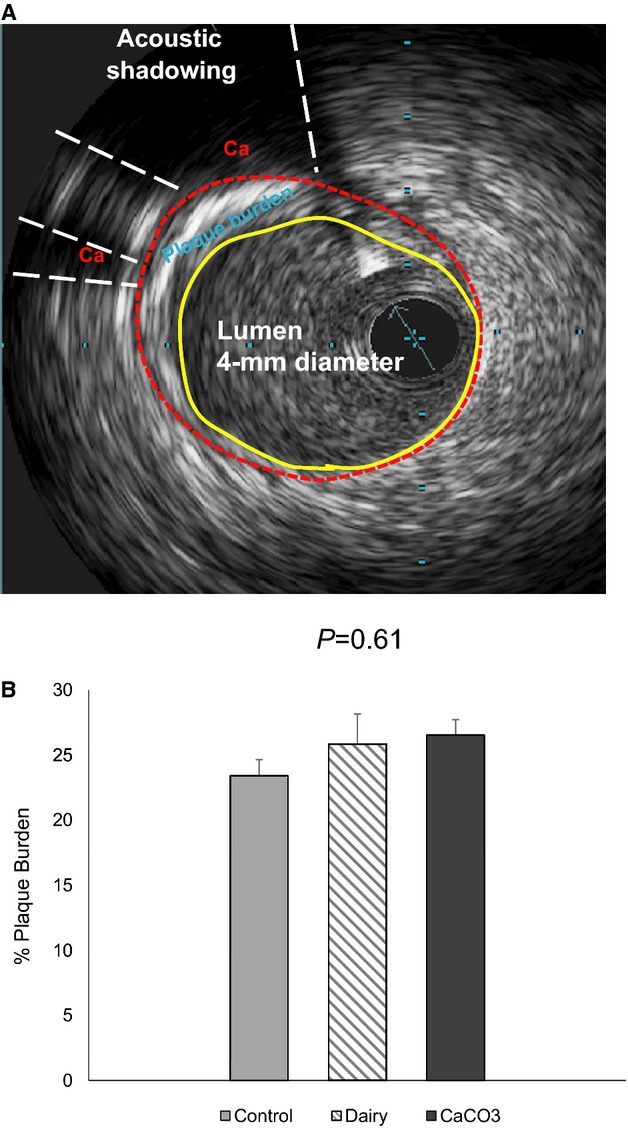
Intravascular ultrasound to assess plaque burden in Ossabaw swine LAD coronary artery. A, An intravascular ultrasound image showing stenotic plaque and calcified plaque (Ca, acoustic shadowing) in the LAD coronary artery. B, Percentage of plaque burden analysis of the proximal 1.5-cm LAD region. Data are means±SEM. LAD indicates left anterior descending.
Sacrifice and Tissue Collection
Under anesthesia, hearts were removed, weighed, and perfused with ice-cold Krebs bicarbonate buffer containing 131.5 mmol/L NaCl, 5.0 mmol/L KCl, 1.2 mmol/L NaH2PO4, 1.2 mmol/L MgCl2, 2.5 mmol/L CaCl2, 11.2 mmol/L glucose, 20.8 mmol/L NaHCO3, 0.003 mmol/L propranolol, and 0.025 mmol/L EDTA. Proximal portions of LAD coronary artery ≈15 mm in length were excised from anatomically identical regions of each pig heart. The LAD segments were placed in ice-cold Krebs bicarbonate buffer solution for immediate analysis of vasoactive responses using in vitro wire myography. Additional segments of the coronary arteries, including the mid-distal LAD coronary artery, midproximal right coronary artery, and circumflex coronary artery, were biopsied and stored in formalin for histopathology and tissue 41Ca tracer measurements. A diagram of the heart tissue sampling distributed for each experimental method is shown in Figure3.
Figure 3.
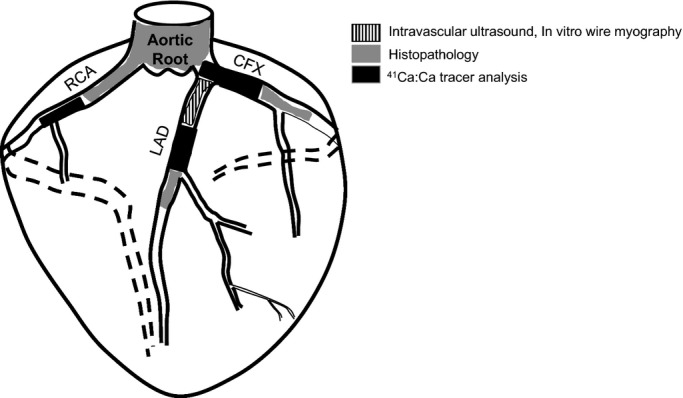
Diagram of tissue sampling and distribution for analysis. CFX indicates circumflex; LAD, left anterior descending; RCA, right coronary artery.
In Vitro Wire Myography
Detailed procedures used to assess vasoactive responses of arterial rings have been published previously.26–28 Proximal LAD segments in ice-cold Krebs bicarbonate buffer were immediately cleaned of adipose and connective tissue and cut into 4 rings ≈2 to 3 mm in length. The rings were mounted on a 4-channel in vitro wire myograph (Myobath II; World Precision Instruments) and submerged in individual organ baths filled with the Krebs buffer solution (pH 7.4) maintained at 37°C and bubbled with 5% CO2 and 95% O2. Following an equilibration period, resting tension was set between 5 and 6 g for each ring segment; this resting tension was previously demonstrated to be optimal for porcine coronary arteries.28,29
Bradykinin and sodium nitroprusside were used to examine endothelium-dependent and -independent vasorelaxation, respectively. Following preconstriction with prostaglandin F2α (30 μmol/L), increasing doses of bradykinin (10−11 to 10−6 mol/L) or sodium nitroprusside (10−10 to 10−4 mol/L) were added to each bath. Vessels were washed with the Krebs buffer solution and allowed to return to baseline tensions before proceeding to the subsequent dose-response protocol.
Histopathology
Two or 3 cross-sections from formalin-fixed tissues including the midproximal right and circumflex coronary artery, mid-distal LAD coronary artery, and the aortic root were examined microscopically for each pig. Slides of artery cross-sections were prepared for paraffin embedding, cut at 5-µm thickness, and stained with hematoxylin and eosin stain and von Kossa stain using standard techniques. Each arterial cross-section was examined by quadrant (Figure4A and 4B) for the presence of atherosclerotic or calcified plaque. The proportion of quadrants with atherosclerotic or calcified plaque was determined to assess plaque burden of each artery.
Figure 4.
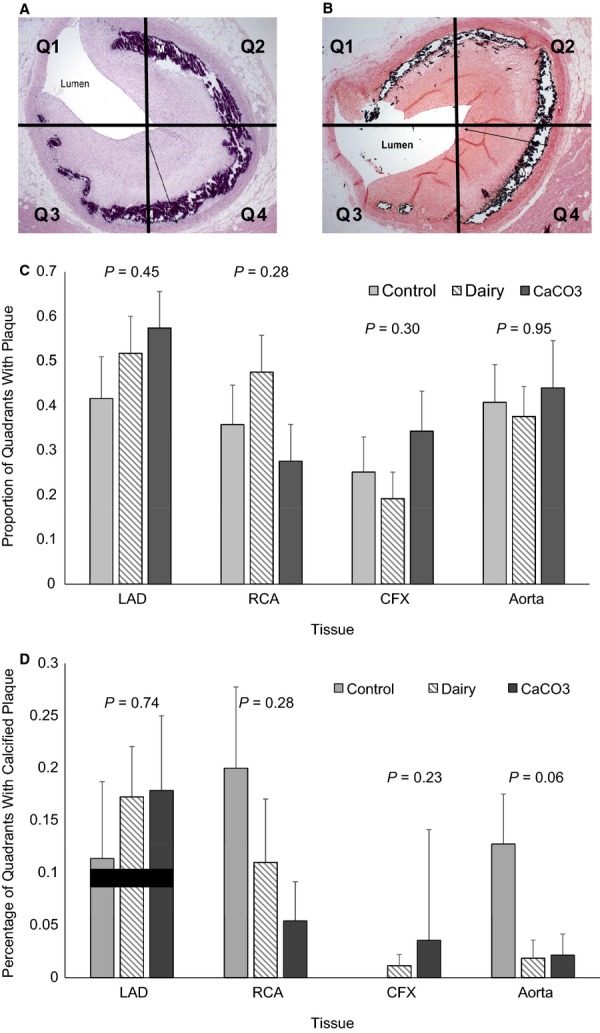
Histopathology of swine coronary arteries to assess atherosclerotic and calcified plaque coverage. Cross-sections of coronary arteries and aorta were stained with hematoxylin and eosin stain (A) and von Kossa stain (B) and examined by quadrant for presence of atherosclerotic plaque and calcified plaque. C, Proportion of total quadrants examined with atherosclerotic plaque present. D, Proportion of quadrants examined with calcified plaque present. Data are expressed as mean±SEM. Note: The control group had no detectable calcification in the CFX. CFX indicates circumflex; LAD, left anterior descending; RCA, right coronary artery; Q, quandrant.
41Ca:Ca Measurements in Serum and Tissue
Formalin-fixed arteries were cleaned of connective tissue and fat and dried overnight. Dried coronary artery samples weighing 2.5 to 37.4 mg were digested in concentrated nitric acid for metal analysis and diluted with ultrapure deionized water. Small aliquots of the digested tissue samples were further diluted with 0.5% lanthanum as LaCl3 for total calcium determination by atomic absorption spectroscopy. Serum obtained from the serial kinetic blood draws and the digested coronary artery samples were analyzed for 41Ca:Ca using accelerator mass spectrometry.21
Compartmental Kinetic Modeling with 41Ca
Kinetic data including values for 41Ca:Ca and total calcium of the serum and coronary arteries were used to fit a compartmental model20 with the Windows version of Simulation, Analysis, and Modeling (WinSAAM) computer software.30 The model consists of 3 compartments considered to represent exchangeable calcium in serum, extravascular fluid, and bone, respectively.21 A single loss pathway was incorporated to account for calcium deposition in bone, urinary excretion from the kidney, and endogenous intestinal excretion. The pigs were assumed to be in steady state because the amount of calcium fed was constant over the 6-month intervention period. The model was first fitted to the serum 41Ca:Ca data by allowing the transfer coefficients and initial volumes of distribution to be adjustable in WinSAAM. The 41Ca:Ca ratio was determined as the tracer in the first compartment divided by the steady state mass of that compartment (serum calcium concentration times volume of distribution). The tissue data were fitted by pathways from the plasma-containing compartment to pools representing the LAD, right, and circumflex coronary arteries, as previously described.20 The initial amount of calcium in the coronary arteries was made adjustable so that the amount measured at sacrifice corresponded to the calculated mass.
Data Analysis
The study was powered at 80% to detect differences of 0.46 (10−10) in our primary end point, tissue 41Ca:Ca levels, for n =8 per group.
Data from the in vitro wire myography studies were calculated as the percentage of relaxation from prostaglandin F2α–induced constriction. Resultant concentration response curves for the 2 agonists tested (Figure5) were fitted to a 4-parameter logistic equation using nonlinear regression, and EC50 (the effective concentration producing 50% of the maximal response) values were derived using Origin 9.1 (OriginLab Corporation).
Figure 5.
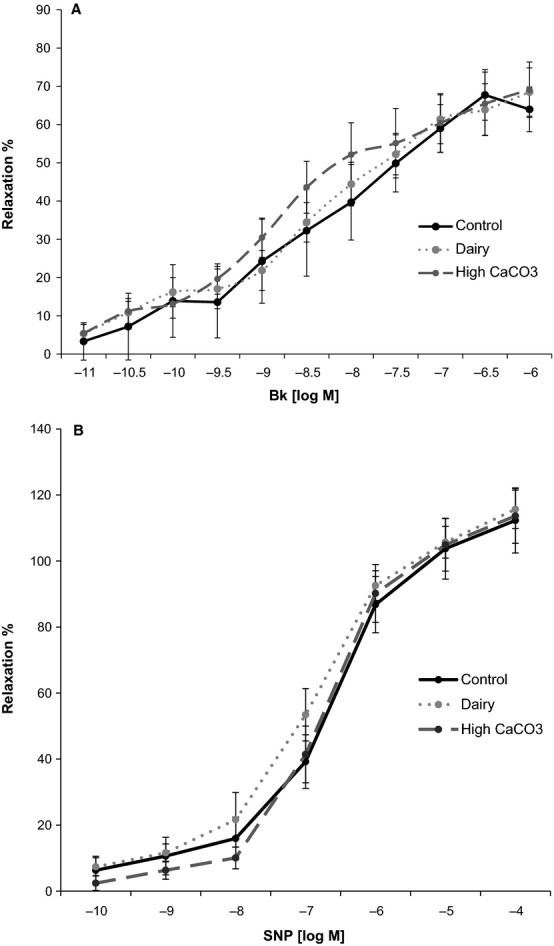
Relaxation responses of swine LAD coronary artery in response to Bk and SNP by in vitro wire myography. A, Log concentration–response curves for Bk in swine LAD coronary artery ring segments. Relaxation responses, shown as mean±SEM, are expressed as a percentage of the PGF2α-induced contraction. B, Log concentration–response curves for SNP in LAD segments. Relaxation responses, shown as mean±SEM, are expressed as a percentage of the PGF2α-induced contraction. Bk indicates bradykinin; LAD, left anterior descending; PGF2α, prostaglandin F2α; SNP, sodium nitroprusside.
Relationships between dietary treatment groups and outcome measures were analyzed using ANOVA with Student-Newman–Keuls post hoc analysis with commercially available software (SAS 9.2). P<0.05 was set for attaining statistical significance. Data are expressed as mean±SEM.
Results
Weights and Biochemistries
Reference data for lean female pigs (unpublished data from the laboratory of M. Sturek) that were approximately matched for age and sex confirmed fundamental characteristics of metabolic syndrome in the study pigs (Table2). Similar reference data for lean male Ossabaw pigs have been published previously.31,32
Table 2.
End-of-Treatment Parameters of Metabolic Syndrome in Ossabaw Swine From the Present Study Compared With Values From Age- and Sex-Matched Lean Reference Ossabaw Swine*
| Lean Reference Pigs Mean (±SEM) | Study Pigs Mean (±SEM) | P Value | |
|---|---|---|---|
| n =8 | n =22 | ||
| Body weight, kg | 45 (±3) | 93 (±3)† | <0.0001 |
| Fasted glucose, mmol/L | 3.5 (±0.1) | 3.3 (±0.2)† | 0.50 |
| Total-C, mmol/L | 1.42 (±0.1)‡ | 14.4 (±0.8) | <0.0001 |
| TG, mmol/L | 0.2 (±0.0)‡ | 1.2 (±0.2) | 0.0012 |
| LDL-C, mmol/L | 0.4 (±0.1) | 12.2 (±0.8) | <0.0001 |
| HDL-C (mmol/L) | 0.9 (±0.1) | 1.8 (±0.2) | 0.002 |
| Systolic blood pressure, mm Hg | 122 (±8) | 133 (±4) | 0.19 |
| Diastolic blood pressure, mm Hg | 78 (±7) | 94 (±3) | 0.02 |
HDL-C indicates high-density lipoprotein cholesterol; LDL-C, low-density lipoprotein cholesterol; TG, triglyceride; Total-C, total cholesterol.
Data for lean age- and sex-matched reference pigs are unpublished and were provided by the laboratory of Michael Sturek at the Indiana University School of Medicine (Indianapolis, IN).
n =23.
n =9.
Although pigs in the dairy group tended to consume more food per day, differences in total food consumption were not statistically significant among groups (control, 1143±39 g/day; dairy, 1322±26 g/day; CaCO3, 1248±84 g/day; P =0.08). The average daily calcium intake was similar between the dairy and CaCO3 treatment groups, and as expected, both of these groups consumed significantly more calcium than the control group (control, 4.05±1.30 g/day; dairy, 23.20±0.25 g/day; CaCO3, 21.61±1.56 g/day; P<0.0001). Body weights were similar among groups at baseline (control, 58.85±1.01 kg; dairy, 56.15±1.43 kg; CaCO3, 57.23±0.86 kg; P =0.26) and at the end of the 6-month treatment (Table3).
Table 3.
End-of-Treatment Phenotypic Characteristics of the Ossabaw Swine by Treatment Group
| Parameter | Control (n =8) | Dairy (n =7) | CaCO3 (n =7) | P Value |
|---|---|---|---|---|
| Body weight, kg | 88.70 (±2.66) | 97.53 (±2.93) | 93.96 (±6.22) | 0.31 |
| Heart weight, g | 207.14 (±6.12) | 220.39 (±7.83) | 216.47 (±8.50) | 0.44 |
| Heart weight:body weight, g/kg | 2.37 (±0.08) | 2.25 (±0.07) | 2.26 (±0.08) | 0.48 |
| Systolic blood pressure, mm Hg | 140 (±4) | 127 (±5) | 133 (±9) | 0.41 |
| Diastolic blood pressure, mm Hg | 95 (±3) | 92 (±6) | 95 (±5) | 0.93 |
| Resting heart rate, bpm | 81 (±9) | 86 (±7) | 80 (±6) | 0.84 |
| Total-C, mmol/L | 13.40 (±0.92) | 18.80 (±1.06)† | 12.96 (±0.98) | 0.001 |
| HDL-C, mmol/L | 1.62 (±0.12) | 1.63 (±0.24) | 2.30 (±0.30)* | 0.09 |
| LDL-C, mmol/L | 10.55 (±0.99) | 16.56 (±1.14)† | 10.48 (±1.06) | 0.001 |
| LDL-C:HDL-C | 6.91 (±1.34) | 11.84 (±1.45)* | 4.85 (±1.34) | 0.008 |
| TG, mmol/L | 1.11 (±0.28) | 1.55 (±0.40) | 1.13 (±0.25) | 0.61 |
| Blood glucose, mmol/L | 3.36 (±0.23) | 3.59 (±0.19) | 3.06 (±0.28) | 0.47 |
| Creatinine, mmol/L | 62.76 (±7.96) | 79.56 (±7.96) | 61.88 (±9.72) | 0.17 |
| C-reactive protein, mg/L | 52.08 (±16.68) | 61.89 (±19.31) | 41.81 (±13.30) | 0.71 |
| Serum total Ca, mmol/L | 2.62 (±0.03) | 2.62 (±0.05) | 2.61 (±0.02) | 0.97 |
| Serum phosphorous, mmol/L | 2.39 (±0.05) | 2.31 (±0.05) | 2.35 (±0.11) | 0.92 |
| Parathyroid hormone, pg/mL‡ | 17.81 (±8.80) | 6.30 (±0.93) | 6.38 (±0.08) | 0.32 |
| 25-hydroxyvitamin D, nmol/L | 52.50 (±3.26) | 52.60 (±5.41) | 52.00 (±1.93) | 0.99 |
Blood chemistry values were from fasted samples. Data are mean (±SEM). bpm indicates beats per minute; HDL-C, high-density lipoprotein cholesterol; LDL-C, low-density lipoprotein cholesterol; TG, triglyceride; Total-C, total cholesterol.
P<0.05, different from others.
P<0.01, different from others.
n =2 pigs per group.
There were no treatment differences in systolic blood pressure, diastolic blood pressure, and pulse rate (Table3). Fasting concentrations of serum triglycerides, C-reactive protein, calcium, phosphorous, and creatinine were not significantly different among treatment groups. The dairy group had significantly elevated total cholesterol, LDL-C:HDL-C ratio, and calculated LDL-C compared with control and CaCO3 groups, whereas the CaCO3 group had significantly elevated HDL-C compared with the control and dairy groups (Table3).
In Vivo Imaging
Ventricular stroke volume and ejection fraction at rest under isoflurane anesthesia did not differ significantly by treatment group (stroke volume: control, 46.53±9.52 mL; dairy, 59.05±8.14 mL; CaCO3, 50.23±7.05 mL; ejection fraction: control, 0.49±0.10; dairy, 0.58±0.06; CaCO3, 0.43±0.04). All pigs that underwent CT scans (n =10) had CAC scores of 0 (ie, undetectable CAC). Data obtained from intravascular ultrasound revealed no treatment effect on percentage of plaque burden of the proximal LAD (Figure2).
Serum Calcium Response to Feeding
The serum calcium AUC0–720 and Cmax data for both of the high-calcium diets in response to the test diets were not significantly different from the control diet, likely because of high variability in the response (AUC0–720: control, 115.30±67.13 mg·min/dL; dairy, 218.40±117.52 mg·min/dL; CaCO3, 259.00±91.75 mg·min/dL; Cmax: control, 0.12±0.05 mmol/L; dairy, 0.19±0.05 mmol/L; CaCO3, 0.21±0.07 mmol/L). The Tmax was not significantly different among groups (control, 193.1±81.5 minutes; dairy, 338.6±101.6 minutes; CaCO3, 345.0±101.7 minutes).
Vasoactive Responses of the Coronary Artery
Characteristics of the LAD ring segments and vasoactive responses are summarized in Table4. Bradykinin and sodium nitroprusside, the endothelium-dependent and -independent vasodilators used, produced significant concentration-dependent relaxation responses of porcine proximal LAD segments preconstricted with prostaglandin F2α (Figure5); however, there were no significant differences in response due to diet. Both bradykinin and sodium nitroprusside produced a concentration-dependent response with similar EC50 and maximal relaxation response across treatments.
Table 4.
Ring Segment Characteristics and Relaxation Responses to Bk and SNP Using Ossabaw Swine LAD
| Variables | Control (n =7) | Dairy (n =8) | CaCO3 (n =7) | P Value |
|---|---|---|---|---|
| Resting tension, g | 5.52 (±2.15) | 5.50 (±1.08) | 5.44 (±0.92) | 0.99 |
| PGF2α tension, g | 8.95 (±2.02) | 8.76 (±1.43) | 7.67 (±0.97) | 0.86 |
| Length, mm | 2.63 (±0.28) | 2.19 (±0.13) | 2.16 (±0.13) | 0.17 |
| Outer diameter, mm | 2.87 (±0.28) | 2.49 (±0.09) | 2.76 (±0.10) | 0.07 |
| Inner diameter, mm | 1.10 (±0.12) | 1.06 (±0.12) | 1.21 (±0.12) | 0.67 |
| Thickness, mm | 1.78 (±0.17) | 1.44 (±0.15) | 1.57 (±0.10) | 0.29 |
| Inner diameter/thickness | 0.68 (±0.16) | 0.82 (±0.19) | 0.80 (±0.13) | 0.75 |
| EC50 Bk, log M | 7.51 (±0.62) | 7.21 (±0.42) | 7.36 (±0.56) | 0.92 |
| EC50 SNP, log M | 7.12 (±0.49) | 6.93 (±0.16) | 6.66 (±0.23) | 0.61 |
| Max Bk (% relaxation) | 70.25 (±7.81) | 69.09 (±8.64) | 70.18 (±8.99) | 0.99 |
| Max SNP (% relaxation) | 120.10 (±17.39) | 115.82 (±6.22) | 114.23 (±10.82) | 0.94 |
Data are mean (±SEM). Bk indicates bradykinin; EC50, half-maximal effective concentration; LAD, left anterior descending; PGF2α, prostaglandin F2α; SNP, sodium nitroprusside.
Histopathology
The proportion of coronary artery quadrants examined with visible atherosclerotic plaque or calcified atherosclerotic plaque did not differ among dietary groups (Figure4). There was a trend for more quadrants containing calcified plaque in the aortas of pigs consuming the control diet versus the CaCO3 or dairy diets (control, 0.13±0.05, n =8; dairy, 0.02±0.02, n =8; CaCO3, 0.02±0.02, n =7; P =0.06).
41Ca Kinetics
The total calcium content of the LAD, circumflex, and right coronary artery samples (in milligrams of calcium per gram of dry weight of tissue) did not differ across treatment groups (Table5). Similarly, the ratio of 41Ca:Ca of the coronary arteries did not differ across the treatment groups (Table5). Overall, 27 of the coronary artery samples (47% of the total samples) had values below the limit of detection due to the small amount of calcium present in the sample (0.020 to 6.780 mg); therefore, 2.5 mg Ca was added to all of these samples so that their ratios could be determined. The samples that had large enough ratios for successful assay averaged 0.387 mg Ca per sample, whereas those that ran below the detection limit averaged 0.172 mg Ca per sample. Because the amount of calcium in the original sample and the precise amount added to the sample was known, determination of 41Ca:Ca after a successful measurement was simple. A sample had to have twice the ratio of the average of the blank ratios to be considered above the detection limit. One pig from the control group was excluded from final kinetic analysis because it had calcium transport rates to the coronary artery pools that were several hundred times higher than those of the other pigs. Pigs from the present study appeared to have coronary artery 41Ca:Ca similar to the pigs with metabolic syndrome from the pilot study and elevated coronary artery 41Ca:Ca values compared to those of the lean pigs from the previous study,20 suggesting active CAD development because calcium is a component of atherosclerotic plaque. There were no differences in fractional transfer coefficients among treatment groups (data not shown), indicating that the serum curves for 41Ca:Ca did not differ (Figure6). Because the serum is the source of 41Ca in arteries and the serum curves did not differ, the 41Ca:Ca ratios in the arteries correlate with, and thus represent, rates of transfer of calcium from blood to the artery.
Table 5.
Calcium Content of Arteries
| Control | Dairy | CaCO3 | P Value | |
|---|---|---|---|---|
| Total artery calcium (mg/g tissue) | ||||
| LAD | 6.91±1.21 (7) | 6.38±1.16 (7) | 5.95±1.44 (7) | 0.38 |
| RCA | 5.41±1.23 (7) | 2.92±0.35 (7) | 5.82±2.82 (7) | 0.10 |
| CFX | 4.84±1.42 (7) | 4.00±1.65 (7) | 3.94±0.58 (7) | 0.87 |
| Averaged for each pig | 5.72±0.83 (7) | 4.43±0.78 (7) | 5.24±1.54 (7) | 0.31 |
| Artery 41Ca:Ca (×10−10) | ||||
| LAD | 2.19±0.96 (5) | 1.36±0.35 (4) | 2.07±1.50 (3) | 0.95 |
| RCA | 1.06±0.55 (5) | 1.06±0.16 (5) | 0.97±0.10 (4) | 0.37 |
| CFX | 1.69±0.99 (2) | 1.13±0.31 (6) | 0.62±0.12 (3) | 0.80 |
| Averaged for each pig | 1.90±0.63 (7) | 1.21±0.25 (7) | 1.17±0.33 (7) | 0.44 |
Values are mean±SEM (n). CFX indicates circumflex; LAD, left anterior descending; RCA, right coronary artery.
Figure 6.
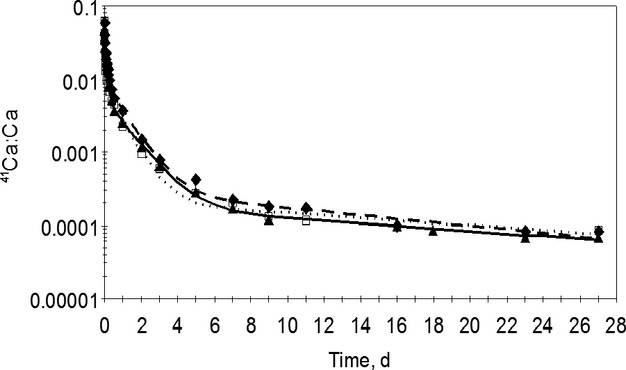
Serum 41Ca:Ca in a representative study pig from each treatment group over the 27 days after the tracer dose. The lines were calculated by the compartmental model,20 and the symbols represent observed data. Solid line with triangles (control); dashed line with diamonds (dairy); dotted line with squares (CaCO3).
Because of concerns with normality, the nonparametric Kruskal–Wallis procedure was also used to assess outcomes; however, similar results were observed with both the parametric and nonparametric procedures, so results of the original ANOVA procedure are reported throughout the paper.
Discussion
In this randomized feeding trial, elevated calcium intakes, intended to reflect human intakes of 2000 to 2500 mg/day, compared with adequate calcium intakes did not result in significantly worsened indices of cardiovascular function, coronary artery plaque burden, or CAC in Ossabaw miniature swine fed an atherogenic diet for 6 months. This was true whether the predominant source of calcium in the feed was nonfat dairy or CaCO3.
The rationale for using the atherogenic diet was to induce the disease process; however, the study was designed so that outcomes were measured sufficiently early in disease development to determine whether disease severity was greater in pigs fed high calcium. Although the pigs showed the presence of CAD, there were no differences in severity between those on adequate versus high calcium diets. Pigs demonstrated similar end-of-treatment body weights, organ weights, serum triglycerides, and systolic and diastolic blood pressures, regardless of dietary condition. Serum HDL-C was elevated in the CaCO3 group, whereas LDL-C, total cholesterol, and the ratio of LDL-C:HDL-C were elevated in the dairy group compared with the other 2 treatments. The elevation of selected lipid parameters observed in the dairy group is likely a result of the tendency for the pigs in this group to consume more of the atherogenic diet per day. In support of this hypothesis, serum total cholesterol concentration was demonstrated to be positively correlated with average daily food intake (r =0.66; P =0.002). The absence of greater CAD in the dairy group is especially profound because the dairy group had higher LDL-C, which is the major driving influence in CAD. There was no observed dietary effect on vascular function determined by endothelium-dependent and -independent responses to bradykinin and sodium nitroprusside measured using in vitro wire myography. Plaque burden and percentage of atherosclerotic and calcified plaque coverage in the coronary arteries did not differ among groups, as measured by intravascular ultrasound and histopathology, respectively. All pigs that underwent CT scans had a CAC score of 0 because the disease was not advanced to a stage at which the calcified plaque was detectable by CT scan, the current cornerstone of CAC assessment in the clinical setting; however, coronary artery calcium tracer accumulation, detectable by accelerator mass spectrometry, demonstrated that coronary artery 41Ca:Ca was similar among treatment groups. Kinetic modeling demonstrated that these ratios were correlated with rates of calcium transport from the blood to the coronary arteries. These findings do not support the theory that high calcium intakes may adversely affect cardiovascular health by accelerating calcium deposition in the coronary arteries.
In the present study, pigs randomized to the high-calcium diets had fasted serum total calcium after 6 months similar to that of pigs on the control calcium diet. Serum calcium AUC0–720 and Cmax appeared slightly elevated in the dairy and CaCO3 groups after feeding; however, this difference was not significant, likely due to the large variability in response observed between individual pigs. Although large doses of supplemental calcium (typically >500 mg) may elevate serum calcium above baseline levels for several hours in humans,33,34 this change is transient. In healthy adults, prolonged elevation of serum calcium is prevented by the combined hormonal actions of vitamin D, parathyroid hormone, and calcitonin that work to maintain serum calcium within a tightly regulated homeostatic range.35 In healthy adults, 1000 mg of a single dose of calcium citrate has been demonstrated to acutely elevate serum calcium concentrations and subsequently improve pulse rate and the augmentation index relative to baseline.36 The cardiovascular effects of this acute elevation in circulating calcium, if recurring on a daily basis over an extended period of time, are not well understood.
Through the use of the swine model, we were able to achieve controlled high-calcium feeding over a 6-month period and to use invasive methodology with the capability to detect early CAC. Relative to rodent and rabbit models of CAD, swine possess more anatomical and physiological similarities to humans including similar organ size and lipid metabolism.37 Notably, having evolved on the isolated Ossabaw Island, the Ossabaw pig exhibits a thrifty genotype that allows for efficient accumulation of adipose tissue, dyslipidemia, hypertension, insulin resistance, and CAD when fed an atherogenic diet for several months.18,31,32
An additional strength of this study was the use of a novel calcium tracer with sufficient sensitivity to detect atom quantities of early CAD-induced coronary artery calcium accumulation. A method with this sensitivity is crucial because >99% of calcium in the body is found in bone and relatively very little is deposited in soft tissues. Because the 41Ca tracer dose was given 1 month prior to the conclusion of the study, coronary artery 41Ca:Ca is a reflection of dietary-induced CAD and subsequent calcium deposition in these tissues during the final month of intervention. All pigs that underwent CT scans had no detectable CAC, whereas measurable amounts of 41Ca tracer were found in the tissues, indicating that 41Ca deposition can detect vascular calcification much earlier than the CT scan. Because the precise location of coronary artery plaque accumulation in disease states may differ, representative samples of 3 coronary arteries were examined. Limitations include the likely inability to generalize the findings to patients with chronic kidney disease, who often experience accelerated vascular calcification,38 which is a likely result of prolonged elevation of serum phosphorous and bouts of hypercalcemia that occur when the kidneys inefficiently excrete these minerals. In addition, this study focused on mild to moderate atheromas, and because calcification progression is quite nonlinear and rather exponential, it cannot be excluded that more advanced atheromas with complex calcium aggregates could exhibit different behavior than those in the present study.
Conclusions
The majority of evidence to date suggesting associations between supplemental calcium and cardiovascular risk in otherwise healthy adults comes from prespecified secondary analysis of studies designed to investigate bone outcomes or associational studies of calcium intake and CAC scores. Concern exists about the cardiovascular safety of calcium supplementation because no dose-response relationship or underlying physiological mechanism to explain this relationship has been demonstrated. Achieving recommended calcium intakes to promote bone health is often facilitated by calcium supplementation because dietary calcium intake remains low in many populations. This study used a novel calcium isotope and kinetic modeling to sensitively explore the causal relationship of an atherogenic diet enriched with calcium with early CAC in an animal model with a disease process that was more comparable to humans than models such as rodent or rat. The findings support the hypothesis that high consumption of calcium as nonfat dairy or CaCO3 does not pose a cardiovascular risk through the acceleration of calcium deposition in the coronary arteries.
Acknowledgments
We thank Pam Lachcik, Ania Kempa-Steczko, the Purdue Rare Isotope Measurement Laboratory, Josh Sturek, Brandy Sparks, Jay Patel, Jim Byrd, John Martin, Gary Hutchins, Paul Territo, Yun Liang, Scott Persohn, Schuylar McGuffey, Kelsey Kramer, Kristen Smole, Kassandra Knauth, Nicole Sykora, Jacob Haury, Shelby Englert, Rachel Korty, Taylor Elvord, and Ardith Wang for their technical assistance.
Sources of Funding
This research was funded by Pharmavite LLC, the Dairy Research Institute, Dairy Australia, Fonterra Co-operative Group Limited, Kraft Foods Inc, Nestle, and NIH grants HL062552 and TR000162. Full editorial control remained with the authors.
Disclosures
Connie Weaver is on the scientific advisory board for Pharmavite LLC and Pfizer Consumer Health Care. All other authors: none.
References
- Weaver CM. Calcium supplementation: is protecting against osteoporosis counter to protecting against cardiovascular disease? Curr Osteoporos Rep. 2014;12:211–218. doi: 10.1007/s11914-014-0208-1. [DOI] [PubMed] [Google Scholar]
- Heaney RP, Kopecky S, Maki KC, Hathcock J, Mackay D, Wallace TC. A review of calcium supplements and cardiovascular disease risk. Adv Nutr. 2012;3:763–771. doi: 10.3945/an.112.002899. [DOI] [PMC free article] [PubMed] [Google Scholar]
- U.S. Department of Health and Human Services. Bone Health and Osteoporosis: a Report of the Surgeon General. Rockville: U.S Department of Health and Human Services; 2004. [Google Scholar]
- Bailey RL, Dodd KW, Goldman JA, Gahche JJ, Dwyer JT, Moshfegh AJ, Sempos CT, Picciano MF. Estimation of total usual calcium and vitamin D intakes in the United States. J Nutr. 2010;140:817–822. doi: 10.3945/jn.109.118539. [DOI] [PMC free article] [PubMed] [Google Scholar]
- Bolland MJ, Avenell A, Baron JA, Grey A, MacLennan GS, Gamble GD, Reid IR. Effect of calcium supplements on risk of myocardial infarction and cardiovascular events: meta-analysis. BMJ. 2010;341:c3691. doi: 10.1136/bmj.c3691. [DOI] [PMC free article] [PubMed] [Google Scholar]
- Bolland MJ, Grey A, Gamble GD, Reid IR. Calcium and vitamin D supplements and health outcomes: a reanalysis of the Women’s Health Initiative (WHI) limited-access data set. Am J Clin Nutr. 2011;94:1144–1149. doi: 10.3945/ajcn.111.015032. [DOI] [PMC free article] [PubMed] [Google Scholar]
- Michaelsson K, Melhus H, Warensjo Lemming E, Wolk A, Byberg L. Long term calcium intake and rates of all cause and cardiovascular mortality: community based prospective longitudinal cohort study. BMJ. 2013;346:f228. doi: 10.1136/bmj.f228. [DOI] [PMC free article] [PubMed] [Google Scholar]
- Li K, Kaaks R, Linseisen J, Rohrmann S. Associations of dietary calcium intake and calcium supplementation with myocardial infarction and stroke risk and overall cardiovascular mortality in the Heidelberg cohort of the European Prospective Investigation into Cancer and Nutrition study (EPIC-Heidelberg) Heart. 2012;98:920–925. doi: 10.1136/heartjnl-2011-301345. [DOI] [PubMed] [Google Scholar]
- Bolland MJ, Barber PA, Doughty RN, Mason B, Horne A, Ames R, Gamble GD, Grey A, Reid IR. Vascular events in healthy older women receiving calcium supplementation: randomised controlled trial. BMJ. 2008;336:262–266. doi: 10.1136/bmj.39440.525752.BE. [DOI] [PMC free article] [PubMed] [Google Scholar]
- Kim JH, Yoon JW, Kim KW, Lee EJ, Lee W, Cho SH, Shin CS. Increased dietary calcium intake is not associated with coronary artery calcification. Int J Cardiol. 2012;157:429–431. doi: 10.1016/j.ijcard.2012.03.171. [DOI] [PubMed] [Google Scholar]
- Manson JE, Allison MA, Carr JJ, Langer RD, Cochrane BB, Hendrix SL, Hsia J, Hunt JR, Lewis CE, Margolis KL, Robinson JG, Rodabough RJ, Thomas AM Women’s Health Initiative and Women’s Health Initiative-Coronary Artery Calcium Study Investigators. Calcium/vitamin D supplementation and coronary artery calcification in the Women’s Health Initiative. Menopause. 2010;17:683–691. doi: 10.1097/gme.0b013e3181d683b5. [DOI] [PMC free article] [PubMed] [Google Scholar]
- Samelson EJ, Booth SL, Fox CS, Tucker KL, Wang TJ, Hoffmann U, Cupples LA, O’Donnell CJ, Kiel DP. Calcium intake is not associated with increased coronary artery calcification: the Framingham Study. Am J Clin Nutr. 2012;96:1274–1280. doi: 10.3945/ajcn.112.044230. [DOI] [PMC free article] [PubMed] [Google Scholar]
- Lewis JR, Radavelli-Bagatini S, Rejnmark L, Chen JS, Simpson JM, Lappe JM, Mosekilde L, Prentice RL, Prince RL. The effects of calcium supplementation on verified coronary heart disease hospitalization and death in postmenopausal women: a collaborative meta-analysis of randomized controlled trials. J Bone Miner Res. 2015;30:165–175. doi: 10.1002/jbmr.2311. [DOI] [PubMed] [Google Scholar]
- Minino AM, Murphy SL, Xu J, Kochanek KD. Deaths: final data for 2008. Natl Vital Stat Rep. 2011;59:1–126. [PubMed] [Google Scholar]
- Richmond J, Aharonoff GB, Zuckerman JD, Koval KJ. Mortality risk after hip fracture. J Orthop Trauma. 2003;17(8 suppl):S2–S5. doi: 10.1097/00005131-200309001-00002. [DOI] [PubMed] [Google Scholar]
- Reid IR, Bolland MJ. Calcium supplements: bad for the heart? Heart. 2012;98:895–896. doi: 10.1136/heartjnl-2012-301904. [DOI] [PubMed] [Google Scholar]
- Pletcher MJ, Tice JA, Pignone M, Browner WS. Using the coronary artery calcium score to predict coronary heart disease events: a systematic review and meta-analysis. Arch Intern Med. 2004;164:1285–1292. doi: 10.1001/archinte.164.12.1285. [DOI] [PubMed] [Google Scholar]
- Neeb ZP, Edwards JM, Alloosh M, Long X, Mokelke EA, Sturek M. Metabolic syndrome and (CAD) in Ossabaw compared with Yucatan swine. Comp Med. 2010;60:300–315. [PMC free article] [PubMed] [Google Scholar]
- Wang HW, Langohr IM, Sturek M, Cheng JX. Imaging and quantitative analysis of atherosclerotic lesions by CARS-based multimodal nonlinear optical microscopy. Arterioscler Thromb Vasc Biol. 2009;29:1342–1348. doi: 10.1161/ATVBAHA.109.189316. [DOI] [PMC free article] [PubMed] [Google Scholar]
- Wastney M, Lee W, Jackson GS, Alloosh M, Sturek M, Lachcik P, Peacock M, Martin B, Weaver CM. Soft tissue calcification in the Ossabaw miniature pig: experimental and kinetic modeling studies. Osteoporos Int. 2012;24:2123–2126. doi: 10.1007/s00198-012-2229-x. [DOI] [PubMed] [Google Scholar]
- Lee WH, Wastney ME, Jackson GS, Martin BR, Weaver CM. Interpretation of 41Ca data using compartmental modeling in post-menopausal women. Anal Bioanal Chem. 2011;399:1613–1622. doi: 10.1007/s00216-010-4454-5. [DOI] [PMC free article] [PubMed] [Google Scholar]
- Sturek M, Alloosh M, Wenzel J, Byrd JP, Edwards JM, Lloyd PG, Tune JD, March KL, Miller MA, Mokelke EA. Brisbin IL., Jr . Ossabaw Island miniature swine: cardiometabolic syndrome assessment. In: Swindle MM, editor; Swine in the Laboratory: Surgery, Anesthesia, Imaging, and Experimental Techniques. Boca Raton, FL: CRC Press; 2007. pp. 397–402. [Google Scholar]
- Friedewald WT, Levy RI, Fredrickson DS. Estimation of the concentration of low-density lipoprotein cholesterol in plasma, without use of the preparative ultracentrifuge. Clin Chem. 1972;18:499–502. [PubMed] [Google Scholar]
- Libby P, Ridker PM, Maseri A. Inflammation and atherosclerosis. Circulation. 2002;105:1135–1143. doi: 10.1161/hc0902.104353. [DOI] [PubMed] [Google Scholar]
- Agatston AS, Janowitz WR, Hildner FJ, Zusmer NR, Viamonte M, Jr, Detrano R. Quantification of coronary artery calcium using ultrafast computed tomography. J Am Coll Cardiol. 1990;15:827–832. doi: 10.1016/0735-1097(90)90282-t. [DOI] [PubMed] [Google Scholar]
- Newcomer SC, Taylor JC, Bowles DK, Laughlin MH. Endothelium-dependent and -independent relaxation in the forelimb and hindlimb vasculatures of swine. Comp Biochem Physiol A Mol Integr Physiol. 2007;148:292–300. doi: 10.1016/j.cbpa.2007.04.020. [DOI] [PubMed] [Google Scholar]
- Padilla J, Newcomer SC, Simmons GH, Kreutzer KV, Laughlin MH. Long-term exercise training does not alter brachial and femoral artery vasomotor function and endothelial phenotype in healthy pigs. Am J Physiol Heart Circ Physiol. 2010;299:H379–H385. doi: 10.1152/ajpheart.00294.2010. [DOI] [PMC free article] [PubMed] [Google Scholar]
- Ingram DG, Newcomer SC, Price EM, Eklund KE, McAllister RM, Laughlin MH. Chronic nitric oxide synthase inhibition blunts endothelium-dependent function of conduit coronary arteries, not arterioles. Am J Physiol Heart Circ Physiol. 2007;292:H2798–H2808. doi: 10.1152/ajpheart.00899.2006. [DOI] [PMC free article] [PubMed] [Google Scholar]
- Woodman CR, Turk JR, Rush JW, Laughlin MH. Exercise attenuates the effects of hypercholesterolemia on endothelium-dependent relaxation in coronary arteries from adult female pigs. J Appl Physiol. 2004;96:1105–1113. doi: 10.1152/japplphysiol.00767.2003. [DOI] [PubMed] [Google Scholar]
- Stefanovski D, Moate PJ, Boston RC. WinSAAM: a windows-based compartmental modeling system. Metabolism. 2003;52:1153–1166. doi: 10.1016/s0026-0495(03)00144-6. [DOI] [PubMed] [Google Scholar]
- Edwards JM, Neeb ZP, Alloosh MA, Long X, Bratz IN, Peller CR, Byrd JP, Kumar S, Obukhov AG, Sturek M. Exercise training decreases store-operated Ca2+ entry associated with metabolic syndrome and coronary atherosclerosis. Cardiovasc Res. 2010;85:631–640. doi: 10.1093/cvr/cvp308. [DOI] [PMC free article] [PubMed] [Google Scholar]
- Kreutz RP, Alloosh M, Mansour K, Neeb Z, Kreutz Y, Flockhart DA, Sturek M. Morbid obesity and metabolic syndrome in Ossabaw miniature swine are associated with increased platelet reactivity. Diabetes Metab Syndr Obes. 2011;4:99–105. doi: 10.2147/DMSO.S17105. [DOI] [PMC free article] [PubMed] [Google Scholar]
- Heaney RP, Dowell MS, Bierman J, Hale CA, Bendich A. Absorbability and cost effectiveness in calcium supplementation. J Am Coll Nutr. 2001;20:239–246. doi: 10.1080/07315724.2001.10719038. [DOI] [PubMed] [Google Scholar]
- Karp HJ, Ketola ME, Lamberg-Allardt CJ. Acute effects of calcium carbonate, calcium citrate and potassium citrate on markers of calcium and bone metabolism in young women. Br J Nutr. 2009;102:1341–1347. doi: 10.1017/S0007114509990195. [DOI] [PubMed] [Google Scholar]
- Mundy GR, Guise TA. Hormonal control of calcium homeostasis. Clin Chem. 1999;45:1347–1352. [PubMed] [Google Scholar]
- Burt MG, Mangelsdorf BL, Srivastava D, Petersons CJ. Acute effect of calcium citrate on serum calcium and cardiovascular function. J Bone Miner Res. 2013;28:412–418. doi: 10.1002/jbmr.1761. [DOI] [PubMed] [Google Scholar]
- Spurlock ME, Gabler NK. The development of porcine models of obesity and the metabolic syndrome. J Nutr. 2008;138:397–402. doi: 10.1093/jn/138.2.397. [DOI] [PubMed] [Google Scholar]
- Adeney KL, Siscovick DS, Ix JH, Seliger SL, Shlipak MG, Jenny NS, Kestenbaum BR. Association of serum phosphate with vascular and valvular calcification in moderate CKD. J Am Soc Nephrol. 2009;20:381–387. doi: 10.1681/ASN.2008040349. [DOI] [PMC free article] [PubMed] [Google Scholar]