

Abstract
Background
Coronary artery calcium (CAC) detected by noncontrast cardiac computed tomography scanning is a measure of coronary atherosclerosis burden. Increasing CAC levels have been strongly associated with increased coronary events. Prior studies of cardiovascular disease risk factors and CAC progression have been limited by short follow-up or restricted to patients with advanced disease.
Methods and Results
We examined cardiovascular disease risk factors and CAC progression in a prospective multiethnic cohort study. CAC was measured 1 to 4 times (mean 2.5 scans) over 10 years in 6810 adults without preexisting cardiovascular disease. Mean CAC progression was 23.9 Agatston units/year. An innovative application of mixed-effects models investigated associations between cardiovascular disease risk factors and CAC progression. This approach adjusted for time-varying factors, was flexible with respect to follow-up time and number of observations per participant, and allowed simultaneous control of factors associated with both baseline CAC and CAC progression. Models included age, sex, study site, scanner type, and race/ethnicity. Associations were observed between CAC progression and age (14.2 Agatston units/year per 10 years [95% CI 13.0 to 15.5]), male sex (17.8 Agatston units/year [95% CI 15.3 to 20.3]), hypertension (13.8 Agatston units/year [95% CI 11.2 to 16.5]), diabetes (31.3 Agatston units/year [95% CI 27.4 to 35.3]), and other factors.
Conclusions
CAC progression analyzed over 10 years of follow-up, with a novel analytical approach, demonstrated strong relationships with risk factors for incident cardiovascular events. Longitudinal CAC progression analyzed in this framework can be used to evaluate novel cardiovascular risk factors.
Keywords: atherosclerosis, calcium, risk factors
Coronary artery calcium (CAC) has been consistently associated with cardiovascular disease (CVD) in both clinical trials and observational research.1–5 Although most often studied as a 1-time measure of atherosclerosis extent and a risk marker of future ischemic CVD events, it can also be assessed over time. CAC progression, defined as the change in quantity of CAC over time, is itself a predictor of CVD events and has been shown to be predictive of events in a prospective cohort.2,4 As a noninvasive surrogate for evaluating risk factors for CVD, CAC progression has shown promise, although prior studies had limited duration of follow-up.
The Multi-Ethnic Study of Atherosclerosis (MESA) was designed to investigate the progression of CVD in a well-characterized, diverse, prospective cohort over a long period of time to generate a body of work that would generalize to a wider US population than has traditionally been the focus of cardiovascular research. An initial analysis of CAC progression was conducted in the MESA cohort after 2.4 years of follow-up.6 The initial analysis separated participants into those with no CAC at baseline and those with any CAC at baseline. Incidence (development of any CAC between 2 examinations) and progression among those with any CAC initially were investigated independently.
Building on that prior work, we analyzed CAC progression with 10 years of follow-up time within the MESA cohort, with up to 4 measurements per participant. We applied innovative statistical methods to allow an integrated assessment of all participants and all repeated measures. We hypothesized that this approach would provide a sensitive method of assessing risk factors for progression of atherosclerosis that could be used to evaluate additional risk factors in epidemiological research.
Methods
Study Population
MESA is a large, multicenter, prospective cohort study that has been described previously.7 Participants in MESA completed as many as 5 clinic visits and 14 follow-up phone calls. Timing of clinic visits was as follows: exam 1 in 2000 to 2002, exam 2 in 2002 to 2004, exam 3 in 2004 to 2006, exam 4 in 2005 to 2007, and exam 5 in 2010 to 2012. This study was approved by the institutional review boards at each center and at the University of Washington, and all subjects gave written informed consent.
Measurement of CAC
All participants were scanned by noncontrast cardiac computed tomography (CT) during exam 1 using methods that have been described previously.6,8 By design, about half of the participants were scanned again during exam 2 (n =2914), and the other half were scanned during exam 3 (n =2925). The exam 4 selection strategy prioritized participants without exam 3 scans and included CT scans for 1349 participants. During exam 5, a total of 3304 participants received CT scans, preferentially including participants with scans from exam 3 and/or exam 4. Scans that were obtained subsequent to coronary revascularization procedures that were performed after exam 1 were excluded from this analysis. Participants were advised of their CAC scores following each examination, and 76% of participants requested that these results be released to their physicians, along with an interpretation of the score as average or as below or above average for age and sex, without recommendations for management.9
Scanner models varied across centers and time. During exams 1 to 3, 3 centers used electron beam CT technology and 3 used multidetector CT technology.6 The latter technology was in use at all centers by exam 5. Consistent calibration of scans was conducted using a “phantom” that was described previously.8
CAC scores were calculated according to the methodology of Agatston et al.10–16 Calcified lesions of at least 4 adjacent voxels above a threshold of 130 Hounsfield units (HU) were identified; below this, scans were assigned a zero value. Volume of each calcified lesion was then multiplied by a coefficient based on the brightest voxel it contained (coefficient of 1 for a maximum of 130 to 199 HU, 2 for 200 to 299 HU, 3 for 300 to 399 HU, 4 for a maximum >400 HU). The Agatston score was calculated as the sum of the within-plane scores across all calcified lesions.
Measurement of Cardiovascular Risk Factors
The risk factors of interest included age, sex, race/ethnicity, education, household income, neighborhood socioeconomic status index,17 systolic and diastolic blood pressure, body mass index (BMI), low-density lipoprotein cholesterol (LDL-C), high-density lipoprotein cholesterol (HDL-C), triglycerides, total cholesterol, statin use, antihypertensive use, smoking status, pack-years of smoking, exposure to second-hand smoke (yes/no), diabetes status, family history of CVD, fibrinogen, (high sensitivity) C-reactive protein, and creatinine. The questionnaires and physical examinations used in MESA were described previously.7 Family history of CVD was ascertained by questionnaire during the second in-clinic follow-up examination, and family history of premature CVD was defined as myocardial infarction/heart attack, stroke/brain attack, or cardiovascular procedure (coronary bypass or balloon angioplasty) in a female primary relative (parent, sibling, or child) aged <65 years or a male primary relative aged <55 years. Neighborhood socioeconomic status index was calculated for the census tract in which participants lived during exam 1.17
Most health metrics and demographics were defined at exam 1 and considered to be static. Potential risk factors that were assessed at later exams but that were also considered to be static included family history of premature CVD (assessed at exam 2) and household income (defined as average midpoint of self-reported income category across all available examinations, with a value of $125 000 used for participants indicating an income greater than $100 000).
As a sensitivity analysis, we examined the relationship between CAC progression and smoking status as classified by the MESA Lung substudy. The MESA Lung substudy confirmed smoking status by urinary cotinine levels (Immulite 2000 Nicotine Metabolite Assay; Diagnostic Products Corp). Participants with cotinine levels >500 ng/mL were classified as current smokers, regardless of self-report. Never-smokers at exam 1 that reported being former smokers at later examinations were also reclassified as former smokers.18
Analysis
We analyzed the association between CVD risk factors and CAC progression using a mixed-effects model. Risk factors for CAC progression were analyzed in both minimally and more fully adjusted models (described in detail in “Minimally Adjusted Models”); in both cases, CAC was modeled continuously on the natural scale. The use of statins was considered as both static, defined as in use at exam 1, and time varying, defined as in use at the time of the clinical examination concurrent with CT scan. To further investigate the association between statin use and CAC progression, we created a categorical variable delineating participants who were using statins at exam 1, those who had never used statins, and those who had started using statins during follow-up. This variable was evaluated as a separate risk factor.
Minimally Adjusted Models
Our primary approach used minimally adjusted models. We analyzed the association between each risk factor and CAC progression in models that, in all cases, included age at exam 1, sex, race/ethnicity, metropolitan area or study site, and scanner type. In addition, in evaluating the association between CAC progression and cholesterol (total, HDL-C, LDL-C, and triglycerides), we further adjusted for statin use at exam 1. In evaluating the association between CAC progression and systolic or diastolic blood pressure, we adjusted for antihypertensive medication use at exam 1. In evaluating the association between CAC progression and antihypertensive medication use, we adjusted for hypertensive diagnosis. The associations between CAC progression and both pack-years of cigarette smoking and second-hand smoke exposure were adjusted for smoking status (never, former, current). Participants with missing data were dropped from analyses that included those variables.
Fully Adjusted Models
Our secondary approach considered a more fully adjusted model, chosen using backward selection. Because backward selection algorithms are optimized for ordinary least squares regression, we used a simplified outcome—individually calculated annual CAC progression—to select variables for a fully adjusted model.
Variables considered included age at exam 1, sex, race/ethnicity, metropolitan area or study site, BMI, smoking status, total cholesterol, HDL-C, LDL-C, diabetes status, statin use at exam 1, systolic and diastolic blood pressure, hypertension, education, income, neighborhood socioeconomic status index, and family history of CVD. Model fit was assessed using the Akaike information criterion.
Additional Sensitivity Analyses
Alternative adjustment models excluded indicators for CT scanner model or adjustment for metropolitan area. We assessed the sensitivity of the results to the outcome distribution by excluding the participants with the highest CAC progression, using cutoffs of 250 and 150 Agatston units/year, and by restricting the analysis to participants with >0 Agatston units of CAC at exam 1. We evaluated the sensitivity of the association between CAC progression and statin use by comparing statin use at exam 1 with time-varying statin use.
Mixed-effects Model
The mixed-effects model that we used in this analysis jointly modeled the cross-sectional and longitudinal relationships between CVD risk factors and CAC. The cross-sectional terms modeled an estimated baseline and control for that baseline. The cross-sectional relationships between CVD risk factors and CAC can produce biased results in a progression analysis that controls for measured baseline.19,20 Any measurement error exacerbates this bias.19,20 Adjusting for an estimated baseline allowed us to control for cross-sectional confounding without inducing bias.
The mixed-effects model provides 2 additional benefits: (1) Participants with a variable number of observations, or even a single observation, can be included in the analysis; and (2) the assumption that data are missing completely at random is not required. Consequently, selection bias is of less concern using this method compared with methods that require full follow-up for all participants or the “missing completely at random” assumption, such as generalized estimating equations or repeated-measures analysis of variance.
The specific form of the model is as follows, with participants indexed by i and exams indexed by v:
This model uses the following definitions: Yiv indicates CAC measurement for subject i at vth follow-up exam; Xi0, time-invariant cross-sectional confounders and risk factors at exam 1 for participant i; Wiv, possibly time-varying longitudinal confounders and risk factors at exam v for participant i; Uiv, time-varying variables to adjust measurements at exam v for participant i; tiv, time in years from exam 1 to the vth follow-up exam for participant i; β0, CAC progression (annual rate of change) in average participants in the reference group; β1, coefficients for associations between confounders and risk factors and rate of CAC progression (this is the term of interest); α0, average CAC measurement at exam 1 for participants in the reference group; α1, coefficients for associations between exam 1 CAC measurements and risk factors or confounders; γ1, coefficients for cross-sectional associations between time-varying variables and CAC measurements at all exams; ai, participant-specific random intercept; bi, participant-specific random slope; ϵiv, error associated with Yiv.
The model is composed of 3 parts, separated above by square brackets: (1) the cross-sectional relationship between the amount of CAC at exam 1 and values of covariates at exam 1, (2) the longitudinal relationship to model rate of change, and (3) time-varying “transient” terms that adjust for variables relevant to specific measurements. The cross-sectional terms in the model are equivalent in interpretation to terms from a cross-sectional model of the outcome at exam 1. These fixed effects (α1), together with the random intercepts (ai), model participant-specific intercepts. The longitudinal terms model an overall progression rate (β0), interpreted as the rate of change of CAC for a participant with no additional risk factors (ie, all terms Wi =0), and incorporate terms that adjust that rate (β1) according to the association between progression rate and risk factors. Values of covariates included in the transient part (Uiv) are time varying, but the transient adjustment does not modify the slope. The transient terms serve to adjust follow-up measurements that were measured under different conditions from the original. Removing systematic differences due to different conditions allows the slope to be estimated based on the measurements as if they had been taken under the same conditions.
This mixed-effects model leverages information from all participants, including those without follow-up measurements, to jointly model the amount of CAC at exam 1 and CAC progression over time, thereby adjusting progression for modeled baseline extent. Each CVD risk factor was included as both a cross-sectional term and with an interaction with time. CT scanner model was included as a transient adjustment. We included subject-specific random intercepts and random slopes. Continuous covariates other than follow-up time were mean centered and scaled to a reasonable increment prior to analysis.
P values were calculated using Satterthwaite’s approximation of denominator degrees of freedom for F statistics. All analyses were conducted using R 3.0.1 (R Foundation).21
As a sensitivity analysis and for completeness, a simplified model using annual change between exams 1 and 5 as the outcome was fit to the subset of participants with measurements available at exam 5. These results were compared with those derived from fitting the above mixed-effects model to the same subset of participants.
Results
Of the 6814 participants recruited to MESA, 744 had CAC scores only at exam 1, and 6066 had a score at both exam 1 and at least 1 follow-up exam. Four participants had exam 1 scans that could not be scored. There were 166 participants that were scanned at least once after a coronary revascularization procedure and whose postprocedure measurements were excluded. The number, timing, and exclusion of observations are described in Figure. The overall average CAC progression was 23.9 Agatston units/year among participants with at least 2 measurements (range −365 to 834, IQR 0.3 to 21.7, with a median progression rate of 3.0 Agatston units/year). At baseline, 50% of the cohort had no CAC; by exam 5, this proportion had dropped to 31%.
Figure 1.
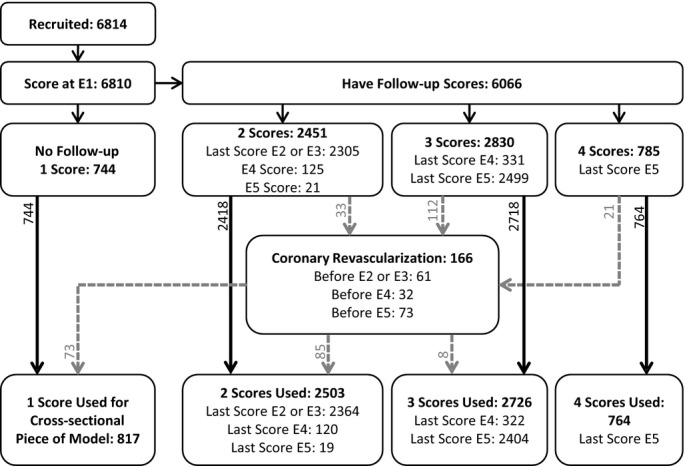
Total number of participants included and excluded, distinguished by number of participant-specific observations used in the analysis. No participants were scanned during both exam 2 (E2) and exam 3 (E3). Scores after coronary revascularization procedures were excluded.
Characteristics of the study population are provided in Table1. Participants with at least some follow-up were similar to the initial cohort in terms of race/ethnicity, sex ratio, BMI, cholesterol, baseline statin use, and smoking behavior. Participants whose last follow-up was at exam 5 tended to be slightly younger and more educated and to have higher income, less prevalence of diabetes, and lower blood pressure compared with participants who were lost to follow-up or died. Participants with longer follow-up also had noticeably less CAC at exam 1.
Table 1.
Selected Participant Characteristics at Exam 1
| All Participants | Participants With Any Follow-up | Last Follow-up in Exam 5 | |
|---|---|---|---|
| N | 6810 | 6066 | 3305 |
| Follow-up time, y | 5.8 (3.9) | 6.5 (3.5) | 9.6 (0.6) |
| Observations per Individual | 2.5 (0.8) | 2.7 (0.7) | 3.2 (0.4) |
| Agatston Score at Exam 1 | 146 (417) | 136 (383) | 100 (295) |
| CAC progression, Agatston/year | — | 24 (57) | 20 (39) |
| Age at exam 1, y | 62 (10) | 62 (10) | 60 (9) |
| Male | 3212 (47%) | 2888 (48%) | 1571 (48%) |
| Race/ethnicity | |||
| White | 2621 (38%) | 2401 (40%) | 1303 (39%) |
| Chinese | 804 (12%) | 713 (12%) | 385 (12%) |
| Black | 1890 (28%) | 1637 (27%) | 883 (27%) |
| Hispanic | 1495 (22%) | 1315 (22%) | 734 (22%) |
| Education | |||
| Less than high school | 1247 (18%) | 1031 (17%) | 460 (14%) |
| High school | 1234 (18%) | 1093 (18%) | 587 (18%) |
| Some college/technical | 1937 (28%) | 1731 (29%) | 981 (30%) |
| College or graduate | 2392 (35%) | 2211 (36%) | 1277 (39%) |
| Income, $10 000* | 40 (21 to 69) | 42 (23 to 51) | 46 (26 to 75) |
| BMI, kg/m2 | 28.3 (5.5) | 28.3 (5.4) | 28.4 (5.3) |
| Systolic blood pressure, mm Hg | 127 (21) | 126 (21) | 124 (20) |
| Diastolic blood pressure, mm Hg | 72 (10) | 72 (10) | 72 (10) |
| Hypertension | 3056 (45%) | 2661 (44%) | 1361 (41%) |
| Antihypertensive medication | 2534 (37%) | 2203 (36%) | 1151 (35%) |
| LDL-C, mg/dL | 117 (31) | 117 (31) | 118 (31) |
| HDL-C, mg/dL | 51 (15) | 51 (15) | 51 (15) |
| Triglycerides, mg/dL | 132 (89) | 131 (86) | 131 (82) |
| Statins | 1009 (15%) | 904 (15%) | 486 (15%) |
| Smoking | |||
| Never | 3234 (47%) | 2879 (47%) | 1590 (48%) |
| Former | 2543 (37%) | 2287 (38%) | 1244 (38%) |
| Current | 1011 (15%) | 883 (15%) | 466 (14%) |
| Second-hand smoke exposure | 2255 (33%) | 2060 (34%) | 1213 (37%) |
| Pack-years of smoking | 11 (21) | 11 (21) | 10 (20) |
| Diabetes | |||
| Not diabetic | 4990 (73%) | 4506 (74%) | 2517 (76%) |
| Impaired fasting glucose | 937 (14%) | 828 (14%) | 444 (13%) |
| Diabetes | 859 (13%) | 714 (12%) | 335 (10%) |
| Family history of premature CVD† | 1676 (27%) | 1597 (27%) | 897 (28%) |
| Fibrinogen, mg/dL | 347 (74) | 345 (73) | 342 (71) |
| C-reactive protein, mg/dL | 3.8 (5.9) | 3.7 (5.6) | 3.5 (5.2) |
| Creatinine, mg/dL | |||
| 1.0 | 1210 (18%) | 1110 (18%) | 607 (18%) |
| ≤0.9 | 3792 (56%) | 3343 (55%) | 1856 (56%) |
| ≥1.1 | 1783 (26%) | 1595 (26%) | 833 (25%) |
Data are shown mean (SD) or count (percentage). BMI indicates body mass index; CAC, coronary artery calcium; CVD, cardiovascular disease; HDL-C, high-density lipoprotein cholesterol; LDL-C, low-density lipoprotein cholesterol.
Median (interquartile range). Averaged across all exams.
CVD in a male parent, child, or sibling before age 55 years or in a female relative before age 65 years. Reported during Exam 2.
The primary results for this analysis are based on minimally adjusted models to show the most direct associations between the risk factors and CAC progression. These are presented in the first column of Table2. Age at exam 1 and sex were both strongly associated with increased CAC progression. Among the racial/ethnic groups, black race was associated with decreased CAC progression compared with white race, whereas CAC progression among participants with Hispanic ethnicity or Chinese ancestry were not significantly different from CAC progression among white participants in the minimally adjusted model. Age, site, and scanner-adjusted progression rates for men and women in each racial ethnic group are provided in Table3.
Table 2.
Associations Between Risk Factors and CAC Progression (Agatston units/year)
| Risk Factor | Minimally Adjusted Difference in Average Annual Progression (95% CI)* | Fully Adjusted Difference in Average Annual Progression (95% CI)† | ||
|---|---|---|---|---|
| Age at Exam 1, 10 years | 14.2 (13.0 to 15.5) | P<0.001 | 11.2 (9.8 to 12.5) | P<0.001 |
| Male sex | 17.8 (15.3 to 20.3) | P<0.001 | 16.4 (13.9 to 18.9) | P<0.001 |
| Race/ethnicity (ref: white) | P =0.074 | P<0.001 | ||
| Chinese | −4.3 (−9.1 to 0.4) | −3.0 (−7.7 to 1.8) | ||
| Black | −3.8 (−7.1 to −0.6) | −12.2 (−15.5 to −8.9) | ||
| Hispanic | −2.7 (−6.6 to 1.1) | −7.5 (−11.2 to −3.7) | ||
| Education (ref: less than high school) | P =0.46 | |||
| High school | −0.5 (−4.8 to 3.9) | |||
| Some college/technical | 0.9 (−3.2 to 5.0) | |||
| College or graduate | −1.7 (−5.9 to 2.5) | |||
| Income, $10 000‡ | −0.4 (−0.8 to 0.0) | P =0.066 | ||
| Body mass index, 5 kg/m2 | 5.1 (3.9 to 6.3) | P<0.001 | 2.6 (1.3 to 3.8) | P<0.001 |
| Systolic blood pressure, 10 mm Hg | 1.9§|| (1.3 to 2.6) | P<0.001 | 0.9 (0.2 to 1.7) | P =0.016 |
| Diastolic blood pressure, 10 mm Hg | 1.7§|| (0.4 to 3.0) | P =0.009 | ||
| Hypertension | 13.8 (11.2 to 16.5) | P<0.001 | 7.5 (4.3 to 10.6) | P<0.001 |
| Antihypertensive medications | 11.2|| (7.5 to 14.8) | P<0.001 | ||
| LDL-C, 10 mg/dL | 0.0¶ (−0.4 to 0.4) | P =0.99 | ||
| HDL-C, 10 mg/dL | −1.8¶ (−2.7 to −0.9) | P<0.001 | ||
| Triglycerides, log mg/dL | 6.0¶ (3.5 to 8.4) | P<0.001 | ||
| Total cholesterol, 10 mg/dL | 0.1¶ (−0.2 to 0.5) | P =0.45 | ||
| Statin use at exam 1 | 12.8 (9.3 to 16.4) | P<0.001 | 6.4 (3.0 to 9.9) | P<0.001 |
| Statin use, time varying# | 3.9 (2.2 to 5.5) | P<0.001 | ||
| Smoking (ref: never) | P<0.001 | P<0.001 | ||
| Former | 4.1 (1.3 to 6.9) | 4.2 (1.5 to 6.9) | ||
| Current | 7.1 (3.1 to 11.1) | 7.8 (3.9 to 11.7) | ||
| 10 pack-years of smoking | 1.2** (0.5 to 2.0) | P<0.001 | ||
| Diabetes (ref: not diabetic) | P<0.001 | P<0.001 | ||
| Impaired fasting glucose | 5.9 (2.2 to 9.5) | 3.4 (−0.2 to 7.1) | ||
| Diabetes | 31.3 (27.4 to 35.3) | 26.5 (22.5 to 30.5) | ||
| Family history of premature CVD†† | 8.0 (5.2 to 10.9) | P<0.001 | 5.5 (2.7 to 8.2) | P<0.001 |
| Neighborhood SES index, IQR | 0.0 (−1.7 to 1.7) | P =0.99 | ||
| Fibrinogen, 100 mg/dL | 5.6 (3.8 to 7.4) | P<0.001 | ||
| C-reactive protein, log mg/dL | 2.1 (0.9 to 3.2) | P<0.001 | ||
| Creatinine (Ref: 1.0 mg/dL) | P =0.82 | |||
| ≤0.9 mg/L | −0.5 (−4.1 to 3.1) | |||
| ≥1.1 mg/dL | −1.2 (−5.1 to 2.6) | |||
All risk factors were measured at exam 1 except as indicated. Mean CAC progression was 23.9 Agatston units/year among all participants. CAC indicates coronary artery calcium; CVD, cardiovascular disease; CT, computed tomography; HDL-C, high-density lipoprotein cholesterol; LDL-C, low-density lipoprotein cholesterol; SES, socioeconomic status.
Minimally adjusted models include age, sex, race/ethnicity, site, and CT scanner type along with the reported term.
Adjustment model determined by backward selection on participants’ slopes as outcome; all terms reported in the table, plus site and CT scanner type were in the model.
Averaged across all exams.
Additionally adjusted for antihypertensive medication use at exam 1.
Additionally adjusted for hypertension status.
Additionally adjusted for statin use.
As reported at each exam.
Additionally adjusted for smoking status.
CVD in a male parent, child, or sibling before age 55 years or in a female relative before age 65 years. Reported during exam 2.
Table 3.
Annual Progression Rates (Agatston units/year) for Men and Women in Each Racial/Ethnic Group
| Female | Male | |
|---|---|---|
| White | 16.9 | 41.2 |
| Chinese | 17.7 | 31.2 |
| Black | 19.5 | 29.9 |
| Hispanic | 17.3 | 35.0 |
Rates are based on a mixed-effects model including interactions between race/ethnicity and sex and are adjusted for age, site, and scanner.
Statin use at exam 1 was associated with increased CAC. Time-varying statin use was less strongly associated with increased CAC. To fully explore the relationship between CAC progression and statin use, we also evaluated statin use categorically (described in “Methods”). CAC progression among participants who were prescribed statins over the course of follow-up was 5.2 Agatston units/year faster than among participants who never took statins (95% CI 3.3 to 7.1). Among those who were taking statins at exam 1, CAC progression was even higher.
Both smoking status and pack-years of smoking were associated with increased CAC progression (Table2). Overall, 401 participants reported never smoking at exam 1 but later reported being former smokers. Using the MESA Lung smoking status classification, 14 of these participants and 70 additional participants were assumed to be current smokers. The remaining 387 participants were considered to be former smokers. This strengthened the association between smoking status and CAC progression for former smokers compared with never smokers (5.3 Agatston units/year [95% CI 2.5 to 8.1]) and had a minimal impact for current smokers compared with never smokers (7.4 Agatston units/year [95% CI 3.5 to 11.3]). Second-hand smoke exposure was not associated with CAC progression (data not shown).
As shown in Table2, we observed associations between CAC progression and many other CVD risk factors and participant characteristics. These included family history of premature CVD, BMI, diabetes, hypertension, blood pressure, triglycerides, and HDL-C. Total cholesterol and LDL-C were not associated with differences in CAC progression. None of the markers of socioeconomic status—income, education, or neighborhood socioeconomic status index—were associated with CAC progression. Elevated C-reactive protein and fibrinogen were associated with increased CAC progression, but creatinine was not.
Results from the fully adjusted model are also presented in Table2. Associations between CAC progression and age at exam 1, sex, BMI, hypertension, statin use, diabetes, and family history of premature CVD were still strong but slightly attenuated. The association between smoking status and CAC progression was similar to the minimally adjusted result. Associations for black race and Hispanic ethnicity were greatly strengthened.
We performed a large number of sensitivity analyses, which are shown in Tables4 and 5. Our results were robust for changes such as participant exclusions and variations in the set of adjustment variables. We controlled for clinical center in all primary analyses because the study design stratified participant recruitment by race/ethnicity and study site; however, site adjustment might not be necessary if the differences were captured by control for other risk factors. We found that site adjustment was not influential for most risk factors but affected associations between race/ethnicity and CAC progression (Table4). Our results were not significantly affected by control for scanner type.
Table 4.
Associations Between Race/Ethnicity and CAC Progression: Sensitivity to Adjustment Model
| Risk Factor | Not Adjusted for Site, Adjusted for Scanner | Adjusted for Site, Not Adjusted for Scanner | Not Adjusted for Site, Not Adjusted for Scanner |
|---|---|---|---|
| Race/ethnicity (ref: white) | P =0.003 | P =0.13 | P =0.010 |
| Chinese | −6.2 (−10.4 to −2.0) | −4.1 (−8.9 to 0.7) | −6.1 (−10.3 to −2.0) |
| Black | −5.1 (−8.2 to −1.9) | −3.3 (−6.6 to −0.1) | −4.0 (−7.1 to −0.9) |
| Hispanic | −2.3 (−5.6 to 1.1) | −2.6 (−6.4 to 1.2) | −2.5 (−5.8 to 0.8) |
Values are differences in annual CAC progression in Agatston units/year. Models included age and sex. Mean CAC progression was 23.9 Agatston units/year among all participants. Other risk factors investigated were not substantially (<20% change) affected by the adjustment models specified. CAC indicates coronary artery calcium.
Table 5.
Associations Between Risk Factors and CAC Progression: Sensitivity to Participant Exclusions
| Risk Factor | Progression >250 Units/Year Excluded (n =6664) | Progression >150 Units/Year Excluded (n =6539) | Complete Covariates (n =5958) | CAC >0 at Exam 1 (n =3395) | ||||
|---|---|---|---|---|---|---|---|---|
| Age at exam 1, 10 years | 11.1 (10.1 to 12.1) | P<0.001 | 8.9 (8.1 to 9.7) | P<0.001 | 13.8 (12.6 to 15.1) | P<0.001 | 12.8 (10.2 to 15.4) | P<0.001 |
| Male sex | 14.1 (12.2 to 16.0) | P<0.001 | 11.0 (9.5 to 12.6) | P<0.001 | 17.0 (14.5 to 19.5) | P<0.001 | 19.5 (14.6 to 24.4) | P<0.001 |
| Race/ethnicity (ref: white) | P =0.003 | P<0.001 | P =0.29 | P =0.70 | ||||
| Chinese | −3.2 (−6.9 to 0.4) | −3.1 (−6.1 to −0.1) | −4.0 (−8.8 to 0.8) | −0.5 (−9.7 to 8.7) | ||||
| Black | −4.6 (−7.1 to −2.1) | −4.4 (−6.5 to −2.4) | −4.7 (−8.0 to −1.4) | 2.9 (−3.5 to 9.4) | ||||
| Hispanic | −2.2 (−5.1 to 0.7) | −1.4 (−3.8 to 1.0) | −2.7 (−6.6 to 1.2) | 3.1 (−4.4 to 10.6) | ||||
| Education (ref: less than high school) | P =0.15 | P =0.15 | P =0.33 | P =0.26 | ||||
| High school | 1.8 (−1.5 to 5.1) | 1.9 (−0.9 to 4.6) | −0.1 (−4.6 to 4.4) | −6.1 (−14.4 to 2.2) | ||||
| Some college/technical | 2.2 (−0.9 to 5.3) | 2.5 (0.0 to 5.1) | 1.8 (−2.4 to 6.0) | −2.1 (−10.0 to 5.9) | ||||
| College or graduate | −0.3 (−3.5 to 2.9) | 0.8 (−1.9 to 3.4) | −1.3 (−5.6 to 3.1) | −6.5 (−14.6 to 1.5) | ||||
| Income, $10 000* | −0.3 (−0.6 to 0.1) | P =0.12 | −0.2 (−0.5 to 0.0) | P =0.11 | −0.4 (−0.8 to 0.1) | P =0.10 | −0.8 (−1.6 to 0.0) | P =0.051 |
| Body mass index, 5 kg/m2 | 3.8 (2.8 to 4.7) | P<0.001 | 3.3 (2.5 to 4.1) | P<0.001 | 5.2 (4.0 to 6.5) | P<0.001 | 8.0 (5.5 to 10.5) | P<0.001 |
| Systolic blood pressure, 10 mm Hg† | 1.6 (1.1 to 2.1) | P<0.001 | 1.2 (0.8 to 1.7) | P<0.001 | 1.9 (1.3 to 2.6) | P<0.001 | 3.1 (1.9 to 4.3) | P<0.001 |
| Diastolic blood pressure, 10 mm Hg† | 2.2 (1.2 to 3.2) | P<0.001 | 1.5 (0.6 to 2.3) | P<0.001 | 1.7 (0.4 to 3.0) | P =0.013 | 3.5 (1.0 to 6.0) | P =0.007 |
| Hypertension | 10.4 (8.4 to 12.5) | P<0.001 | 8.1 (6.4 to 9.8) | P<0.001 | 14.5 (11.8 to 17.2) | P<0.001 | 19.2 (14.2 to 24.2) | P<0.001 |
| Antihypertensive medications‡ | 7.5 (4.8 to 10.3) | P<0.001 | 5.7 (3.4 to 8.0) | P<0.001 | 10.3 (6.7 to 14.0) | P<0.001 | 15.0 (8.5 to 21.4) | P<0.001 |
| LDL-C, 10 mg/dL§ | 0.3 (0.0 to 0.6) | P =0.08 | 0.4 (0.1 to 0.6) | P =0.003 | 0.0 (−0.4 to 0.4) | P =0.92 | −0.7 (−1.5 to 0.1) | P =0.08 |
| HDL-C, 10 mg/dL§ | −1.3 (−2.0 to −0.6) | P<0.001 | −1.3 (−1.9 to −0.7) | P<0.001 | −2.1 (−3.1 to −1.2) | P<0.001 | −2.3 (−4.2 to −0.5) | P =0.01 |
| Triglycerides, log mg/dL§ | 6.2 (4.4 to 8.1) | P<0.001 | 4.9 (3.4 to 6.4) | P<0.001 | 7.1 (4.5 to 9.7) | P<0.001 | 10.4 (5.6 to 15.2) | P<0.001 |
| Total cholesterol, 10 mg/dL§ | 0.4 (0.2 to 0.7) | P =0.002 | 0.4 (0.2 to 0.6) | P<0.001 | 0.0 (−0.3 to 0.4) | P =0.82 | −0.2 (−0.9 to 0.6) | P =0.67 |
| Statin use at exam 1 | 9.0 (6.3 to 11.8) | P<0.001 | 7.3 (5.0 to 9.5) | P<0.001 | 11.1 (7.6 to 14.7) | P<0.001 | 13.2 (7.1 to 19.2) | P<0.001 |
| Statin use, time varying|| | 4.9 (3.6 to 6.3) | P<0.001 | 4.3 (3.2 to 5.5) | P<0.001 | 3.5 (1.8 to 5.2) | P<0.001 | 4.0 (0.7 to 7.3) | P =0.017 |
| Smoking (ref: never) | P<0.001 | P<0.001 | P<0.001 | P =0.20 | ||||
| Former | 4.2 (2.1 to 6.3) | 4.1 (2.3 to 5.8) | 4.9 (2.0 to 7.7) | 3.4 (−2.0 to 8.7) | ||||
| Current | 6.4 (3.3 to 9.4) | 5.6 (3.2 to 8.1) | 7.0 (2.8 to 11.1) | 6.8 (−1.3 to 14.8) | ||||
| 10 pack-years of smoking¶ | 1.3 (0.7 to 1.9) | P<0.001 | 1.8 (1.3 to 2.4) | P<0.001 | 1.3 (0.6 to 2.1) | P<0.001 | 0.5 (−0.7 to 1.8) | P =0.39 |
| Diabetes (ref: not diabetic) | P<0.001 | P<0.001 | P<0.001 | P<0.001 | ||||
| Impaired fasting glucose | 4.3 (1.5 to 7.1) | 3.8 (1.5 to 6.1) | 6.3 (2.6 to 10.0) | 9.8 (3.2 to 16.4) | ||||
| Diabetes | 22.7 (19.6 to 25.7) | 17.9 (15.4 to 20.5) | 31.8 (27.7 to 35.9) | 45.5 (38.7 to 52.4) | ||||
| Family history of CVD# | 7.9 (5.7 to 10.0) | P<0.001 | 6.0 (4.3 to 7.8) | P<0.001 | 7.8 (4.9 to 10.6) | P<0.001 | 10.6 (5.2 to 16.0) | P<0.001 |
| Neighborhood SES index, IQR | 0.0 (−1.3 to 1.2) | P =0.98 | 0.1 (−1.0 to 1.1) | P =0.88 | 0.6 (−1.1 to 2.2) | P =0.50 | −0.1 (−3.3 to 3.1) | P =0.93 |
| Fibrinogen, 100 mg/dL | 4.5 (3.1 to 5.9) | P<0.001 | 3.9 (2.8 to 5.0) | P<0.001 | 5.0 (3.1 to 6.8) | P<0.001 | 6.0 (2.6 to 9.5) | P<0.001 |
| C-reactive protein, log mg/dL | 1.5 (0.7 to 2.4) | P<0.001 | 1.4 (0.7 to 2.1) | P<0.001 | 2.1 (1.0 to 3.3) | P<0.001 | 3.0 (0.8 to 5.3) | P =0.008 |
| Creatinine (ref: 1 mg/dL) | P =0.61 | P =0.84 | P =0.91 | P =0.94 | ||||
| ≤0.9 | −1.2 (−3.9 to 1.5) | −0.6 (−2.8 to 1.7) | 0.3 (−3.4 to 3.9) | −0.6 (−7.3 to 6.1) | ||||
| ≥1.1 | −1.3 (−4.3 to 1.6) | −0.7 (−3.1 to 1.8) | −0.5 (−4.4 to 3.4) | −1.2 (−8.1 to 5.7) | ||||
Values are differences in annual CAC progression in Agatston units/year. Models included age, sex, race/ethnicity, site, and scanner type. All risk factors were measured at exam 1 except as indicated. Mean CAC progression was 23.9 Agatston units/year among all participants. CAC indicates coronary artery calcium; CVD, cardiovascular disease; HDL-C, high-density lipoprotein cholesterol; LDL-C, low-density lipoprotein cholesterol; SES, socioeconomic status.
Averaged across all exams.
Additionally adjusted for antihypertensive medication use at baseline.
Additionally adjusted for hypertension status.
Additionally adjusted for statin use.
As reported at each exam.
Additionally adjusted for smoking status.
CVD in a male parent, child, or sibling before age 55 years or in a female relative before age 65 years. Reported during exam 2.
Other sensitivity analyses excluded participants with greater CAC progression to better understand their influence on the results. Their exclusion generally reduced magnitudes of association but also reduced standard errors. Consequently, most relationships observed in the full data set persisted, but estimates were reduced by ≈25% among participants with CAC progression <250 Agatston units/year (Table5) or by about 40% among participants with CAC progression <150 Agatston units/year. Excluding participants with CAC below the scanner’s threshold (0 Agatston units) at baseline, estimates were generally 20% to 50% more extreme. Different relationships among the racial/ethnic groups were observed in this subset than in the cohort overall, and that may be related to a preferential exclusion of nonwhite participants. Specifically, CAC progression was not significantly different by race among participants with measureable CAC at baseline.
Results from the analysis of annual change between exams 1 and 5 are presented in Table6. These results are highly consistent with results obtained from a mixed-effects model analysis of the same subset of participants that attended exams 1 and 5, although many of the estimates are somewhat lower than those in the analysis of the whole cohort.
Table 6.
Comparison to Analysis Change Between Exams 1 and 5
| Annual Change, Exam 1 to 5* | Mixed-effects Model, Participants Attending Exam 5† | |||
|---|---|---|---|---|
| Age at Exam 1, 10 years | 9.8 (8.5 to 11.1) | P<0.001 | 10.4 (9.1 to 11.7) | P<0.001 |
| Male sex | 12.4 (10.0 to 14.8) | P<0.001 | 13.6 (11.2 to 16.1) | P<0.001 |
| Race/ethnicity (ref: white) | P =0.26 | P =0.13 | ||
| Chinese | −0.3 (−4.9 to 4.3) | −0.9 (−5.5 to 3.8) | ||
| Black | −2.3 (−5.6 to 1.0) | −3.0 (−6.2 to 0.2) | ||
| Hispanic | −1.2 (−4.9 to 2.4) | −1.5 (−5.2 to 2.3) | ||
| Education (ref: less than high school) | P =0.26 | P =0.12 | ||
| High school | 3.1 (−1.4 to 7.6) | 3.8 (−0.7 to 8.3) | ||
| Some college/technical | 3.3 (−0.9 to 7.5) | 2.9 (−1.4 to 7.1) | ||
| College or graduate | 0.0 (−4.3 to 4.3) | 0.3 (−4.0 to 4.6) | ||
| Income, $10 000‡ | −0.2 (−0.7 to 0.2) | P =0.24 | −0.3 (−0.7 to 0.1) | P =0.13 |
| Body mass index, 5 kg/m2 | 3.8 (2.5 to 5.0) | P<0.001 | 4.3 (3.1 to 5.5) | P<0.001 |
| Systolic blood pressure, 10 mm Hg§ | 1.9 (1.2 to 2.5) | P<0.001 | 1.9 (1.3 to 2.6) | P<0.001 |
| Diastolic blood pressure, 10 mm Hg§ | 2.1 (0.8 to 3.4) | P<0.001 | 2.1 (0.8 to 3.4) | P =0.002 |
| Hypertension | 10.5 (7.9 to 13.1) | P<0.001 | 11.5 (8.9 to 14.1) | P<0.001 |
| Antihypertensive medications|| | 9.5 (5.9 to 13.2) | P<0.001 | 9.8 (6.2 to 13.5) | P<0.001 |
| LDL-C, 10 mg/dL¶ | 0.0 (−0.4 to 0.4) | P =0.92 | 0.1 (−0.3 to 0.5) | P =0.50 |
| HDL-C, 10 mg/dL¶ | −1.4 (−2.3 to −0.5) | P<0.001 | −1.7 (−2.7 to −0.8) | P<0.001 |
| Triglycerides, log mg/dL¶ | 5.4 (3.0 to 7.8) | P<0.001 | 6.5 (4.0 to 8.9) | P<0.001 |
| Total cholesterol, 10 mg/dL¶ | 0.1 (−0.2 to 0.5) | P =0.06 | 0.2 (−0.1 to 0.6) | P =0.18 |
| Statin use at exam 1 | 8.7 (5.2 to 12.2) | P<0.001 | 8.6 (5.1 to 12.1) | P<0.001 |
| Statin use, time varying# | — | — | 4.5 (2.8 to 6.3) | P<0.001 |
| Smoking (ref: never) | P<0.001 | P =0.007 | ||
| Former | 3.5 (0.8 to 6.2) | 3.6 (0.8 to 6.3) | ||
| Current | 4.4 (0.5 to 8.4) | 4.8 (0.8 to 8.8) | ||
| 10 pack-years of smoking** | 1.5 (0.7 to 2.2) | P<0.001 | 1.3 (0.6 to 2.1) | P<0.001 |
| Diabetes (ref: not diabetic) | P<0.001 | P<0.001 | ||
| Impaired fasting glucose | 3.3 (−0.2 to 6.8) | 3.7 (0.1 to 7.2) | ||
| Diabetes | 26.0 (21.9 to 30.1) | 27.6 (23.5 to 31.6) | ||
| Family history of CVD†† | 4.8 (2.1 to 7.5) | P =0.007 | 4.9 (2.2 to 7.6) | P<0.001 |
| Neighborhood SES index, IQR | −0.1 (−1.7 to 1.5) | P =0.27 | 0.1 (−1.5 to 1.7) | P =0.87 |
| Fibrinogen, 100 mg/dL | 3.8 (2.0 to 5.6) | P<0.001 | 4.7 (2.9 to 6.5) | P<0.001 |
| C-reactive protein, log mg/dL | 0.3 (0.1 to 0.6) | P =0.003 | 0.4 (0.2 to 0.6) | P<0.001 |
| Creatinine (ref: 1 mg/dL) | P =0.82 | P =0.48 | ||
| ≤0.9 | −0.8 (−4.3 to 2.7) | −1.5 (−5.0 to 2.0) | ||
| ≥1.1 | −1.2 (−4.9 to 2.6) | −0.8 (−4.6 to 3.0) | ||
Results from the primary analysis are repeated in this table for easy comparison (left) alongside the results from multiple linear regression of risk factors on the annual change between exams 1 and 5 (center). Results from mixed-effects models restricted to the subset of participants with measurements at both exams 1 and 5 are also presented (right). CVD indicates cardiovascular disease; CT, computed tomography; HDL-C, high-density lipoprotein cholesterol; LDL-C, low-density lipoprotein cholesterol; SES, socioeconomic status.
Annual change =(exam 5−exam 1)/(time in years). Results are adjusted for the CT scanner model used at exams 1 and 5 and for the interaction between the 2 scanner types.
Includes observations intermediate between exam 1 and exam 5.
Averaged across all exams.
Additionally adjusted for antihypertensive medication use at baseline.
Additionally adjusted for hypertension status.
Additionally adjusted for statin use.
As reported at each exam.
Additionally adjusted for smoking status.
CVD in a male parent, child, or sibling before age 55 years or in a female relative before age 65 years. Reported during exam 2.
Discussion
We found strong relationships between known risk factors for CVD and progression of CAC over a 10-year period in a large multiethnic population. We adopted an innovative approach to statistical modeling to fully incorporate all data available from >6000 subjects, regardless of their baseline CAC levels and numbers of available scans. Our findings were robust for a range of different data exclusions, refinements to the outcome, and modeling details. These results do not inform us about the prognoses for specific participants but rather provide a framework that can be used to describe and evaluate the importance of population-level characteristics, interventions, and potential risk factors for atherosclerosis. These advanced methods have expanded our understanding of the progression of subclinical atherosclerosis, as measured by coronary artery calcification.
The associations that we observed between CAC progression and risk factors were consistent with those of Kronmal et al for BMI, family history of CVD, triglycerides, systolic blood pressure, and pack-years of smoking.6 Also consistent with that study was an observed lack of association between CAC progression and LDL-C, education, or creatinine. That study observed stronger associations between CAC progression and race/ethnicity. Evidence from sensitivity analyses indicates that this discrepancy is attributable primarily to adjustment for site in our study. In both studies, race/ethnicity was more strongly related to CAC progression in more fully adjusted models, suggesting confounding between race/ethnicity and risk factors such as smoking and BMI. This is further suggested by the lack of robustness in the associations observed between race/ethnicity and CAC progression in our sensitivity analyses (Tables4 and 5). The fact that race/ethnicity is more strongly associated with CAC progression in some subsets of participants warrants further research.
We observed higher magnitudes of association in CAC progression for age, sex, cigarette smoking status, HDL-C, diabetes, antihypertensive medications, and statin use at exam 1 compared with Kronmal et al.6 Because atherosclerosis is a gradual process, a longer follow-up time presumably enables more accurate estimation of the progression rate. Other prior studies with shorter follow-up observed associations between CAC progression and white race,22 hypertension,22 diabetes,22 fibrinogen,23 HDL-C,24 and smoking.6,25 It is difficult to make meaningful comparisons among these studies due to differences in the study populations or transformations of the outcome; however, we found that our results were consistent with these studies in direction of association.
Our findings regarding statin use in this cohort are mixed, likely reflecting the current practice of prescribing statins for those with multiple existing CVD risk factors and for those with evidence of atherosclerosis. Additionally, statins likely mitigate progression of atherosclerosis primarily in noncalcified lesions. These features would have complex effects on the speed of CAC progression. Others have also observed uneven impact of lipid-lowering medications on CAC progression.3,24,26–30 Some prior studies have suggested that statin use does not affect CAC progression,26,27,31,32 although these studies were limited by relatively small sample sizes and/or short follow-up times. In MESA, evidence from early examinations indicated that participants on statins had increased CAC progression compared with those not on statins, presumably because they were already at higher risk.4,6 In our study, statin use at exam 1 was strongly associated with subsequent CAC progression, supporting the explanation that the high-risk group was those who had already been prescribed statins in the years 2000–2002. The association with time-varying statin use over the subsequent 10 years, when statin use became much more prevalent, was less strong.
At least 1 study suggested that statin therapy could increase the density of calcification by removing the lipids from calcified plaques.33 This “defatting” process would thereby increase pixel brightness and could inflate Agatston CAC scores disproportionately relative to the amount of plaque present. This implies that statins could prevent the deposition of new CAC while still increasing the Agatston score. If this were true, we might expect to observe that those prescribed statins during the course of follow-up would have the highest CAC progression because, presumably, much of this change in plaque architecture would have occurred prior to scanning among the participants that were already on statins at exam 1. Instead, we observed that CAC progression was fastest among participants using statins at exam 1. This would suggest that statins promote coronary atheroma calcification, even though they are known to regress plaque extent; statins might help stabilize plaques by increasing the density of calcium. A recent evaluation of 3495 participants imaged with intravascular ultrasound in clinical trials indicated that high-intensity statin therapy was associated with increases in coronary atheroma calcification independent of the plaque-regressive effects.34 The attenuation of the association between statin use and CAC progression in the fully adjusted model suggests some residual confounding. Whatever mechanism is responsible for the observed association between CAC progression and statin use would also induce a lack of association with LDL-C.
Because participants were advised of their CAC scores, it raises the prospect that this information led to changes in risk factors and treatments, which in turn affects subsequent progression rates. In fact, prior investigators9 found that higher CAC scores at baseline in MESA were associated with increased initiation of lipid-lowering agents. The use of these agents and other preventive therapies during the period of follow-up (as at baseline) is subject to “confounding by indication”35 because CAC at baseline is associated with subsequent progression. This may make it difficult to interpret the use of these agents in the progression model and to interpret the measures that are strongly affected by these treatments such as total cholesterol and LDL-C. Because our model adjusts fully, in a time-varying manner, for the use of lipid-lowering agents, the interpretation of factors not directly related to these therapies—which are the focus of this paper—should not be confounded.
A limitation of this study is the potential for selection bias. Although participants with no follow-up contribute to our analysis in the cross-sectional exam 1 characterization, they do not directly contribute to the estimation of the progression rate. Participants who had no follow-up, particularly those who died or became too sick to continue the study between exams 1 and 2, may differ from those with follow-up measurements; however, the overall retention rate was high, and the mixed-effects model approach allows the analysis to be adjusted for variables related to health status. Consequently, we expected the impact of selection bias on these results to be minimal.
CAC data are well known to be highly skewed, which makes individual-level modeling difficult. The parameter that we investigated in this study, a mean summarizing a skewed distribution of progression, describes population-level atherosclerotic burden. It is necessarily true that the estimate of the coefficient relevant to this parameter is highly influenced by the relative number of participants with high progression rates and by the magnitude of those rates. Studies that use this method of assessing subclinical atherosclerotic progression will need to examine the relative magnitudes of progression of traditional risk factors to create the appropriate context for results for novel risk factors.
The fact that these results are consistent with those of Kronmal et al despite the inclusion of a large number of participants with no CAC at baseline lends credence to the idea that CAC progression modeled as a single process is informative. This result is important because no concise summary could be generated from separately modeled time to progression and progression rate, as would be necessary for data that are unbalanced in time.
We noted that results from the mixed-effects model were also consistent with the results obtained from a simple change analysis. Because both methods should lead to valid conclusions, we would expect these results to be similar. There are 2 main drawbacks to the change analysis: (1) No time-varying information can be included, and (2) the analysis must be restricted to a more selected subset of participants than the mixed-effects model analysis. These 2 facts mean that simple adjustment is less accurate (due to less control of scanner and other time-varying effects), and the results are less generalizable than those derived from the full mixed-effects model analysis.
The major strengths of this analysis include the substantial follow-up time, the well-characterized prospective cohort, and our application of mixed-effects models to this question. Baseline CAC and CAC progression rate are associated, but control for measured baseline can lead to bias.19,20 The linear mixed-effects model effectively controls for the baseline CAC and permits an unbiased understanding of both cross-sectional and longitudinal relationships between risk factors and CAC. It also allows us to appropriately account for repeated measures and variable follow-up times. Including 3 or 4 measurements for more than half the cohort permits more accurate estimation of uncertainty compared with study designs that include only 2 measurements per participant. Finally, by not using a logarithmically transformed CAC score in our analysis, as others have used,28,30 we did not give extra weight to the lower CAC scores, which convey less information about the quantity of interest and may be subject to more impact of transitions in scanner technology. We examined the associations among the lower calcium scores in a sensitivity analysis by calculating spatially weighted calcium scores36 for participants with an Agatston score of 0, but the results were essentially identical to those obtained using the Agatston score alone.
Conclusions
Coronary artery calcification by CT scan is a useful and noninvasive measure of the extent of atherosclerosis. This study examined a comprehensive set of risk factors for CAC progression over a long period of follow-up in a well-studied population that was selected to be free of clinical CVD at baseline. Our analysis used an innovative application to the study of CVD epidemiology. It relied on a statistical approach for progression analysis that is both less prone to bias and more flexible than other methods used previously to study atherosclerosis progression. The mixed-effects model method can also be applied to evaluating novel risk factors. We found that CAC progression over 10 years was strongly associated with most CVD risk factors, confirming that risk factors for clinical coronary disease and the progression of CAC are overlapping.
Sources of Funding
This research was supported by contracts N01-HC-95159, N01-HC-95160, N01-HC-95161, N01-HC-95162, N01-HC-95163, N01-HC-95164, N01-HC-95165, N01-HC-95166, N01-HC-95167, N01-HC-95168 and N01-HC-95169, and grants R01 HL-077612 and HL-075476 from the National Heart, Lung, and Blood Institute, by grants UL1-RR-024156 and UL1-RR-025005 from the National Center for Research Resources (NCRR), and by grant K24ES013195 from the National Institute of Environmental Health Sciences. The authors thank the other investigators, the staff, and the participants of the MESA study for their valuable contributions. A full list of participating MESA investigators and institutions can be found at http://www.mesa-nhlbi.org. This publication was developed under a STAR research assistance agreement, No. RD831697 (MESA Air), awarded by the U.S Environmental Protection Agency. It has not been formally reviewed by the EPA. The views expressed in this document are solely those of the authors and the EPA does not endorse any products or commercial services mentioned in this publication.
Disclosures
None.
References
- Raggi P, Callister TQ, Shaw LJ. Progression of coronary artery calcium and risk of first myocardial infarction in patients receiving cholesterol-lowering therapy. Arterioscler Thromb Vasc Biol. 2004;24:1272–1277. doi: 10.1161/01.ATV.0000127024.40516.ef. [DOI] [PubMed] [Google Scholar]
- Budoff MJ, Hokanson JE, Nasir K, Shaw LJ, Kinney GL, Chow D, Demoss D, Nuguri V, Nabavi V, Ratakonda R, Berman DS, Raggi P. Progression of coronary artery calcium predicts all-cause mortality. JACC Cardiovasc Imaging. 2010;3:1229–1236. doi: 10.1016/j.jcmg.2010.08.018. [DOI] [PubMed] [Google Scholar]
- Budoff MJ, Raggi P. Coronary artery disease progression assessed by electron-beam computed tomography. Am J Cardiol. 2001;88:46E–50E. doi: 10.1016/s0002-9149(01)01767-2. [DOI] [PubMed] [Google Scholar]
- Budoff MJ, Young R, Lopez VA, Kronmal RA, Nasir K, Blumenthal RS, Detrano RC, Bild DE, Guerci AD, Liu K, Shea S, Szklo M, Post W, Lima J, Bertoni A, Wong ND. Progression of coronary calcium and incident coronary heart disease events: the Multi-Ethnic Study of Atherosclerosis. J Am Coll Cardiol. 2013;61:1231–1239. doi: 10.1016/j.jacc.2012.12.035. [DOI] [PMC free article] [PubMed] [Google Scholar]
- McEvoy JW, Blaha MJ, DeFilippis AP, Budoff MJ, Nasir K, Blumenthal RS, Jones SR. Coronary artery calcium progression: an important clinical measurement? A review of published reports. J Am Coll Cardiol. 2010;56:1613–1622. doi: 10.1016/j.jacc.2010.06.038. [DOI] [PubMed] [Google Scholar]
- Kronmal RA, McClelland RL, Detrano R, Shea S, Lima JA, Cushman M, Bild DE, Burke GL. Risk factors for the progression of coronary artery calcification in asymptomatic subjects: results from the Multi-Ethnic Study of Atherosclerosis (MESA) Circulation. 2007;115:2722–2730. doi: 10.1161/CIRCULATIONAHA.106.674143. [DOI] [PubMed] [Google Scholar]
- Bild DE, Bluemke DA, Burke GL, Detrano R, Diez Roux AV, Folsom AR, Greenland P, Jacob DR, Kronmal R, Liu K, Nelson JC, O’Leary D, Saad MF, Shea S, Szklo M, Tracy RP. Multi-Ethnic Study of Atherosclerosis: objectives and design. Am J Epidemiol. 2002;156:871–881. doi: 10.1093/aje/kwf113. [DOI] [PubMed] [Google Scholar]
- Carr JJ, Nelson JC, Wong ND, McNitt-Gray M, Arad Y, Jacobs DR, Sidney S, Bild DE, Williams OD, Detrano RC. Calcified coronary artery plaque measurement with cardiac CT in population-based studies: standardized protocol of Multi-Ethnic Study of Atherosclerosis (MESA) and Coronary Artery Risk Development in Young Adults (CARDIA) study. Radiology. 2005;234:35–43. doi: 10.1148/radiol.2341040439. [DOI] [PubMed] [Google Scholar]
- Nasir K, McClelland RL, Blumenthal RS, Goff DC, Hoffmann U, Psaty BM, Greenland P, Kronmal RA, Budoff MJ. Coronary artery calcium in relation to initiation and continuation of cardiovascular preventive medications: the Multi-Ethnic Study of Atherosclerosis (MESA) Circ Cardiovasc Qual Outcomes. 2010;3:228–235. doi: 10.1161/CIRCOUTCOMES.109.893396. [DOI] [PMC free article] [PubMed] [Google Scholar]
- Greenland P. Coronary artery calcium score combined with Framingham score for risk prediction in asymptomatic individuals. JAMA. 2004;291:210–215. doi: 10.1001/jama.291.2.210. [DOI] [PubMed] [Google Scholar]
- Detrano R, Guerci AD, Carr JJ, Bild DE, Burke G, Folsom AR, Liu K, Shea S, Szklo M, Bluemke DA, O’Leary DH, Tracy R, Watson K, Wong ND, Kronmal RA. Coronary calcium as a predictor of coronary events in four racial or ethnic groups. N Engl J Med. 2008;358:1336–1345. doi: 10.1056/NEJMoa072100. [DOI] [PubMed] [Google Scholar]
- O’Malley PG, Taylor AJ, Jackson JL, Doherty TM, Detrano RC. Prognostic value of coronary electron-beam computed tomography for coronary heart disease events in asymptomatic populations. Am J Cardiol. 2000;85:945–948. doi: 10.1016/s0002-9149(99)00906-6. [DOI] [PubMed] [Google Scholar]
- Kondos GT, Hoff JA, Sevrukov A, Daviglus ML, Garside DB, Devries SS, Chomka EV, Liu K. Electron-beam tomography coronary artery calcium and cardiac events: a 37-month follow-up of 5635 initially asymptomatic low- to intermediate-risk adults. Circulation. 2003;107:2571–2576. doi: 10.1161/01.CIR.0000068341.61180.55. [DOI] [PubMed] [Google Scholar]
- Budoff MJ, Nasir K, McClelland RL, Detrano R, Wong N, Blumenthal RS, Kondos G, Kronmal RA. Coronary calcium predicts events better with absolute calcium scores than age-sex-race/ethnicity percentiles mesa (Multi-Ethnic Study of Atherosclerosis) J Am Coll Cardiol. 2009;53:345–352. doi: 10.1016/j.jacc.2008.07.072. [DOI] [PMC free article] [PubMed] [Google Scholar]
- Leening MJG, Elias-Smale SE, Kavousi M, Felix JF, Deckers JW, Vliegenthart R, Oudkerk M, Hofman A, Steyerberg EW, Stricker BHC, Witteman JCM. Coronary calcification and the risk of heart failure in the elderly the Rotterdam Study. JACC Cardiovasc Imaging. 2012;5:874–880. doi: 10.1016/j.jcmg.2012.03.016. [DOI] [PubMed] [Google Scholar]
- Agatston AS, Janowitz WR, Hildner FJ, Zusmer NR, Viamonte M, Detrano R. Quantification of coronary artery calcium using ultrafast computed tomography. J Am Coll Cardiol. 1990;15:827–832. doi: 10.1016/0735-1097(90)90282-t. [DOI] [PubMed] [Google Scholar]
- Moore K, Diez Roux AV, Auchincloss A, Evenson KR, Kaufman J, Mujahid M, Williams K. Home and work neighbourhood environments in relation to body mass index: the Multi-Ethnic Study of Atherosclerosis (MESA) J Epidemiol Community Health. 2013;67:846–853. doi: 10.1136/jech-2013-202682. [DOI] [PMC free article] [PubMed] [Google Scholar]
- Rodriguez J, Jiang R, Johnson WC, MacKenzie BA, Smith LJ, Barr RG. The association of pipe and cigar use with cotinine levels, lung function, and airflow obstruction: a cross-sectional study. Ann Intern Med. 2010;152:201–210. doi: 10.1059/0003-4819-152-4-201002160-00004. [DOI] [PMC free article] [PubMed] [Google Scholar]
- Yanez ND, Kronmal RA, Shemanski LR. The effects of measurement error in response variables and tests of association of explanatory variables in change models. Stat Med. 1998;17:2597–2606. doi: 10.1002/(sici)1097-0258(19981130)17:22<2597::aid-sim940>3.0.co;2-g. [DOI] [PubMed] [Google Scholar]
- Yanez ND, Kronmal RA, Shemanski LR, Psaty BM Cardiovascular Hlth S. A regression model for longitudinal change in the presence of measurement error. Ann Epidemiol. 2002;12:34–38. doi: 10.1016/s1047-2797(01)00280-0. [DOI] [PubMed] [Google Scholar]
- Team RDC. R: A Language and Environment for Statistical Computing. R Foundation for Statistical Computing: Vienna, Austria; 2011. . Available at: http://www.R-project.org. Accessed August 04, 2015. [Google Scholar]
- Lee KK, Fortmann SP, Fair JM, Iribarren C, Rubin GD, Varady A, Go AS, Quertermous T, Hlatky MA. Insulin resistance independently predicts the progression of coronary artery calcification. Am Heart J. 2009;157:939–945. doi: 10.1016/j.ahj.2009.02.006. [DOI] [PubMed] [Google Scholar]
- Rodrigues TC, Snell-Bergeon JK, Maahs DM, Kinney GL, Rewers M. Higher fibrinogen levels predict progression of coronary artery calcification in adults with type 1 diabetes. Atherosclerosis. 2010;210:671–673. doi: 10.1016/j.atherosclerosis.2009.12.034. [DOI] [PMC free article] [PubMed] [Google Scholar]
- Wong ND, Kawakubo M, LaBree L, Azen SP, Xiang M, Detrano R. Relation of coronary calcium progression and control of lipids according to national cholesterol education program guidelines. Am J Cardiol. 2004;94:431–436. doi: 10.1016/j.amjcard.2004.05.003. [DOI] [PubMed] [Google Scholar]
- Koulaouzidis G, Charisopoulou D, Maffrett S, Tighe M, Jenkins PJ, McArthur T. Progression of coronary artery calcification in asymptomatic individuals with pre-existing calcium score. Int Angiol. 2013;32:327–331. [PubMed] [Google Scholar]
- Henein MY, Owen A. Statins moderate coronary stenoses but not coronary calcification: results from meta-analyses. Int J Cardiol. 2011;153:31–35. doi: 10.1016/j.ijcard.2010.08.031. [DOI] [PubMed] [Google Scholar]
- McCullough PA, Chinnaiyan KM. Annual progression of coronary calcification in trials of preventive therapies: a systematic review. Arch Intern Med. 2009;169:2064–2070. doi: 10.1001/archinternmed.2009.382. [DOI] [PubMed] [Google Scholar]
- Houslay ES, Cowell SJ, Prescott RJ, Reid J, Burton J, Northridge DB, Boon NA, Newby DE Scottish Aortic Stenosis and Lipid Lowering Therapy IpoRtI. Progressive coronary calcification despite intensive lipid-lowering treatment: a randomised controlled trial. Heart. 2006;92:1207–1212. doi: 10.1136/hrt.2005.080929. [DOI] [PMC free article] [PubMed] [Google Scholar]
- Budoff MJ, Yu D, Nasir K, Mehrotra R, Chen L, Takasu J, Agrawal N, Liu ST, Blumenthal RS. Diabetes and progression of coronary calcium under the influence of statin therapy. Am Heart J. 2005;149:695–700. doi: 10.1016/j.ahj.2004.07.034. [DOI] [PubMed] [Google Scholar]
- Terry JG, Carr JJ, Kouba EO, Davis DH, Menon L, Bender K, Chandler ET, Morgan T, Crouse JR. Effect of simvastatin (80 mg) on coronary and abdominal aortic arterial calcium (from the coronary artery calcification treatment with zocor [CATZ] study) Am J Cardiol. 2007;99:1714–1717. doi: 10.1016/j.amjcard.2007.01.060. [DOI] [PubMed] [Google Scholar]
- Arad Y, Spadaro LA, Roth M, Newstein D, Guerci AD. Treatment of asymptomatic adults with elevated coronary calcium scores with atorvastatin, vitamin C, and vitamin E: the St. Francis Heart Study randomized clinical trial. J Am Coll Cardiol. 2005;46:166–172. doi: 10.1016/j.jacc.2005.02.089. [DOI] [PubMed] [Google Scholar]
- Raggi P, Davidson M, Callister TQ, Welty FK, Bachmann GA, Hecht H, Rumberger JA. Aggressive versus moderate lipid-lowering therapy in hypercholesterolemic postmenopausal women: beyond endorsed lipid lowering with EBT scanning (BELLES) Circulation. 2005;112:563–571. doi: 10.1161/CIRCULATIONAHA.104.512681. [DOI] [PubMed] [Google Scholar]
- Criqui MH, Denenberg JO, Ix JH, McClelland RL, Wassel CL, Rifkin DE, Carr JJ, Budoff MJ, Allison MA. Calcium density of coronary artery plaque and risk of incident cardiovascular events. JAMA. 2014;311:271–278. doi: 10.1001/jama.2013.282535. [DOI] [PMC free article] [PubMed] [Google Scholar]
- Puri R, Nicholls SJ, Shao M, Kataoka Y, Uno K, Kapadia SR, Tuzcu EM, Nissen SE. Impact of statins on serial coronary calcification during atheroma progression and regression. J Am Coll Cardiol. 2015;65:1273–1282. doi: 10.1016/j.jacc.2015.01.036. [DOI] [PubMed] [Google Scholar]
- Salas M, Hotman A, Stricker BH. Confounding by indication: an example of variation in the use of epidemiologic terminology. Am J Epidemiol. 1999;149:981–983. doi: 10.1093/oxfordjournals.aje.a009758. [DOI] [PubMed] [Google Scholar]
- Liang CJ, Budoff MJ, Kaufman JD, Kronmal RA, Brown ER. An alternative method for quantifying coronary artery calcification: the Multi-Ethnic Study of Atherosclerosis (MESA) BMC Med Imaging. 2012;12:14. doi: 10.1186/1471-2342-12-14. [DOI] [PMC free article] [PubMed] [Google Scholar]