

Abstract
Background
Well-defined inflammation, proliferation, and maturation phases orchestrate the remodeling of the injured myocardium after myocardial infarction (MI) by controlling the formation of new extracellular matrix. The extracellular matrix consists mainly of collagen but also fractions of elastin. It is thought that elastin is responsible for maintaining elastic properties of the myocardium, thus reducing the risk of premature rupture. An elastin/tropoelastin–specific contrast agent (Gd-ESMA) was used to image tropoelastin and mature elastin fibers for in vivo assessment of extracellular matrix remodeling post-MI.
Methods and Results
Gd-ESMA enhancement was studied in a mouse model of myocardial infarction using a 7 T MRI scanner and results were compared to those achieved after injection of a nonspecific control contrast agent, gadolinium-diethylenetriamine pentaacetic acid (Gd-DTPA). In the infarcted tissue, Gd-ESMA uptake (measured as R1 relaxation rate) steadily increased from day 3 to day 21 as a result of the synthesis of elastin/tropoelastin. R1 values were in good agreement with histological findings. A similar R1 behavior was observed in the remote myocardium. No mature cross-linked elastin was found at any time point. In contrast, Gd-DTPA uptake was only observed in the infarct with no changes in R1 values between 3 and 21 days post-MI.
Conclusions
We demonstrate the feasibility of in vivo imaging of extracellular matrix remodeling post-MI using a tropoelastin/elastin binding MR contrast agent, Gd-ESMA. We found that tropoelastin is the main contributor to the increased MRI signal at late stages of MI where its augmentation in areas of infarction was in good agreement with the R1 increase.
Keywords: elastin, imaging agent, infarct remodeling, magnetic resonance imaging
The pathophysiological and molecular mechanisms of cardiac remodeling after myocardial infarction (MI) have been intensely studied with immunohistochemistry, flow cytometry,1,2 and noninvasive imaging techniques such as echocardiography,3 intravital microscopy,4 and magnetic resonance imaging (MRI).5 These studies collectively reported a degradation of the extracellular matrix (ECM) and the formation of a collagen-rich scar, mainly composed of collagen type I6,7 but also some elastin/tropoelastin deposition.8 The elastin protein is believed to play an important role in infarcted regions to preserve elasticity of the infarcted heart,9–12 although it is generally accepted that the elasticity of the myocardium depends on the ratio of muscle fibers to fibrotic tissue and the density of cross-linked collagen.13,14 Elastin deposition begins with the synthesis and secretion of the soluble precursor tropoelastin that becomes cross-linked into insoluble elastin by enzymatic reaction. Under normal conditions, cross-linked elastin is the only form of the molecule present in the myocardium, whereas tropoelastin is absent. Conversely, under pathological conditions elastin/tropoelastin proteins are believed to increase in the infarcted myocardium from early to late stages of MI.15
Recent studies suggest that elastin formation after MI leads to improved ejection fraction and decreased risk of myocardial rupture16 and thus may lend itself as a promising imaging biomarker. Cardiac magnetic resonance imaging (CMRI) can efficiently differentiate soft tissues and, in concert with contrast agents, characterize the myocardium to assess ischemia, scar, and diffuse remodeling.17–19 Nontargeted and targeted contrast agents in combination with advanced mapping techniques are increasingly being used to perform myocardial tissue characterization7 and to monitor treatments.20 An elastin-specific MR contrast agent, Gd-ESMA, has been recently introduced to investigate elastin remodeling in cardiovascular diseases.21 In this study, Gd-ESMA was used for imaging of postinfarction remodeling. No quantitative MR-based assessment of ECM remodeling has previously been performed, although several studies15,21,22 have been performed in models of atherosclerosis, vascular injury, and aortic aneurysm at 1.5 and 3 T for the monitoring of disease progression and therapy response.
In this work, we sought to investigate the merits of the elastin/tropoelastin-specific MR contrast agent, Gd-ESMA, for the assessment of ECM remodeling at 3, 7, and 21 days postinjury in a mouse model of MI at 7 T. A late gadolinium enhancement (LGE) CMRI image technique was employed for visualization and quantification of infarct size, while a T1 mapping technique was used for quantification of T1 values in order to assess de novo ECM formation. Enhancement in infarcted and remote areas after Gd-ESMA injection was compared to that observed after injection of a nonspecific control contrast agent, Gd-DTPA (Magnevist). Although Gd-DTPA is routinely used in preclinical and clinical settings to assess myocardial scar extension and the extracellular volume, it provides little information on ECM composition and structure or its tissue properties. By contrast, Gd-ESMA is a targeted probe primarily designed to localize and quantify the elastin/tropoelastin proteins of the ECM.
Methods
The experimental design is shown in a schematic diagram in Figure 1. The methodological details are reported in the following sections.
Figure 1.
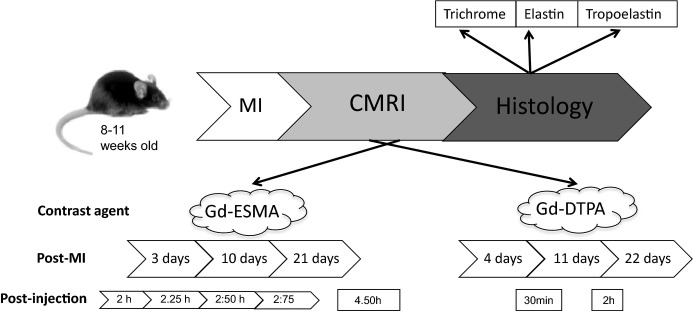
Experimental design. C57Bl6 female mice underwent MI. Six animals underwent serial MRI from early to late stage of MI and were culled for histology at day 22. Three additional MI animals were sacrificed for histology at day 4 and at day 11, respectively. Scans were performed after injection of Gd-ESMA and Gd-DTPA for several postinjection time points. Gd-ESMA was engaged to study synthesis of elastin/tropoelastin targeted compound in infarcted and remote myocardial tissue at 7 T in a high field magnet. Gd-DTPA was also used as a control agent to accurately demarcate the infarcted area. CMRI indicates cardiac MRI; Gd-DTPA, gadolinium-diethylenetriamine pentacetate; Gd-ESMA, elastin/tropoelastin specific contrast agent; MI, myocardial infarction; MRI, magnetic resonance imaging.
Animal Model
A model of left coronary artery permanent ligation was used in this work to induce MI. All procedures used in these studies were performed in accordance with institutional guidelines, following the European Communities Council Directive 2010/63/EU on the protection of animals used for scientific purposes, and UK Home Office legislation (The Animals [Scientific Procedures] Act 1986). All efforts were made to minimize animal suffering and to reduce the number of animals used. Female C57Bl6 mice (Harlan Laboratories, Blackthorn, United Kingdom) weighing 18 to 24 g were anesthetized with 1.5% isoflurane and a mix of O2/medical air at a flow rate of 2 L/min. Animals that underwent endotracheal intubation were ventilated using a dedicated small-animal ventilator (Hugo Sacks Elektronic, Germany). A lateral thoracotomy was made, chest wall muscles were incised and reflected, and the thorax opened in the fourth intercostal space. The pericardium was removed to access the epicardial surface. The left coronary artery was ligated using 8/0 Ethilon suture, at a level between 1 and 2 mm below the tip of the left atrium. Successful ligation was confirmed by regional blanching of the left ventricle, extending to the apex. The chest wall was then repaired in layers and the animals were weaned from the ventilator. Mice were recovered in a warmed chamber for at least 6 hours. Perioperative analgesia with buprenorphine intramuscularly and flunixin subcutaneously was used.
Animal CMRI
Seven noninfarcted mice were used as control and were imaged preinjection and 2 hours after Gd-ESMA administration. One day later they were injected with Gd-DTPA and scanned again. For the postinfarction experiment, 6 animals underwent serial MRI from early to late stage of MI and were culled for histological analysis at day 22. Three to 4 of these animals underwent a T1 mapping preinjection scan. Three additional MI animals were sacrificed for histological analysis at day 4 and another 3 at day 11. A 7 T horizontal MR scanner (Agilent, Varian Inc, Palo Alto, CA) was used with mice in the prone position. The gradient coil had an inner diameter of 12 cm, and gradient strength and rise-time were 1000 mT/m (100 G/cm) and 120 μs, respectively. A quadrature transmit/receive coil (RAPID Biomedical GmbH, Germany) with an internal diameter of 39 mm was used. Anesthesia was maintained with 1.5% isoflurane and a mix of oxygen/air at a flow rate of 0.2/0.8 L/min and body temperature was maintained at 37°C using a warm-air fan (SA Instruments, Stony Brook, NY). The ECG was monitored via 2 metallic needles placed subcutaneously in the front paws. A pressure-transducer for respiratory gating was placed on the animal’s abdomen. ECG triggering was applied to all imaging sequences including the Look-Locker-based T1 mapping and LGE sequence.
Contrast Agents
Intravenous (i.v.) tail vein injection of 0.75 mmol/kg of the elastin-specific contrast agent, Gd-ESMA (Lantheus Medical Imaging, North Billerica, MA), was performed at each post-MI time point. Control measurements with a nonspecific contrast agent, 0.75 mmol/kg Gd-DTPA (Magnevist, Schering Healthcare, UK) were performed 24 hours later. All injections were performed by the same investigator in order to maintain accuracy and reproducibility. Paramagnetic Gd-ESMA is a low-molecular-weight contrast agent (855.95 Da). The agent was shown to target elastin in the chronic stage of MI.15 In a recent publication, Gd-ESMA binding studies were performed reporting binding to elastin (41%), tropoelastin (40%) but also to collagen type I and III (22% and 13%, respectively)22 and to serum albumin (15%) and chondroitin-6-sulfate (5%).23
CMRI Sequences
Two-dimensional cine-FLASH and 2-dimensional inversion recovery (Look-Locker) sequences were engaged to assess Gd-ESMA and Gd-DTPA uptake at the related post-MI time points. Imaging with Gd-ESMA was performed 2, 2.25, 2.5, and 2.75 hours postinjection. To verify Gd-ESMA clearance from the myocardium, 3 to 4 animals for each post-MI time point were also scanned before injection and at 4.5 hours after injection. Gd-DTPA datasets were obtained for a preinjection study and at 30 minutes and 2 hours after injection.
Cine-FLASH
Cine-FLASH was primarily used to measure functional/volumetric parameters at all time points in the MI experiments17 while the LGE method was used to study the signal-to-noise ratio and the contrast-to-noise ratio of blood, infarcted, and remote myocardium after Gd-ESMA and Gd-DTPA injection. The LGE sequence was also used to assess total infarct size and to assess the best slice to use for T1 mapping. Cine-FLASH imaging parameters included the following: field of view of 25×25 mm2, 1-mm thickness, matrix size of 128×128, 9 to 10 frames/cycle, cardiac cycle =120±30 ms, TR ≈12 ms ([cardiac cycle]/[frames/cycle]), TE =1 ms, 9 slices, flip angle =40°, number of averages =3, BW =10 MHz, acquisition time ≈8 minutes. Single-slice cine-FLASH was also engaged in a single slice before each Look-Locker scan for comparison of the contrast-enhanced area.
T1 mapping and LGE sequence: Look-Locker
The Look-Locker sequence was utilized as a T1 mapping method to investigate R1 values of myocardial tissues and as a LGE method to measure the extension of the areas of enhancement on a single slice, which was selected based on the maximum infarct extension on the cine-FLASH images. Infarcted enhanced areas were compared between 2 and 2.75 hours after Gd-ESMA injection for all post-MI time points and compared to that of Gd-DTPA 30 minutes after injection. R1 of blood, infarcted, and remote myocardium were obtained at all time points in order to investigate Gd-ESMA tissue retention and compared to pre-injection and at 4.5 hours postinjection time points. Similarly, tissue R1 was also obtained before injection and at 30 minutes and 2 hours post Gd-DTPA injection.
Look-Locker imaging parameters included the following: field of view of 25×25 mm2, 1 mm slice thickness, 3 phases/cycle, total of 30 phases, matrix size 128×128, 1 slice, flip angle (α) =10°, TR =2700 ms, TReff ≈40 ms ([cardiac cycle]/[3 phase/cycle]), TE =2 ms, BW =10 MHz, cardiac cycle =120±20 ms, number of averages =1, acquisition time ≈13 minutes.
Data Analysis
Functional/volumetric data and infarct size was derived from cine-FLASH images using the ClinicalVolumes segmentation software (King’s College London, www.clinicalvolumes.com).
Ejection fraction, left ventricular end-diastolic volume, left ventricular end-systolic volume, stroke volume, and left ventricular mass and infarcted areas were estimated to confirm the presence of an infarction and its effect on myocardial function and remodeling at all time points as previously reported.24 Infarct size was estimated on a single slice by contouring the enhanced infarcted area after injection of Gd-DTPA or Gd-ESMA17 and related to the total slice left ventricular area.
The ECG-triggered Look-Locker T1 mapping sequence resulted in 30 images (3 per cardiac cycle) from which R1 values of blood, infarcted, and remote myocardium were obtained by use of an exponential 3-parameters fit (OriginLab Corporation). The inversion delays (TI) ranged from 120 to 1364 ms for a mouse with a heart rate of 400 bpm (R-R interval =120 ms). A flip-angle correction was introduced to determine the T1 values as follows25:
| 1 |
Infarct size was measured on a Look-Locker LGE midventricular image by engaging the ClinicalVolumes software. The Look-Locker LGE image was defined as the image with nulled signal in the remote myocardium. End-diastolic images were used for analysis due to the better contrast displayed between the enhanced and remote areas when compared to other phases in the cardiac cycle. Look-Locker LGE images had an inversion time (TI) of about 600 ms for Gd-ESMA and 400 ms for the Gd-DTPA. Look-Locker LGE images were then used to calculate the mean percentage difference of the enhanced infarcted areas between Gd-ESMA and Gd-DTPA.
Statistical Analysis
Results are expressed as mean±SEM. Statistical differences were determined using GraphPad Prism software version 4.00. ANOVA or 2-way repeated-measures ANOVA (for pharmacokinetics data) followed by Bonferroni’s post hoc test were used. Statistical significance was set to P≤0.05.
Histological Analysis
Mice were culled by cervical dislocation at days 4, 11, and 22. Three hearts were sent for histological analysis at 4 and 11 days post-MI, respectively, while 6 hearts were used for histological analysis at 22 days post-MI. Five control hearts were also subjected to histological analysis. Hearts were harvested, washed in saline solution, and immediately immersed in 10% formalin for 48 hours at 4°C. Hearts were then embedded in paraffin and sectioned in a microtome into 5-μm-thick transverse slices. After deparaffination and rehydration, sections were trichrome stained to assess tissue morphology and to visualize collagen content. Elastin staining and tropoelastin immunohistochemistry were also performed to assess mature elastin fibers and tropoelastin content.
Trichrome staining was performed using a Trichrome stains (Masson) kit (Sigma-Aldrich, Dorset, United Kingdom). After deparaffination and rehydration, sections were immersed in Bouin’s Solution for 15 minutes at 56°C. Sections were then washed in water. Then samples were incubated for 5 minutes in Working Weigert’s Iron Hematoxylin Solution to stain the nuclei. Sections were then immersed for 5 minutes in Biebrich Scarlet-Acid Fuchsin to identify cell cytoplasms and muscle fibers. Subsequently, slides were placed in Working Phosphotungstic/Phosphomolybdic Acid Solution for 5 minutes. Samples were then incubated for 5 minutes in Aniline Blue Solution to stain collagen fibers. Finally, samples were washed in 1% acetic acid for 2 minutes, dehydrated, and mounted.
Elastin staining was performed using an Elastic stain kit (Sigma-Aldrich, Dorset, United Kingdom). After deparaffination and rehydration, sections were immersed in Working Elastic Stain Solution for 10 minutes where elastin resulted in staining in black. Then samples were incubated for 23 s in Working Ferric Chloride Solution for differentiation. Sections were then washed first in water, and then in 96% ethanol. Samples were immersed in Van Gieson solution for 2 minutes to stain collagen fibers in red and other components in yellow. Finally, samples were washed in 96% ethanol to remove iodine, dehydrated, and mounted.
For tropoelastin immunohistochemistry, sections were deparaffinated, rehydrated, and immersed in 3% H2O2 in methanol to block endogenous peroxidase. Then, samples were immersed in 0.01 mol/L citrate buffer, pH 6.0, and boiled for 2 minutes. Sections were then washed, blocked for 1 hour with 10% donkey serum, and incubated overnight with the primary antibody (rabbit polyclonal to tropoelastin [1:100; Abcam, Cambridge, United Kingdom]). Sections were washed and incubated with anti-rabbit horseradish peroxidase (HRP) Polymer (X-Cell Plus Universal Polymer HRP detection kit [Biocare LLC, Concord, CA]) followed by peroxidase substrate to detect the signal (Vector® SG Peroxidase substrate; Vector Laboratories, Burlingame, CA). Negative control sections were incubated without the primary antibody. Sections were counterstained with Nuclear Fast Red (Sigma-Aldrich, Dorset, United Kingdom).
Tropoelastin and elastin were quantified and expressed as a percentage of the infarcted myocardium using ImageJ software (National Institutes of Health, Bethesda, MD). In order to achieve the latter, areas of tropoelastin and elastin were manually segmented and compared to the total area of infarction for each histological slice. The percentage, representative of each post-MI time point, is expressed as mean±SEM.
Results
Functional/Volumetric Data
Functional and volumetric data are reported in Figure 2A. As expected, reduced ejection fraction, an increase in end-diastolic, end-systolic volumes, and left ventricular mass were observed during remodeling in post-MI mice. Representative diastolic and systolic short-axis Cine-Flash images of infarcted mice are shown in Figure 2B, indicating a visual enlargement of the left ventricular volumes from acute to late stage of MI.
Figure 2.

A, Functional and volumetric parameters of MI animals at 3, 10, and 21 days post-MI. With ongoing myocardial remodeling, EF decreased while all other parameters increased. B, The left ventricle dilates from acute to late stages of MI and the infarcted tissue thins as a consequence of cell necrosis and replacement with collagen and elastin/tropoelastin fibers formation throughout remodeling. n =6; *P<0.05, **P<0.01, ***P<0.001, compared to 3 days post-MI; †P<0.05, ††P<0.01, †††P<0.001, compared to 10 days post-MI. EF indicates ejection fraction; LVEDV, left ventricular end-diastolic volume; LVESV, left ventricular end-systolic volume; MI, myocardial infarction; SV, stroke volume.
LGE Images
Anatomical and LGE images post-MI are shown in Figure 3. Enhanced infarct areas are clearly visible 2 hours post-Gd-ESMA injection and 30 minutes post-Gd-DTPA injection. As for Gd-DTPA, Gd-ESMA LGE scans show areas of enhancement at all time points. Gd-DTPA LGE scans were also performed 2 hours after injection with similar outcomes to those of a control mouse (data not shown).
Figure 3.

A, Anatomical and LGE images; (B) 2 hours after Gd-ESMA injection, and (C) 30 minutes after Gd-DTPA injection. At all post-MI time points, Gd-ESMA shows significant enhancement in infarcted regions, which is in visual agreement with that for Gd-DTPA. Gd-DTPA indicates gadolinium-diethylenetriamine pentaacetic acid; Gd-ESMA, elastin/tropoelastin–specific contrast agent; LGE, late gadolinium enhancement; MI, myocardial infarction.
R1 Value Analysis
Figure 4 reports the R1 values of control and infarcted mice 2 hours post-Gd-ESMA (Figure 4A and 4B) and 30 minutes post-Gd-DTPA (Figure 4C and 4D) for blood, infarcted, and remote myocardium. In the case of Gd-ESMA, because the contrast agent is sufficiently cleared from blood after 2 hours, blood R1 was similar to pre-injection conditions (P>0.05). In contrast, infarcted myocardium showed significantly increased R1 values post-Gd-ESMA injection for all post-MI time points (P<0.05), while R1 values in the remote myocardium were only increased at days 10 and 21 as compared to healthy myocardium in control mice. In addition, R1 values at 10 days and 21 days were significantly higher than those during the acute stage (3 days) both for the infarcted and remote myocardium post-Gd-ESMA injection. In the case of Gd-DTPA, no significant differences in R1 were obtained between post-MI time points in any of the tissues under examination, although differences were observed between pre- and postinjection time points at 30 minutes after injection. No significant enhancement was found in infarcted areas at 2 hours after injection (data not shown).
Figure 4.

Pre- and post-Gd-ESMA R1 (mean±SEM) enhancement values of blood, infarcted, and remote myocardium for control (A) and infarcted mice (B). Gd-ESMA was cleared from blood as early as 2 hours postinjection, and specific binding was observed in infarcted and remote areas at late stages (10 and 21 days) of MI. At early stage of MI, Gd-ESMA shows retention in areas of infarction with R1 values significantly higher than that in control mice. Pre- and post-Gd-DTPA R1 enhancement values of blood, infarcted, and remote myocardium 30 minutes after injection for control (C) and infarcted mice (D). Although R1 significantly increased from control conditions to infarcted areas, no significant differences were found between R1 at any of the post-MI time points. Number of animals used: 7 control, 6 animals at all post-MI time points. (Control =noninfarcted); (***P<0.001, compared to 3 days post-MI; †P<0.05 for 10 vs. 21 days post-MI). GD-DTPA indicates gadolinium-diethylenetriamine pentaacetic acid; Gd-ESMA, elastin/tropoelastin–specific contrast agent; MI, myocardial infarction.
An additional study was performed in MI mice to verify Gd-ESMA tissue clearance 24 hours postinjection. R1 values in myocardium 24 hours post-Gd-ESMA injection were similar to those in a pre-injection mouse.
Gd-ESMA Pharmacokinetics
Pharmacokinetics of Gd-ESMA between 2 and 2.75 hours is reported in Figure 5 at each postinjection time point. The R1 in blood approaches pre-injection levels after 2 hours, suggesting rapid clearance of Gd-ESMA (Figure 5A). Infarcted and remote areas instead show a significant increase in R1 values between pre-injection and post-Gd-ESMA injection time points (2 to 2.75 hours) both for the infarct (3, 10, and 21 days) and the remote myocardium (only at 10 and 21 days) (Figure 5B and 5C). In addition, there was an increase in R1 between the acute (3 days) and chronic stage (10 and 21 days) of MI with highest R1 values at 21 days both in the infarct and remote myocardium after 2-way ANOVA statistical analysis. R1 values detected between 2 and 3 hours post-Gd-ESMA injection were relatively stable, as highlighted in Table where statistical differences between post-injection time points are reported, suggesting a suitable time frame for the investigation of myocardial remodeling with Gd-ESMA in MI models.
Figure 5.

Pharmacokinetics of Gd-ESMA in blood, remote myocardium, and infarct of MI mice. Mean R1 values and the related SE are reported for blood (A), infarcted tissue (B), and remote myocardium (C) for each postinjection and post-MI time point. After a 2-way repeated-measures ANOVA, significant differences are observed between control and injected animals in infarcted and remote areas and between early and late post-MI time points (*P<0.05, **P<0.01, ***P<0.001 for 3 vs. 10 days post-MI; †P<0.05, ††P<0.01, †††P<0.001 for 3 vs. 21 days post-MI). Control =noninfarcted; n =6. Gd-ESMA indicates elastin/tropoelastin–specific contrast agent; MI, myocardial infarction.
Table 1.
Statistical Analysis Comparing Post-injection Mean R1 Values at Similar Post–Myocardial Infarction Time Points
| 2 Hours | 2.25 Hours | 2.5 Hours | 2.75 Hours | |
|---|---|---|---|---|
| Blood R1 (1/s) | ||||
| 3 days | 0.45 | 0.49* | 0.44†† | 0.47 |
| 10 days | 0.44 | 0.43 | 0.41 | 0.40 |
| 21 days | 0.40 | 0.39 | 0.41 | 0.38 |
| Infarct R1 (1/s) | ||||
| 3 days | 1.48 | 1.37 | 1.40 | 1.20* |
| 10 days | 1.98 | 1.71* | 2.06†† | 1.72*## |
| 21 days | 2.15 | 1.94 | 1.88* | 1.99 |
| Remote R1 (1/s) | ||||
| 3 days | 0.85 | 0.85 | 0.80 | 0.85 |
| 10 days | 1.24 | 1.19 | 1.18 | 1.17 |
| 21 days | 1.33 | 1.04** | 1.27† | 1.24 |
P<0.05,
P<0.01 as compared to 2 hours;
P<0.05,
P<0.01, as compared to 2.25 hours;
P<0.01, as compared to 2.5 hours.
Area of Infarction: Gd-DTPA Versus Gd-ESMA
Mean infarct size after Gd-ESMA injection has been evaluated between 2 and 2.75 hours and is reported at each post-MI time point (Figure 6A). At all post-MI time points, the difference in percentage does not exceed the ±5% threshold, which we consider a benchmark for good similarity.
Figure 6.

A, Infarct size variation (%) as visualized with Gd-ESMA between 2 and 2.75 hours. Similar to R1, infarct size extension did not significantly change between 2 and 2.75 hours postinjection. B, Relative difference (%) between infarct size measured with Gd-DTPA and Gd-ESMA. The percentage difference is smallest for chronic infarcts (21 days). During the acute phase, Gd-DTPA and Gd-ESMA highlight areas of infarction and edema, which leads to the larger percent difference at this early time point. Data are presented as median±interquartile range, n =6. GD-DTPA indicates gadolinium-diethylenetriamine pentaacetic acid; Gd-ESMA, elastin/tropoelastin–specific contrast agent.
In comparison with Gd-DTPA (30 minutes after injection), the agreement in infarct size was the lowest for the acute stage (3 to 4 days). On average, enhanced areas appeared larger with Gd-DTPA than those after Gd-ESMA injection at this early time point. For the later stages of MI (10 to 11 and 21 to 22 days) the agreement in infarct size was significantly improved and the differences were less than ±5% between Gd-DTPA and Gd-ESMA (Figure 6B).
Histological Findings
Morphological changes were highlighted on trichrome staining of the myocardium as reported in Figure 7A through 7C, where infarcted and remote myocardium can be clearly identified. A sharp increase in collagen content from acute to late stage of MI (Figure 7D through 7F) was observed in the infarcted area, which may also have contributed to the MR signal. In the remote area, little collagen was detected.
Figure 7.

Trichrome staining of heart sections at 4, 11, and 22 (A through C) post-MI. Infarcted and remote areas are identified with an arrow and a star, respectively. The dashed lines highlight the extension of the areas of infarct. High magnification (×40) of infarcted and remote areas is shown for trichrome (D through F), elastin (G through I), and tropoelastin (J through L). While collagen appears in blue, elastin and tropoelastin are identified as black filaments. Quantification analysis was performed to determine the amount of tropoelastin and elastin with respect to the infarcted area. Little to no elastin was found at any time point, whereas 8% and 20% of tropoelastin was detected at 11 and 22 days post-MI, respectively. Scale bars, 50 μm; n =3 for 3 days and 10 days post-MI; n =6 for 21 days post-MI. LV indicates left ventricular; MI, myocardial infarction.
Elastin staining and tropoelastin immunohistochemistry highlighted the respective fibers in black. No mature elastin fibers were observed at any stage of MI (Figure 7G through 7I), implying that the detected MRI signal is mainly dependent on the de novo synthesis of tropoelastin. Tropoelastin content increased from the acute to the late stage of MI in infarcted areas (Figure 7J through 7L), which was in agreement with a significant R1 increase at the late stage of MI after Gd-EMSA injection. The quantitative analysis showed little or no staining at 3 days post-MI, while 8.4±1.0% and 20±2% of the infarcted myocardium stained positive for tropoelastin in infarcted areas at days 11 and 22, respectively. The remote myocardium showed a small increase in mainly diffuse tropoelastin deposition from early to late stages of MI, which was in agreement with an increase of R1 post-Gd-ESMA in the remote myocardium at days 10 and 21 post-MI. This enhancement could not be accurately evaluated as a percentage of the remote myocardium on tropoelastin immunohistochemistry.
Discussion
This study aimed to investigate ECM remodeling after MI. We demonstrate the feasibility of quantifying de novo ECM formation both in the infarct and remote myocardium using an elastin/tropoelastin–specific MR contrast agent (Gd-ESMA). Relaxation rate (R1) values of infarct increased significantly from 3 to 21 days post-MI, which was in good agreement with de novo formation of tropoelastin observed with immunohistochemistry. Similarly, R1 values in remote myocardium were significantly increased at 10 and 21 days post-MI compared to control mice and the acute phase (3 days post-MI), which was in agreement with increasing tropoelastin staining at 10 and 21 days. On the contrary, no mature elastin was found in the myocardium at any post-MI time point by histology. R1 mapping of a nonspecific MR contrast agent Gd-DTPA did not show any significant increase in R1 between 3 and 21 days, demonstrating its inability to directly measure de novo formation of ECM proteins. In addition, both Gd-ESMA and Gd-DTPA resulted in similar areas of infarction at all time points, with best agreement during the chronic stage of MI. This observation supports the hypothesis that the unbound fraction of Gd-ESMA and the nonspecific Gd-DTPA are a good measure of the extracellular volume, which has been shown to be a surrogate marker of infarct size.
Based on previous studies, the experimental design used a 2 hours washout period between Gd-ESMA injection and CMRI data acquisition in order to achieve clearance from blood but sufficient myocardial retention of Gd-ESMA, thereby maximizing myocardium to background signal. In the infarcted myocardium, the agent was well retained, producing increased R1 values from the acute to the late stage of MI, suggesting specific binding to elastin/tropoelastin. Signal enhancement with Gd-ESMA was readily detected between 2 and 3 hours postinjection, with R1 values and enhanced area extensions maintained constant during this time window at any post-MI time point. Beyond 4 hours from Gd-ESMA injection (data not shown), little to no enhancement was detected and R1 values were comparable to those of control animals. Clearance of Gd-ESMA from infarct (all MI time points) and remote myocardium (10 and 21 days post-MI) was significantly delayed compared to Gd-DTPA, suggesting specific binding to elastin/tropoelastin at 10 and 21 days post-MI. Gd-DTPA was fully cleared, based on R1 values, from the infarcted myocardium as early as 2 hours after administration.
At 3 days post-MI, T1 mapping showed a significant increase in R1 values in the infarcted myocardium when compared to control mice, although histology did not confirm the presence of elastin/tropoelastin or collagen fibers. It should be noted that retention of Gd-ESMA, in areas where tropoelastin is absent, should have followed a similar behavior to that of Gd-DTPA due to their comparable molecular size, thus clearing as early as 2 hours after injection. To this end, it can be speculated that Gd-ESMA retention was caused by increased extracellular volume effects, from binding to cellular debris and/or to proteins such as serum albumin that leaks into the infarct site from the bloodstream. In particular, the cellular debris released in the ECM resulting from cell necrosis in the infarcted area might be a potential target for Gd-ESMA. Therefore, although some of our previous studies21–23 demonstrated preferential binding of Gd-ESMA to elastin/tropoelastin proteins, it is believed that, probably due to its small molecular structure, shown by Fischer et al,26 other types of molecules could also be targeted.
A 10% and 45% increase in R1 was observed with Gd-ESMA in the infarct zone at 10 and 21 days post-MI, respectively, when compared to the 3 days post-MI scan, suggesting the binding to elastin/tropoelastin in the infarcted tissue. As the elastin protein is believed to provide a “protective” effect against cardiac rupture and to decrease the area of infarction when augmented in the myocardium, the noninvasive imaging of elastin may be a promising clinical tool to guide and monitor treatment.16 To this end, myocardial tissue proteins were quantified. Mature elastin fibers were absent on Elastica Van Gieson staining in the myocardium, where they should have appeared in black in the post-MI group. Cross-linking of elastin fibers may occur at later stages, although another study in a rat model of MI also reported little elastin in infarcted areas even at 2 and 3 months after the myocardial insult.16 Staining with an anti-tropoelastin antibody demonstrated a tropoelastin content of ≈8% at 10 days and 20% at 21 days post-MI in the infarcted myocardium, which was in good agreement with the increased R1 values measured by MRI. Direct quantification of tropoelastin from R1 values remains a challenging task as R1 values also might be influenced by the increased extracellular volume in the infarct and remote myocardium. Additionally, weak binding to other proteins may also contribute to the MR signal. Previous studies with Gd-ESMA by our group reported a 40% binding affinity to tropoelastin and about 22% and 13% to collagen type I and III, respectively. Although these data support tropoelastin as the primary contributor to the MRI signal, binding to collagen I and III might influence the final MR signal due to the abundance of collagen fibers in the remodeled myocardium. Little contribution from cellular debris is expected during the proliferation and maturation phase due to clearance of cellular debris during the early inflammatory phase.
In the remote myocardium, R1 values also increased from the acute to the late stages of MI (significantly higher at 10 and 21 days), which was in good agreement with a small increase in tropoelastin staining. As already reported in recent publications,27,28 viable areas of the left ventricle, although not directly affected by the surgical procedure, undergo considerable stress after MI resulting in “mild” ECM remodeling, which is considered to carry considerable prognostic value and represent an important substrate to predict the future risk of heart failure.
While T1 mapping is an essential tool for the investigation of myocardial tissue characterization in MI models, LGE MRI provides important information with respect to infarct size. Areas of enhancement after injection of Gd-DTPA and Gd-ESMA were found to be similar, with best agreement during the chronic phase of MI. This finding supports the hypothesis that the unbound fraction of Gd-ESMA represents a good measure of the extracellular volume, which was also observed by Wildgruber et al15 at 1 and 3 weeks post-MI.
Limitations of Gd-ESMA at high field are the lower r1 relaxivity values of the bound fraction, which makes it difficult to differentiate between specific binding to elastin/tropoelastin and nonspecific accumulation of the free fraction. To this end, the use of lower field strength would increase the R1 relaxivity values of the Gd-ESMA bound fraction and may help to improve the differentiation and localization of elastin/tropoelastin areas. Second, although the retention of the free fraction in the acute stage can be considered as an undesired effect, it can be used in delineating infarct size and assessing the extracellular space. Third, the R1 values achieved with Gd-ESMA at 7 T can be considered relatively low when compared to those found 30 minutes after Gd-DTPA injection at similar concentration. This limits the use of cine-FLASH as an LGE method for the delineation of enhanced areas when compared to an inversion recovery sequence which, although time consuming, remains a more accurate methodology.
In conclusion, Gd-ESMA has been found to be a unique imaging biomarker for the investigation and quantification of ECM remodeling of both the infarct and remote myocardium post-MI in vivo. T1 mapping and LGE MRI with Gd-ESMA may provide new insights in the study of remodeling and the de novo synthesis of elastin/tropoelastin post-MI and thus generate a more comprehensive view of ECM remodeling during the proliferation and maturation phase.
Sources of Funding
This work was supported by the (1) British Heart Foundation Centre of Excellence at King’s College London, (2) a British Heart Foundation Program grant (RG/12/1/29262), (3) the Centre of Excellence in Medical Engineering funded by the Wellcome Trust and the Engineering and Physical Sciences Research Council (WT 088641/Z/09/Z), and (4) the Department of Health via the National Institute for Health Research (NIHR) comprehensive Biomedical Research Centre award to Guy’s & St Thomas’ National Health Service (NHS) Foundation Trust in partnership with King’s College London and King’s College Hospital NHS Foundation Trust.
Disclosures
None.
References
- Nahrendorf M, Swirski FK, Aikawa E, Stangenberg L, Wurdinger T, Figueiredo JL, Libby P, Weissleder R, Pittet MJ. The healing myocardium sequentially mobilizes two monocyte subsets with divergent and complementary functions. J Exp Med. 2007;204:3037–3047. doi: 10.1084/jem.20070885. [DOI] [PMC free article] [PubMed] [Google Scholar]
- Leuschner F, Rauch PJ, Ueno T, Gorbatov R, Marinelli B, Lee WW, Dutta P, Wei Y, Robbins C, Iwamoto Y, Sena B, Chudnovskiy A, Panizzi P, Keliher E, Higgins JM, Libby P, Moskowitz MA, Pittet MJ, Swirski FK, Weissleder R, Nahrendorf M. Rapid monocyte kinetics in acute myocardial infarction are sustained by extramedullary monocytopoiesis. J Exp Med. 2012;209:123–137. doi: 10.1084/jem.20111009. [DOI] [PMC free article] [PubMed] [Google Scholar]
- Kanno S, Lerner DL, Schuessler RB, Betsuyaku T, Yamada KA, Saffitz JE, Kovacs A. Echocardiographic evaluation of ventricular remodeling in a mouse model of myocardial infarction. J Am Soc Echocardiogr. 2002;15:601–609. doi: 10.1067/mje.2002.117560. [DOI] [PubMed] [Google Scholar]
- Verjans JW, Lovhaug D, Narula N, Petrov AD, Indrevoll B, Bjurgert E, Krasieva TB, Petersen LB, Kindberg GM, Solbakken M, Cuthbertson A, Vannan MA, Reutelingsperger CPM, Tromberg BJ, Hofstra L, Narula J. Noninvasive imaging of angiotensin receptors after myocardial infarction. JACC Cardiovasc Imaging. 2008;1:354–362. doi: 10.1016/j.jcmg.2007.11.007. [DOI] [PMC free article] [PubMed] [Google Scholar]
- Pozo E, Sanz J. Cardiac magnetic resonance imaging: recent advances and new insights in cardiovascular disease. Curr Cardiovasc Imaging Rep. 2013;6:34–44. [Google Scholar]
- Helm PA, Caravan P, French BA, Jacques V, Shen L, Xu Y, Beyers RJ, Roy RJ, Kramer CM, Epstein FH. Postinfarction myocardial scarring in mice: molecular MR imaging with use of a collagen-targeting contrast agent. Radiology. 2008;247:788–796. doi: 10.1148/radiol.2473070975. [DOI] [PMC free article] [PubMed] [Google Scholar]
- Jivraj N, Phinikaridou A, Shah AM, Botnar RM. Molecular imaging of myocardial infarction. Basic Res Cardiol. 2014;109:397. doi: 10.1007/s00395-013-0397-2. [DOI] [PubMed] [Google Scholar]
- Dobaczewski M, Gonzalez-Quesada C, Frangogiannis NG. The extracellular matrix as a modulator of the inflammatory and reparative response following myocardial infarction. J Mol Cell Cardiol. 2010;48:504–511. doi: 10.1016/j.yjmcc.2009.07.015. [DOI] [PMC free article] [PubMed] [Google Scholar]
- Kielty CM, Sherratt MJ, Shuttleworth CA. Elastic fibres. J Cell Sci. 2002;115:2817–2828. doi: 10.1242/jcs.115.14.2817. [DOI] [PubMed] [Google Scholar]
- Li DY, Brooke B, Davis EC, Mecham RP, Sorensen LK, Boak BB, Eichwald E, Keating MT. Elastin is an essential determinant of arterial morphogenesis. Nature. 1998;393:276–280. doi: 10.1038/30522. [DOI] [PubMed] [Google Scholar]
- Muller-Ehmsen J, Whittaker P, Kloner RA, Dow JS, Sakoda T, Long TI, Laird PW, Kedes L. Survival and development of neonatal rat cardiomyocytes transplanted into adult myocardium. J Mol Cell Cardiol. 2002;34:107–116. doi: 10.1006/jmcc.2001.1491. [DOI] [PubMed] [Google Scholar]
- Nakamura T, Lozano PR, Ikeda Y, Iwanaga Y, Hinek A, Minamisawa S, Cheng CF, Kobuke K, Dalton N, Takada Y, Tashiro K, Ross J, Jr, Honjo T, Chien KR. Fibulin-5/DANCE is essential for elastogenesis in vivo. Nature. 2002;415:171–175. doi: 10.1038/415171a. [DOI] [PubMed] [Google Scholar]
- Parmley WW, Chuck L, Kivowitz C, Matloff JM, Swan HJ. In vitro length-tension relations of human ventricular aneurysms. Relation of stiffness to mechanical disadvantage. Am J Cardiol. 1973;32:889–894. doi: 10.1016/s0002-9149(73)80153-5. [DOI] [PubMed] [Google Scholar]
- Henkel W, Glanville RW. Covalent crosslinking between molecules of type I and type III collagen. The involvement of the N-terminal, nonhelical regions of the alpha 1 (I) and alpha 1 (III) chains in the formation of intermolecular crosslinks. Eur J Biochem. 1982;122:205–213. doi: 10.1111/j.1432-1033.1982.tb05868.x. [DOI] [PubMed] [Google Scholar]
- Wildgruber M, Bielicki I, Aichler M, Kosanke K, Feuchtinger A, Settles M, Onthank DC, Cesati RR, Robinson SP, Huber AM, Rummeny EJ, Walch AK, Botnar RM. Assessment of myocardial infarction and postinfarction scar remodeling with an elastin-specific magnetic resonance agent. Circ Cardiovasc Imaging. 2014;7:321–329. doi: 10.1161/CIRCIMAGING.113.001270. [DOI] [PubMed] [Google Scholar]
- Mizuno T, Yau TM, Weisel RD, Kiani CG, Li RK. Elastin stabilizes an infarct and preserves ventricular function. Circulation. 2005;112(9 suppl):I81–I88. doi: 10.1161/01.CIRCULATIONAHA.105.523795. [DOI] [PubMed] [Google Scholar]
- Protti A, Sirker A, Shah AM, Botnar R. Late gadolinium enhancement of acute myocardial infarction in mice at 7 T: cine-FLASH versus inversion recovery. J Magn Reson Imaging. 2010;32:878–886. doi: 10.1002/jmri.22325. [DOI] [PubMed] [Google Scholar]
- Protti A, Dong X, Andia ME, Yu B, Dokukina K, Chaubey S, Phinikaridou A, Vizcay-Barrena G, Taupitz M, Botnar RM, Shah AM. Assessment of inflammation with a very small iron-oxide particle in a murine model of reperfused myocardial infarction. J Magn Reson Imaging. 2014;39:598–608. doi: 10.1002/jmri.24191. [DOI] [PubMed] [Google Scholar]
- Geelen T, Paulis LE, Coolen BF, Nicolay K, Strijkers GJ. Contrast-enhanced MRI of murine myocardial infarction—part I. NMR Biomed. 2012;25:953–968. doi: 10.1002/nbm.2768. [DOI] [PubMed] [Google Scholar]
- Paulis LE, Geelen T, Kuhlmann MT, Coolen BF, Schafers M, Nicolay K, Strijkers GJ. Distribution of lipid-based nanoparticles to infarcted myocardium with potential application for MRI-monitored drug delivery. J Control Release. 2012;162:276–285. doi: 10.1016/j.jconrel.2012.06.035. [DOI] [PubMed] [Google Scholar]
- Makowski MR, Wiethoff AJ, Blume U, Cuello F, Warley A, Jansen CH, Nagel E, Razavi R, Onthank DC, Cesati RR, Marber MS, Schaeffter T, Smith A, Robinson SP, Botnar RM. Assessment of atherosclerotic plaque burden with an elastin-specific magnetic resonance contrast agent. Nat Med. 2011;17:383–388. doi: 10.1038/nm.2310. [DOI] [PubMed] [Google Scholar]
- Botnar RM, Wiethoff AJ, Ebersberger U, Lacerda S, Blume U, Warley A, Jansen CH, Onthank DC, Cesati RR, Razavi R, Marber MS, Hamm B, Schaeffter T, Robinson SP, Makowski MR. In vivo assessment of aortic aneurysm wall integrity using elastin specific molecular magnetic resonance imaging. Circ Cardiovasc Imaging. 2014;7:679–689. doi: 10.1161/CIRCIMAGING.113.001131. [DOI] [PubMed] [Google Scholar]
- Von Bary C, Makowski M, Preissel A, Keithahn A, Warley A, Spuentrup E, Buecker A, Lazewatsky J, Cesati R, Onthank D, Schickl N, Schachoff S, Hausleiter J, Schӧmig A, Schwaiger M, Robinson S, Botnar RM. MRI of coronary wall remodeling in a swine model of coronary injury using an elastin-binding contrast agent. Circ Cardiovasc Imaging. 2011;4:147–155. doi: 10.1161/CIRCIMAGING.109.895607. [DOI] [PubMed] [Google Scholar]
- Protti A, Dong X, Sirker A, Botnar R, Shah AM. MRI-based prediction of adverse cardiac remodeling after murine myocardial infarction. Am J Physiol Heart Circ Physiol. 2012;303:309–314. doi: 10.1152/ajpheart.00208.2012. [DOI] [PMC free article] [PubMed] [Google Scholar]
- Deichmann R, Haase A. Quantification of Tl values by SNAPSHOT-FLASH NMR imaging. J Magn Reson. 1992;96:608–612. [Google Scholar]
- Fischer CR, Muller A, Bochsler B, Rancic Z, Kaufmann P, Schibli R, Ametamey SM. Assessment of an elastin binding molecule for PET imaging of atherosclerotic plaques. Am J Nucl Med Mol Imaging. 2013;3:326–335. [PMC free article] [PubMed] [Google Scholar]
- Yang Z, Berr SS, Gilson WD, Toufektsian MC, French BA. Simultaneous evaluation of infarct size and cardiac function in intact mice by contrast-enhanced cardiac magnetic resonance imaging reveals contractile dysfunction in noninfarcted regions early after myocardial infarction. Circulation. 2004;109:1161–1167. doi: 10.1161/01.CIR.0000118495.88442.32. [DOI] [PubMed] [Google Scholar]
- Epstein FH, Yang Z, Gilson WD, Berr SS, Kramer CM, French BA. MR tagging early after myocardial infarction in mice demonstrates contractile dysfunction in adjacent and remote regions. Magn Reson Med. 2002;48:399–403. doi: 10.1002/mrm.10210. [DOI] [PubMed] [Google Scholar]