

Abstract
Background
Debate over the role of fructose in mediating cardiovascular risk remains active. To update the evidence on the effect of fructose on established therapeutic lipid targets for cardiovascular disease (low-density lipoprotein cholesterol [LDL]-C, apolipoprotein B, non-high-density lipoprotein cholesterol [HDL-C]), and metabolic syndrome (triglycerides and HDL-C), we conducted a systematic review and meta-analysis of controlled feeding trials.
Methods and Results
MEDLINE, EMBASE, CINHAL, and the Cochrane Library were searched through July 7, 2015 for controlled feeding trials with follow-up ≥7 days, which investigated the effect of oral fructose compared to a control carbohydrate on lipids (LDL-C, apolipoprotein B, non-HDL-C, triglycerides, and HDL-C) in participants of all health backgrounds. Two independent reviewers extracted relevant data. Data were pooled using random effects models and expressed as mean difference with 95% CI. Interstudy heterogeneity was assessed (Cochran Q statistic) and quantified (I2 statistic). Eligibility criteria were met by 51 isocaloric trials (n=943), in which fructose was provided in isocaloric exchange for other carbohydrates, and 8 hypercaloric trials (n=125), in which fructose supplemented control diets with excess calories compared to the control diets alone without the excess calories. Fructose had no effect on LDL-C, non-HDL-C, apolipoprotein B, triglycerides, or HDL-C in isocaloric trials. However, in hypercaloric trials, fructose increased apolipoprotein B (n=2 trials; mean difference = 0.18 mmol/L; 95% CI: 0.05, 0.30; P=0.005) and triglycerides (n=8 trials; mean difference = 0.26 mmol/L; 95% CI: 0.11, 0.41; P<0.001). The study is limited by small sample sizes, limited follow-up, and low quality scores of the included trials.
Conclusions
Pooled analyses showed that fructose only had an adverse effect on established lipid targets when added to existing diets so as to provide excess calories (+21% to 35% energy). When isocalorically exchanged for other carbohydrates, fructose had no adverse effects on blood lipids. More trials that are larger, longer, and higher quality are required.
Clinical Trials Registration
URL: https://www.clinicaltrials.gov/. Unique Identifier: NCT01363791.
Keywords: lipids, meta-analysis, nutrition
With the global rise in obesity, diabetes, and cardiovascular disease, there is growing concern about the role played by fructose-containing sugars (fructose, sucrose, and high fructose corn syrup [HFCS]).1,2 In response, various heart and diabetes associations have set strict upper limits for added fructose based on achieving and maintaining healthy blood lipids. For example, the American Heart Association3 in their statement on triglycerides and cardiovascular disease has recommended reducing intake of fructose to <100 g/day, 50 to 100 g/day, and <50 g/day in people with borderline, high, and very high triglycerides, respectively, while the Canadian Diabetes Association4 recommends limiting added fructose to <10% of total energy in people with diabetes.
The evidence on which these recommendations are based comes chiefly from 2 earlier systematic reviews and meta-analyses of controlled feeding on the effect of fructose on lipids. Livesey and Taylor in 20085 identified a threshold of ≥100 g/day for fasting triglyceride effects in different participant types, while Sievenpiper et al in 20096 identified a dose threshold of >60 g/day or 10% of total energy in people with diabetes. Since these systematic reviews5,6 were published, numerous additional controlled feeding trials on the effect of fructose on fasting lipids have been published.7–18 More recent systematic reviews and meta-analyses of the effect of fructose on other related cardiometabolic risk factors have suggested that fructose only has adverse effects on body weight, postprandial triglycerides, glycemic control, uric acid, and markers of nonalcoholic fatty liver disease insofar as it contributes to excess calories.19–24 Whether these dose thresholds for the effect of fructose on lipids remain in isocaloric comparisons or are confined to comparisons with fructose provided as excess energy is unclear. To address these issues, we undertook an updated systematic review and meta-analysis of controlled clinical trials to assess the effect of fructose on established therapeutic lipid targets for cardiovascular disease (low density lipoprotein cholesterol [LDL-C], apolipoprotein B [apo B], non–high density lipoprotein cholesterol [HDL-C]) and metabolic syndrome (triglycerides and HDL-C).
Subjects and Methods
Design
We followed the Cochrane Handbook for Systematic Reviews of Interventions25 and the Preferred Reporting Items for Systematic Reviews and Meta-Analysis guidelines.26 The review protocol is available at ClinicalTrials.gov (registration number: NCT01363791).
Study Selection
We searched the databases MEDLINE, EMBASE, CINAHL, and the Cochrane Library through July 7, 2015 for relevant articles and supplemented with manual searches. The full search term used in this study is presented in Table S1. No restrictions were placed on language. Controlled trials that investigated the effect of oral fructose on lipids (LDL-C, apo B, non-HDL, triglycerides, and HDL-C) in participants of all health backgrounds were included. We defined controlled trials as clinical intervention studies using a crossover or parallel design in which a group of participants is allocated to a fructose and/or a control diet intervention with or without randomization. A comparison was considered isocaloric when the amount of fructose was exchanged for an equal amount of a carbohydrate comparator. If the trial involved overfeeding of fructose so that the fructose provided excess energy resulting in a positive energy balance, then the comparison was still considered isocaloric as long as the carbohydrate comparator was matched for the excess energy resulting in the same positive energy balance. A comparison was considered hypercaloric when a control diet was supplemented with excess energy from fructose compared with the same control diet alone without the excess energy. Trials that involved a follow-up of <7 days, administered intravenous fructose, lacked a control diet, or did not provide suitable end-point data were excluded.
Data Extraction
Four reviewers (L.C., V.H., A.I.C., D.D.W.) independently reviewed and extracted relevant data from each report. The quality of each study was assessed using the Heyland methodological quality score (MQS).27 Disagreements were reconciled by consensus. Mean±SD differences between fructose and control arms were extracted as the main end points. In those trials where the data were included in figures and not provided numerically, we used the software program Plot Digitizer (http://plotdigitizer.sourceforge.net/) to extract the data. Additional information was requested from the authors of all included trials.
Access to Study
All authors had access to the study data and reviewed and approved the final manuscript.
Statistical Analysis
Data analyses were conducted using Review Manager version 5.1.6 (RevMan) (Copenhagen, Denmark: The Nordic Cochrane Centre, The Cochrane Collaboration, 2014) for primary analyses and Stata version 13 (College Station, TX: StataCorp LP) for subgroup analyses. Separate analyses were conducted for the isocaloric and hypercaloric trials using the generic inverse variance method with random effects weighting. Data were expressed as mean differences (MD) with 95% CI. Trials that did not report standard error (SE) values had these computed from the available statistics using standard formulae.25,28 To generate SE for included crossover trials, we assumed paired analyses as described by Elbourne,28 where the SDs for the means of the treatment arms were used along with the sample size and correlation coefficient to calculate the SD of the mean difference, which was then converted to a SE. If insufficient data were available for computations in crossover trials, SE values were imputed using a conservative correlation coefficient of 0.5, which was chosen since there no more than 10 isocaloric trials with available data for calculated correlations (7 for LDL, 0 for non-HDL-C and apo B; 10 for triglycerides, and 2 for HDL-C). Sensitivity analyses were performed using correlation coefficients of 0.25 and 0.75.
Non-HDL-C was determined using studies that reported both total cholesterol and HDL-C by calculating the difference between the means. The SDs for non-HDL-C were calculated using a standard formula using the SDs of total cholesterol and HDL-C as has been previously published.29
Inter-trial heterogeneity was assessed by the Cochran Q statistic, where P<0.10 is considered statistically significant, and quantified by the I2 statistic, where I2≥50% indicates substantial heterogeneity.25 Sources of heterogeneity were investigated by sensitivity analyses in which each individual trial was removed from the analysis and through a priori subgroup analyses by comparator (starch, glucose, sucrose or HFCS), fructose dose (≤60 g/day or >60 g/day6; <100 g/day or ≥100 g/day5), fructose form (solid, liquid or mixed), follow-up (≤4-weeks or >4-weeks), MQS (<8 or ≥8), randomization (yes or no), design (crossover or parallel), feeding control (metabolic or non-metabolic) and energy balance (negative, neutral or positive). Meta-regression analyses assessed the significance of subgroup effects. Multivariate meta-regression analyses assessed dose response models were also performed using the covariates comparator, patient type, follow-up, design, and fructose form. Each covariate was included in the model individually and then added one at a time in order of decreasing R2 as obtained from the individual models. When a dose response model for a lipid outcome was significant, it was further explored using an interaction model. If the interaction term was significant, then the dose response was explored separately at each level of the covariate. Publication bias was evaluated via visual inspection of funnel plots and Egger30 and Begg31 tests.
Results
Search Results
The flow of the literature is shown in Figure1. Our search identified 1918 reports, of which 43 reports including data for 59 trials met the eligibility criteria.7–18,32–62
Figure 1.
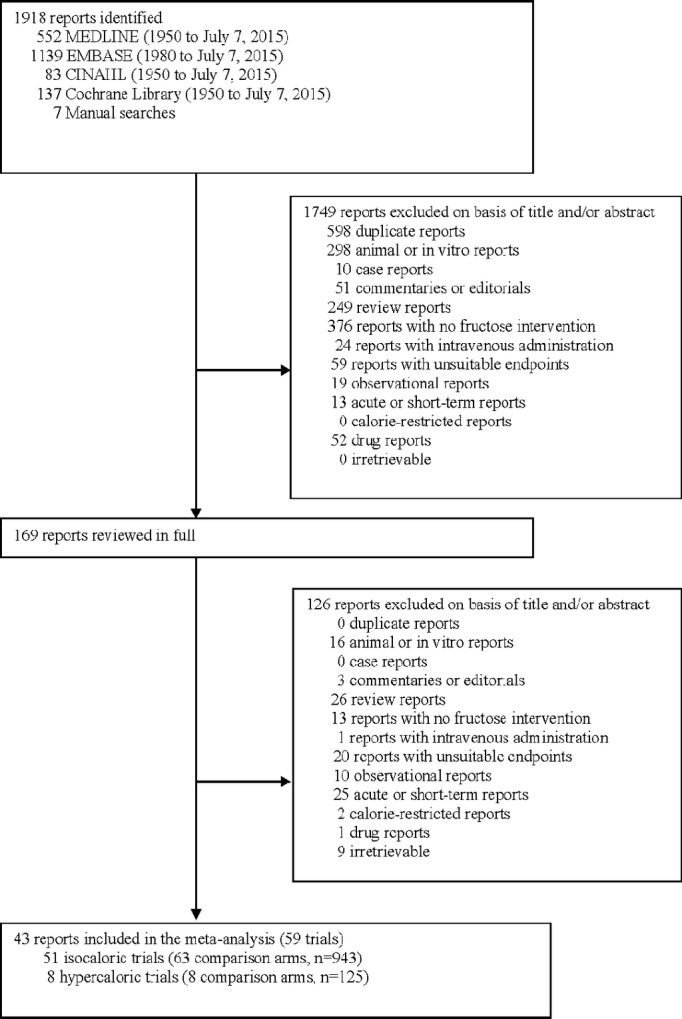
Flow of the literature.
Trial Characteristics
Trial characteristics are shown in Table 1. A total of 51 isocaloric trials (26 trials for LDL, 8 for apo B, 27 for non-HDL-C, 51 for triglycerides, and 28 for HDL-C) in 943 participants and 8 hypercaloric trials (4 trials for LDL, 2 for non-HDL-C, 2 for apo B, 8 for triglycerides, and 4 for HDL-C) in 125 participants were included in the analyses. The majority of the studies were conducted in an outpatient setting in the United States or Europe and tended to be small (median, interquartile range ([IQR]) sample size, 11.0 (7.0 to 16.0) and 15.5 (10.25 to 23), in isocaloric and hypercaloric trials, respectively).
Table 1.
Characteristics of Controlled Feeding Trials Investigating the Effect of Fructose on Lipids
| Study, Year (Reference) | Participants | Mean Age (SD or Range), y | Setting | Design | Feeding Control | Randomization | Fructose Dose* | Fructose Form† | Comparator‡ | Diet§ | Energy Balance | Follow-Up | MQS‖ | Funding Source¶ |
|---|---|---|---|---|---|---|---|---|---|---|---|---|---|---|
| Isocaloric feeding trials | ||||||||||||||
| Diabetes | ||||||||||||||
| Akerblom et al 1972 39 | 16 T1DM | 10 (2 to 16) | OP, Finland | C | Supp | No | ≈40 g/day (20% E) | Mixed | Starch | 45:35:20 | Neutral | 1 week | 4 | Industry (materials) |
| Pelkonen et al 1972 32 | 8 T1DM | 25.2 (19 to 70)# | IP, Finland | C | Met | No | 75 g/day (15% E) | Liquid | Starch | 40:40:20 | Neutral | 10 days | 7 | Agency |
| Bantle et al 1986 44 | 12 T1DM (6M:6F) | 23 (15 to 32) | IP, USA | C | Met | Yes | ≈97 g/day (21% E) | Mixed | Starch | 55:30:15 | Neutral | 8 days | 8 | Agency |
| Bantle et al 1986 44 | 12 T2DM (5M:7F) | 62 (36 to 84) | IP, USA | C | Met | Yes | ≈97 g/day (21% E) | Mixed | Starch | 55:30:15 | Neutral | 8 days | 8 | Agency |
| Crapo et al 1986 38 | 7 T2DM (3M:4F) | 51 (3) | IP/OP, USA | C | Met | No | ≈98 g/day (13.2% E) | Mixed | Sucrose | 55:30:15 | Neutral | 2 weeks | 7 | Agency, industry |
| Mcateer et al 1987 37 | 10 T2DM | 64.4 (54 to 71) | OP, Northern Ireland | C | Supp | No | 50 g/day (11.6% E) | Liquid | Starch | 42:38:20 | Neutral | 4 weeks | 7 | Industry (materials) |
| Osei et al 1987 42 | 18 T2DM (15M:3F) | 57 (9) | OP, USA | P | Supp | Yes | 60 g/day (10% E) | Liquid | Starch | 50:35:15 | Neutral | 12 weeks | 8 | Agency |
| Grigoresco et al 1988 43 | 8 T2DM (5M:3F) | 40 (20) | OP, France | C | Supp | Yes | 30 g/day (8% E) | Liquid | Starch | 50:30:20 | Neutral | 8 weeks | 8 | Agency, industry |
| Anderson et al 1989 36 | 14 T2DM (14M:0F) | 60 (15) | IP/OP, USA | C | Supp | No | ≈55 g/day (12% E) | Mixed | Starch | 55:25:20 | Neutral | 23 weeks | 8 | Agency, industry |
| Thorburn et al 1989 34 | 8 T2DM (4M:4F) | 55 (10) | IP, USA | P | Met | No | ≈100 g/day (13% E) | Mixed | Sucrose | 55:30:15 | Neutral | 12 weeks | 6 | Agency, industry |
| Osei et al 1989 41 | 13 T2DM (5M:8F) | 54 (11) | OP, USA | C | Supp | Yes | 60 g/day (7.5% E) | Mixed | Starch | 50:35:15 | Neutral | 26 weeks | 8 | Agency (salary award) |
| Blayo et al 1990 35 | ||||||||||||||
| Starch | 6 T1DM, 2 T2DM | 43 (11) | OP, France | P | Supp | Yes | ≈ 25 (∼5% E) | Mixed | Starch | 55:30:15 | Neutral | 52 weeks | 7 | Agency, industry |
| Sucrose | 3 T1DM, 3 T2DM | 51 (12) | Sucrose | |||||||||||
| Fructose | 5 T1DM, 1 T2DM | 48 (17) | ||||||||||||
| Bantle et al 1992 40 | 6 T1DM (3M:3F) | 23 (18 to 23) | OP, USA | C | Met | Yes | ≈120 (20% E) | Mixed | Starch | 55:30:15 | Neutral | 4 weeks | 8 | Agency, industry |
| Bantle et al 1992 40 | 12 T2DM (4M:8F) | 62 (40 to 72) | OP, USA | C | Met | Yes | ≈120 (20% E) | Mixed | Starch | 55:30:15 | Neutral | 4 weeks | 8 | Agency, industry |
| Koivisto and Yki-Jarvinen 1993 33 | 10 T2DM (4M:6F) | 61 (10) | IP, Finland | C | Met | Yes | ≈55 (20% E) | Liquid | Starch | 50:30:20 | Neutral | 4 weeks | 9 | Agency, industry |
| Malerbi et al 1996 46 | 16 T2DM (7M:9F) | 54.2 (34 to 66) | OP, Brazil | C | Supp | No | 63.2 (20% E) | Liquid | Starch | 55:30:15 | Neutral | 4 weeks | 7 | Agency, industry |
| Hypertriglyceridemia & insulin resistance | ||||||||||||||
| Kaufmann et al 1966 51 | 5 HTG (3M:2F) ** | 42.8 (14.2) | IP/OP, Israel | C | Met | No | 300 g/day (55% E) | Mixed | Starch | 77:5:18 | Neutral | ∼24-days | 7 | Agency |
| 3 HTG (2M:1F) | Sucrose | |||||||||||||
| Nestel et al 1970—Study1 50 | 3 HTG | 19 (0) | IP, Australia | C | Met | No | 50% to 52% E | Mixed | Glucose | 77:9:14 | Neutral | 1-week | 6 | Agency |
| Nestel et al 1970—Study 2 50 | 2 HTG | 19 (0) | IP, Australia | C | Met | No | 52% to 55% E | Mixed | Glucose | 77:9:14 | Neutral | 1-week | 6 | Agency |
| Nikkila and Kekki 1972 49 | 10 Type 4 HTG (5DM2) | 53.5 (26 to 67) | IP, Finland | C | Met | Yes | ≈77.5 (∼17% E) | Liquid | Starch | 45:35:20 | Neutral | 10 to 20-days | 6 | Agency |
| Sucrose | ||||||||||||||
| Turner et al 1979 (LC) 53 | 6 HTG (6M:0F) ** | 45.7 (7.7) | IP, USA | C | Met | No | ≈39.5 g/day (9% E) | Liquid | d-Maltose | 45:40:15 | Neutral | ∼2-weeks | 7 | Agency, industry |
| Turner et al 1979 (HC) 53 | 5 HTG (5M:0F) ** | 46.8 (8.0) | IP, USA | C | Met | No | ≈122 g/day (17% E) | Liquid | d-Maltose | 85:00:15 | Neutral | ∼2-weeks | 4 | Agency, industry |
| Cybulska and Naruszewicz 1982 55 | 16 Type 4 HTG | 57 (38 to 80) | OP, Poland | C | Supp | No | 80 g/day | Liquid | Starch | 45:40:15 | Neutral | 28-days | 7 | NR |
| Hallfrisch et al 1983 56 | 12 IR (12M:0F) | 39.5 (2.1) | IP/OP, USA | C | Met | No | 50 g/day (7.5% E) | Solid | Starch | 43:42:15 | Neutral | 5-weeks | 8 | NR |
| 100 g/day (15% E) | ||||||||||||||
| Koh et al 1988 54 | 9 IGT (3M, 6F) | 54 (18) | OP, USA | C | Supp | No | ≈64 (15% E) | Mixed | Glucose | 50 to 55:30 to 35:15 to 20 | Neutral | 4-weeks | 8 | NR |
| Reiser et al 1989 58 | 10 IR (10M:0F) | 47 | IP, USA | C | Met | No | 167 (20% E) | Solid | Starch | 51:36:13 | Neutral | 5-weeks | 4 | NR |
| Normal | ||||||||||||||
| Kaufmann et al 1966 51 | 4 N (3M:1F) | 42.8 (14.2) | IP/OP, Israel | C | Met | No | 300 (55% E) | Mixed | Starch | 77:5:18 | Neutral | ∼24-days | 7 | Agency |
| Sucrose | ||||||||||||||
| Forster and Heller 1973 60 | 12 N (8M:4F) | 20 to 26 | IP, Germany | C | Met | No | 162 g/day | Liquid | Glucose | 90:00:10 | Neutral | 10-days | 7 | NR |
| Forster and Heller 1973 60 | 6 N (4M:2F) | 20 to 26 | IP, Germany | C | Met | No | 162 g/day | Liquid | Glucose | 90:00:10 | Neutral | 10-days | 7 | NR |
| Huttunen et al 1976 48 | 68 N | 28 (7) | OP, Finland | P | Supp | No | 69 (14% E) | Mixed | Sucrose | — | Neutral | 95-weeks | 5 | NR |
| Hallfrisch et al 1983 56 | 12 N (12M:0F) | 39.8 | IP/OP, USA | C | Met | No | 50 g/day (7.5% E) | Solid | Starch | 43:42:15 | Neutral | 5-weeks | 8 | NR |
| 100 g/day (15% E) | ||||||||||||||
| Bossetti et al 1984 57 | 8 N (4M:4F) | 26.7 (20 to 32) | OP, USA | C | Met | Yes | ≈78.5 | Liquid | Sucrose | 35 to 49:35 to 45:12 to 20 | Neutral | 2-weeks | 8 | Agency |
| Koh et al 1988 54 | 9 N (3M, 6F) | 50 (15) | OP, USA | C | Supp | No | ≈78.5 (15% E) | Mixed | Glucose | 50 to 55:30 to 35:15 to 20 | Neutral | 4-weeks | 8 | NR |
| Reiser et al 1989 58 | 11 N (11M:0F) | 38 | IP, USA | C | Met | No | 167 (20% E) | Solid | Starch | 51:36:13 | Neutral | 5-weeks | 4 | NR |
| Swanson et al 1992 59 | 14 N (7M:7F) | 34 (19 to 60) | OP, Denmark | C | Met | Yes | ≈120 (20% E) | Mixed | Starch | 55:15:30 | Neutral | 4-weeks | 8 | Agency, industry |
| Bantle et al 2000 45 | 24 N (12M:12F) | M, 42.5; F, 40 | OP, USA | C | Met | Yes | 85 (17% E) | Mixed | Glucose | 55:30:15 | Neutral | 6-weeks | 9 | Agency |
| Sunehag et al 2002 47 | 12 N (6M:6F) | M, 15 (1.2); F, 14.5 (1.5) | IP/OP, USA | C | Met | Yes | 74.4 (12% E) | Mixed | Starch | 60:25:15 | Neutral | 1-week | 9 | Agency, industry |
| 151.32 (24% E) | ||||||||||||||
| Treuth et al 2003 52 | 6 N (6M:0F) | 15.3 (0.8) | OP, USA | C | Met | Yes | 128.5 (40% E) | Mixed | Starch | 60:25:15 | Neutral | 8-days | 9 | Agency, industry |
| 6 N (0M:6F) | 14.7 (1.2) | |||||||||||||
| Sunehag et al 2008 7 | 6 N (3M:3F) | 15.2 (1.2) | IP/OP, USA | C | Met | Yes | ≈149 (24% E) | Mixed | Starch | 60:25:15 | Neutral | 7-days | 9 | Agency, industry |
| Swarbrick et al 2008 8 | 7 OW/OB (0M:7F) | 50 to 72 | IP, USA | C | Met | No | ≈125 (25% E) | Liquid | Starch | 55:30:15 | Neutral | 10-weeks | 7 | Agency |
| Stanhope et al 2009 9 | 32 OW/OB (16M:16F) | 53 | IP/OP, USA | P | Met/Supp | No | ≈182 (+25% E) | Liquid | Glucose | 55:30:15 | Positive | 10-weeks | 6 | Agency |
| Ngo Sock et al 2010 10 | 11 N (11M:0F) | 24.6 (2) | OP, Switzerland | C | Met | Yes | ≈213 (+35% E) | Liquid | Glucose | 55:30:15 | Positive | 7-days | 8 | Agency |
| Brymora 2012 11 | 28 CKD (17M:11F) | 59 (15) | OP, Poland | C | DA | No | 53 (9% E) | Mixed | Starch | 55:30:15 | Neutral | 6-weeks | 8 | Agency |
| Madero et al 2011 12 | 131 OB (29M:102F) | 38.8 (8.8) | OP, Mexico | P | DA | Yes | ≈60 (13% to 14% E) | Solid (fruit) | Starch | 55:30:15 | Negative | 6-weeks | 7 | Agency |
| Silbernagel et al 2011 13 | 20 N (12M:8F) | 30.5 | OP, Germany | P | Supp | Yes | 150 (+22% E) | Liquid | Glucose | 50:35:15 | Positive | 4-weeks | 7 | Agency |
| Stanhope et al 2011 16 | 48 N (27M:21F) | 28.0 (27.2) | IP/OP, USA | P | Met/Supp | No | ≈168 (+25% E) | Liquid | Glucose | 55:30:15 | Positive | 2-weeks | 6 | Agency |
| HFCS | ||||||||||||||
| Aeberli et al 2013 14 | 9 N (9M) | 22.8 (21 to 25) | OP, Switzerland | C | Supp | Yes | 80 (≈14%) | Liquid | Glucose | 47 to 56:29 to 31:13 to 16 | Neutral | 3-weeks | 10 | Agency |
| Sucrose | ||||||||||||||
| Johnston et al 2013—A 15 | 32 OW (32M:0F) | 33.9 (10.0) | OP, UK | P | Met/Supp | Yes | ≈204 (25% E) | Liquid | Glucose | 55:30:15 | Neutral | 2-weeks | 10 | Agency |
| Johnston et al 2013—B 15 | 32 OW (32M:0F) | 33.9 (10.0) | OP, UK | P | Met/Supp | Yes | ≈204 (25% E) | Liquid | Glucose | 55:30:15 | Positive | 2-weeks | 10 | Agency |
| Heden et al 2014 17 | 40 N (20M:20F) | 17.9 (1.9) | OP, USA | C | Supp | Yes | 50 (≈10% E) | Liquid | Glucose | 50:34:16 | Positive | 2-weeks | 5 | Agency |
| Jin et al 2014 18 | 21 OW (11M:10F) | 13.6 (2.5) | OP, USA | P | Supp | Yes | 99 (≈20% E) | Liquid | Glucose | N/A | Neutral | 4-weeks | 7 | Agency |
| Hypercaloric feeding trials | ||||||||||||||
| Le et al 2006 61 | 7 N (7M:0F) | 24.7 (3.4) | OP, Switzerland | C | Supp | No | ≈+104 g/day (+18% E) | Liquid | Diet alone | 55:30:15 | Positive | 4-weeks | 7 | Agency, industry |
| Le et al 2009 62 | 8 N (8M:0F) | 24 (3) | OP, Switzerland | C | Supp | Yes | ≈+213 g/day (+35% E) | Liquid | Diet alone | 55:30:15 | Positive | 7-days | 8 | Agency, industry |
| 16 Off-T2DM (16M:0F) | 24.7 (5.2) | OP, Switzerland | C | Supp | Yes | ≈+213 g/day (+35% E) | Liquid | Diet alone | 55:30:15 | Positive | 7-days | 8 | Agency, industry | |
| Stanhope et al 2009 9** | 32 OW/OB (16M:16F) | 53 | IP/OP, USA | P | Supp | No | ≈182 g/day (25% E) | Liquid | Diet alone | 55:30:15 | Positive | 10-weeks | 5 | Agency |
| Ngo Sock et al 2010 10** | 11 N (11M:0F) | 24.6 | OP, Switzerland | C | Met | Yes | ≈213 g/day (+35% E) | Liquid | Diet alone | 55:30:15 | Positive | 7-days | 8 | Agency |
| Silbernagel et al 2011 13 | 20 N (12M:8F) | 30.5 | OP, Germany | C | Supp | Yes | 150 (21% to 25% E) | Liquid | Diet alone | 50:35:15 | Positive | 4-weeks | 7 | Agency |
| Stanhope et al 2011 16 | 16 N (9M:7F) | 28 | IP/OP, USA | C | Partial | No | ≈168 (25% E) | Liquid | Diet alone | 55:30:15 | Positive | 2-weeks | 6 | Agency |
| Johnston et al 2013 15 | 15 OW (15M:0F) | 35 | OP, UK | C | Supp | No | ≈204 (25% E) | Liquid | Diet alone | 55:30:15 | Positive | 2-weeks | 10 | Agency |
C indicates crossover; CKD, chronic kidney disease; DA, dietary advice; E, energy; F, female; HFCS, high fructose corn syrup; HTG, hypertriglyceridemic; IGT, impaired glucose tolerance; IP, inpatient; IR, insulin resistant; M, male; Met, metabolic; MQS, methodological quality score; N, normal; N/A, not available; NR, not reported; Off-T2DM, offspring of persons with type 2 diabetes mellitus; OP, outpatient; OW/OB, overweight/obese; P, parallel; Supp; supplemented; T1DM, type 1 diabetes mellitus.
Doses preceded by ” ≈” represent average doses calculated on the basis of the average reported energy intake or weight of participants. If these data were not available, then the average dose was based on a 2000-kcal intake. Plus signs indicate excess energy provided by fructose.
Fructose was provided as beverages or crystalline fructose to be added to beverages (Liquid), added to foods or consumed within the context of foods (Solid), or was a mixture of both liquid and solid forms (Mixed).
Comparators were the reference carbohydrate in the isocaloric trials and the control diet (weight-maintaining, background diet) alone without the added energy from fructose in the hypercaloric trials. Fructose was exchanged for the reference carbohydrate, providing an energy-matched comparison in the isocaloric trials, while it supplemented the control diet to provide excess energy in the hypercaloric trials.
Energy from carbohydrate:fat:protein.
Trials with a score ≥8 were considered to be of higher quality according to the Heyland MQS.27
Agency funding is that from government, university, or not-for-profit health agency sources.
Pelkonen et al32 age was based on 10 participants.
Four trials9,10,13,16 featured both isocaloric and hypercaloric comparisons. The isocaloric comparisons were balanced yet under hypercaloric conditions, in that both the fructose and glucose arms were matched for energy but fed under conditions of excess energy. In the hypercaloric comparisons, the fructose arm was fed under hypercaloric conditions whereas the background diet was fed under eucaloric, weight-maintaining conditions.
About half of the participants were healthy, 16% had hypertriglyceridemia or insulin resistance, and 20% had diabetes (the majority of which were type 2 diabetes). Patients tended to be young and middle aged (median [IQR] age=40.0 years [24.6 to 53.5 years] and 26.4 years [24.7 to 31.6 years]) in isocaloric and hypercaloric trials, respectively, with equal numbers of males and females (median male:female ratio=50:50) in isocaloric trials and were all males (median male:female ratio=100:0) in hypercaloric trials.
Crossover designs were used in 78% of isocaloric and in 88% of hypercaloric trials. Forty-seven percent of isocaloric and 50% of hypercaloric trials were randomized. Starch was the most common comparator (57%) while sucrose was used in 20%, glucose in 31%, maltose in 4%, and high fructose corn syrup in 2% of other comparisons in isocaloric trials. The control diet alone without added energy from fructose was the comparator in all hypercaloric trials. The diets provided a range of energy and macronutrient profiles. Comparisons made in the isocaloric trials were matched for energy and were provided under conditions of neutral energy balance (that is, both arms provided energy to maintain body weight) in the majority of comparisons. However, in 6 comparisons, both fructose and the comparator were provided under conditions of positive energy, and only 1 comparison had both fructose and the comparator provided under conditions of negative energy balance. Fructose was administered in fluid form in 45%, mixed in 45%, and solid in 10% of isocaloric trials, and at a median (IQR) dose of 97.0 g/day (60.8 to 151.0 g/day). In all hypercaloric trials, fructose was administered in fluid form at a median (IQR) dose of 193.0 g/day (163.5 to 213.0 g/day). The median (IQR) excess energy provided by the hypercaloric trials was +25% (+24% to 35%). A metabolic feeding control was used in 57% of isocaloric and 13% of hypercaloric trials; partial-metabolic feeding control was used in 8% and 13% and the remainder provided fructose as a supplement. The median (IQR) dietary follow-up was 4 weeks (2 to 5 weeks) for isocaloric and 2 weeks (1 to 4 weeks) for hypercaloric trials.
The majority of trials were of poor quality. The Heyland MQS was considered low (MQS<8) in 53% of isocaloric and 50% of hypercaloric trials. Lack of or poor description of randomization, nonconsecutive or poorly described patient selection, and absence of double-blinding contributed to lower scores. Funding of trials came from a combination of agency alone (47%), agency-industry sources (29%), industry alone (4%), or was not reported (20%).
Isocaloric Feeding Trials
Effect of fructose on LDL-C
Twenty-four reports (26 trials) provided data on the effect of fructose intake on LDL-C (Figure2). Primary pooled analyses showed that isocaloric exchange of fructose for other carbohydrate did not affect LDL (MD=0.03 mmol/L [95% CI: −0.05, 0.11], P=0.48). There was no evidence of statistically significant interstudy heterogeneity overall (I2=11%, P=0.31). Sensitivity analyses in which each study was removed or when correlation coefficients of 0.25 and 0.75 were used did not alter the results. Categorical subgroup analyses using metaregression analyses found significant effect modification by feeding control and fructose form (Figure S1). Neither categorical subgroup analyses at 60 g/day nor at 100 g/day found a significant effect modification by dose, and continuous dose response metaregression analyses did not reveal a significant dose response or threshold (Figures S1 and S10, Table S2). Dose response metaregression analyses explored with multivariate models confirmed the significant effect of fructose form found in categorical subgroup analyses; however, dose was not found to be dependent on fructose form (Table S2).
Figure 2.

Forest plots of the effect of fructose on LDL-C in isocaloric feeding trials. Pooled effect estimates are shown as diamonds. Data are expressed as MD with 95% CI using generic inverse variance random effects models. Interstudy heterogeneity was tested the Cochran Q statistic at a significance level of P<0.10 and quantified by the I2 statistic, where I2≥50% is considered to be evidence of substantial heterogeneity and ≥75% considerable heterogeneity. Any CHO denotes any carbohydrate comparator. HTG indicates hypertriglyceridemic; LDL-C, low density lipoprotein; MD, mean difference.
Effect of fructose on apo B
Seven reports (8 trials) provided data on the effect of fructose intake on apo B (Figure3). Primary pooled analyses showed no effect of fructose on apo B (MD=−0.04 mmol/L [95% CI: −0.18, 0.09], P=0.51) with evidence of statistically significant interstudy heterogeneity overall (I2=62%, P=0.01). Sensitivity analyses in which each study was removed or when correlation coefficients of 0.25 and 0.75 were used did not alter the results. Neither categorical subgroup analyses nor continuous multivariate metaregression analyses to investigate a dose response or threshold were significant (Figure S2 and Table S2).
Figure 3.

Forest plots of the effect of fructose on apo B in isocaloric feeding trials. Pooled effect estimates are shown as diamonds. Data are expressed as MD with 95% CI using generic inverse variance random effects models. Interstudy heterogeneity was tested by the Cochran Q statistic at a significance level of P<0.10 and quantified by the I2 statistic, where I2≥50% is considered to be evidence of substantial heterogeneity and ≥75% considerable heterogeneity. Any CHO denotes any carbohydrate comparator. apo B indicates apolipoprotein B; HTG, hypertriglyceridemic; MD, mean difference.
Effect of fructose on non-HDL-C
Twenty-five reports (27 trials) provided data on the effect of fructose intake on non-HDL-C (Figure4). Primary pooled analyses showed no effect of fructose on non-HDL-C (MD=0.02 mmol/L [95% CI: −0.05, 0.09], P=0.54) with evidence of statistically significant interstudy heterogeneity overall (I2=92%, P<0.01). Sensitivity analyses in which each study was removed or when correlation coefficients of 0.25 and 0.75 were used did not alter the results. Categorical subgroup analyses did not reveal evidence of effect modification in any subgroup except for metabolic feeding control and fructose form (Figure S3). Metaregression analyses showed that relative to other carbohydrates, fructose raised non-HDL-C under metabolic feeding conditions, or when the fructose was given in solid form. Neither categorical subgroup analyses at 60 g/day nor at 100 g/day found a significant effect modification by dose, and continuous dose response metaregression analyses did not reveal a significant dose response or threshold (Figures S3 and S10, Table S2). Dose response metaregression analyses explored with multivariate models confirmed the significant effect of fructose form found in categorical subgroup analyses; however, dose was not found to be dependent on fructose form (Table S2).
Figure 4.

Forest plots of the effect of fructose on non-HDL-C in isocaloric feeding trials. Pooled effect estimates are shown as diamonds. Data are expressed as MD with 95% CI using generic inverse variance random effects models. Interstudy heterogeneity was tested by the Cochran Q statistic at a significance level of P<0.10 and quantified by the I2 statistic, where I2≥50% is considered to be evidence of substantial heterogeneity and ≥75% considerable heterogeneity. Any CHO denotes any carbohydrate comparator. HDL-C indicates high density lipoprotein; HTG, hypertriglyceridemic; MD, mean difference; T2DM, type 2 diabetes mellitus.
Effect of fructose on triglycerides
Forty-one reports (51 trials) provided data on the effect of fructose intake on triglycerides (Figure5). Primary pooled analyses showed no effect of fructose on triglycerides (MD=0.01 mmol/L [95% CI: −0.05, 0.08], P=0.70) with evidence of statistically significant interstudy heterogeneity overall (I2=63%, P<0.01). Sensitivity analyses in which each study was removed or when correlation coefficients of 0.25 and 0.75 were used did not alter the results. Categorical subgroup analyses found that relative to other carbohydrates, fructose raised triglycerides under metabolic feeding control conditions and in trials with a crossover design (Figure S4). Neither categorical subgroup analyses at 60 g/day nor at 100 g/day found a significant effect modification by dose, and continuous dose response meta-regression analyses did not reveal a significant dose response or threshold (Figures S4 and S10, Table S2). Dose response metaregression analyses explored with multivariate models confirmed the significant effect of design found in categorical subgroup analyses; however, dose was not found to be dependent on design (Table S2).
Figure 5.

Forest plots of the effect of fructose on triglycerides in isocaloric feeding trials. Pooled effect estimates are shown as diamonds. Data are expressed as MD with 95% CI using generic inverse variance random effects models. Inter-study heterogeneity was tested by the Cochran Q statistic at a significance level of P<0.10 and quantified by the I2 statistic, where I2≥50% is considered to be evidence of substantial heterogeneity and ≥75% considerable heterogeneity. A, B refers to study A and study B (two separate trials) within the same report. Any CHO denotes any carbohydrate comparator. HTG indicates hypertriglyceridemic; MD, mean difference.
Effect of fructose on HDL-C
Twenty-four reports (28 trials) provided data on the effect of fructose intake on HDL-C (Figure6). Primary pooled analyses showed no effect of fructose on HDL-C (MD=0.00 [95% CI: −0.04, 0.04], P=0.98) with evidence of statistically significant interstudy heterogeneity overall (I2=47%, P=0.003). Sensitivity analyses in which each study was removed or when correlation coefficients of 0.25 and 0.75 were used did not alter the results. Categorical subgroup analyses showed that relative to other carbohydrates, fructose increased HDL-C when the comparator was starch and lowered HDL-C when the comparator was high fructose corn syrup, although there was only 1 study with high fructose corn syrup as comparator, or when both arms were designed to be isocaloric (ie, neutral energy balance) (Figure S5). Neither categorical subgroup analyses at 60 g/day nor at 100 g/day found a significant effect modification by dose, and continuous dose response metaregression analyses did not reveal a significant dose response or threshold (Figures S5 and S11, Table S2). Dose response metaregression analyses explored with multivariate models confirmed the significant effect of comparator found in categorical subgroup analyses, by showing a significant interaction between fructose and non-fructose-containing comparators. We then further explored the dose response relationship within each level of the covariate independently (non-fructose-containing or fructose-containing comparators). Although there was no significant dose response within trials using non-fructose-containing comparators (P=0.952) (Figure S11), there was a significant dose response within trials using fructose-containing comparators (P=0.014) (Figure S11). However, when an extreme outlier was removed, it was no longer significant (P=0.802).
Figure 6.

Forest plots of the effect of fructose on HDL-C in isocaloric feeding trials. Pooled effect estimates are shown as diamonds. Data are expressed as MD with 95% CI using generic inverse variance random effects models. Interstudy heterogeneity was tested by the Cochran Q statistic at a significance level of P<0.10 and quantified by the I2 statistic, where I2≥50% is considered to be evidence of substantial heterogeneity and ≥75% considerable heterogeneity. Any CHO denotes any carbohydrate comparator. HDL-C indicates high density lipoprotein; HTG, hypertriglyceridemic; MD, mean difference.
Hypercaloric Feeding Trials
Effect of fructose on LDL-C
Primary pooled analyses of the effect of fructose on LDL-C in 4 hypercaloric trials (Figure S6) showed no effect (MD=0.08 (95% CI: −0.22, 0.38), P=0.60) with evidence of statistically significant interstudy heterogeneity overall (I2=77%, P<0.01). Sensitivity analyses revealed that removal of Ngo Sock et al10 resulted in a significant LDL-C increasing effect of fructose with no evidence of significant interstudy heterogeneity. However, Ngo Sock et al was the only 1 out of 4 trials with a high quality score (MQS=8) and that was metabolically controlled and was 1 of the 2 of the 4 trials that was randomized. Sensitivity analyses where correlation coefficients of 0.25 and 0.75 were used did not alter the results. Categorical subgroup analyses and continuous multivariate metaregression analyses were not undertaken owing to the small number of trials.
Effect of fructose on apo B
Primary pooled analyses of the effect of fructose on apo B in 2 hypercaloric trials (Figure7) showed an apo B–increasing effect of fructose (MD=0.18 [95% CI: 0.05, 0.30], P=0.005) with no evidence of statistically significant interstudy heterogeneity overall (I2=0%, P=0.78). Sensitivity analyses in which each study was removed or when correlation coefficients of 0.25 and 0.75 were used did not alter the results. Categorical subgroup analyses and continuous multivariate metaregression analyses were not undertaken owing to the small number of trials.
Figure 7.
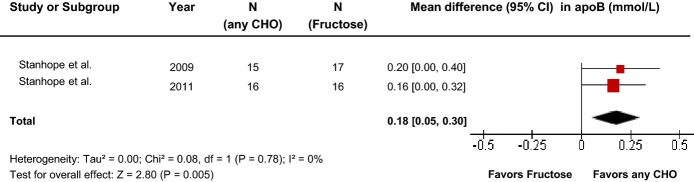
Forest plots of the effect of fructose on apo B in hypercaloric feeding trials. Pooled effect estimates are shown as diamonds. Data are expressed as MD with 95% CI using generic inverse variance random effects models. Interstudy heterogeneity was tested by the Cochran Q statistic at a significance level of P<0.10 and quantified by the I2 statistic, where I2≥50% is considered to be evidence of substantial heterogeneity and ≥75% considerable heterogeneity. Any CHO denotes any carbohydrate comparator. apo B indicates apolipoprotein B; MD, mean difference.
Effect of fructose on non-HDL-C
Primary pooled analyses of the effect of fructose on non-HDL-C in 2 hypercaloric trials (Figure S7) showed no effect (MD=0.07 [95% CI: −0.26, 0.39], P=0.69), with evidence of statistically significant interstudy heterogeneity overall (I2=93%, P<0.01). Sensitivity analyses in which each study was removed or when correlation coefficients of 0.25 and 0.75 were used did not alter the results. Categorical subgroup analyses and continuous multivariate metaregression analyses were not undertaken owing to the small number of trials.
Effect of fructose on triglycerides
Primary pooled analyses of the effect of fructose on triglycerides in 8 hypercaloric trials (Figure8) showed a triglyceride-increasing effect of fructose (MD=0.26 [95% CI: 0.11, 0.41], P<0.01) with evidence of statistically significant interstudy heterogeneity overall (I2=66%, P<0.01). Sensitivity analyses in which each study was removed or when correlation coefficients of 0.25 and 0.75 were used did not alter the results. Neither categorical subgroup analyses nor continuous multivariate metaregression analyses to investigate a dose response or threshold were significant; however, since the number of trials was small (<10), the analyses were likely underpowered (Figure S8 and Table S3).
Figure 8.
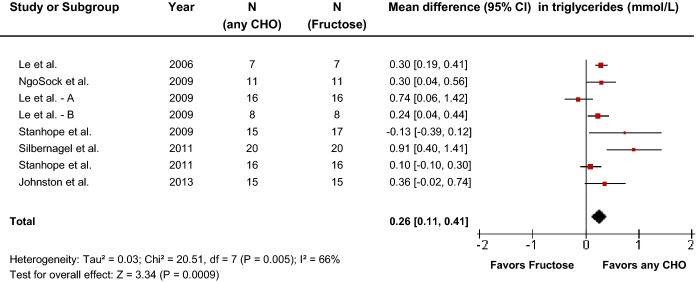
Forest plots of the effect of fructose on triglycerides in hypercaloric feeding trials. Pooled effect estimates are shown as diamonds. Data are expressed as mean difference with 95% CI using generic inverse variance random effects models. Interstudy heterogeneity was tested by the Cochran Q statistic at a significance level of P<0.10 and quantified by the I2 statistic, where I2≥50% is considered to be evidence of substantial heterogeneity and ≥75% considerable heterogeneity. Any CHO denotes any carbohydrate comparator.
Effect of fructose on HDL-C
Primary pooled analyses on the effect of fructose on HDL-C in 4 hypercaloric trials (Figure S9) showed no effect of fructose on HDL-C (MD=0.05 [95% CI: −0.07, 0.17], P=0.43) with no evidence of statistically significant interstudy heterogeneity overall (I2=0%, P=0.89). Sensitivity analyses in which each study was removed or when correlation coefficients of 0.25 and 0.75 were used did not alter the results. Categorical subgroup analyses and continuous multivariate metaregression analyses were not undertaken owing to the small number of trials.
Publication Bias
Funnel plots were examined for evidence of publication bias (Figures S12 and S13). There was no evidence of asymmetry or small study effects in either of the isocaloric or hypercaloric feeding trials for each lipid end point assessed by the Begg and Egger tests.
Discussion
This systematic review and meta-analysis assessed the effect of fructose on established lipid targets for cardiovascular disease (LDL-C, apo B, non-HDL-C) and metabolic syndrome (triglycerides and HDL-C) in 59 controlled feeding trials involving 1068 participants with varying metabolic phenotypes. Fructose in isocaloric trial comparisons, in which the amount of fructose was exchanged for an equal amount of a carbohydrate comparator, did not alter any of the lipid end points. However, fructose in hypercaloric trial comparisons, in which fructose supplemented control diets with excess calories compared with the same diets alone with the excess energy, did increase apo B and triglycerides. There was significant effect modification by several factors including study design, metabolic feeding control, comparator, fructose form, and energy balance, which modified the effect across certain end points.
Relation of Findings to Other Lines of Evidence
Although none of the previous systematic reviews and meta-analyses of the effect of fructose on lipids showed an overall effect of fructose in isocaloric exchange for other carbohydrates, they have demonstrated variable results. A dose response has been identified across all of the meta-analyses in this area. A recent meta-analysis by Zhang et al63 found no effect of fructose on LDL or HDL-C; however, it found that at doses >100 g/day, there was an LDL-increasing effect of fructose. We, however, published a letter of concern as the authors missed data from 11 trials and miscategorized the doses for 2 trials.64 Earlier meta-analyses of the effect of fructose on lipids found a fasting triglyceride-increasing effect of fructose only at >60 g/day6 in people with diabetes and of ≥100 g/day across individuals with different metabolic phenotypes.5 In the current meta-analysis, which includes 13 new additional trials, we were unable to reproduce these dose thresholds for harm, using both univariate and multivariate models.
Effect modification has also been seen for other subgroups in previous meta-analyses. Significant subgroup effects have been reported for fructose form for body weight,19 metabolic phenotype for postprandial triglycerides,20 and comparator, duration of follow-up, and design for triglycerides in those with diabetes.6 In the current meta-analysis, effect modification was observed by some of the same subgroups (fructose form and comparator) and several other subgroups (metabolic feeding control, study design, and energy balance) for specific end points. None adequately explained heterogeneity. Although the subgroups tend to be underpowered with few trials within each level, the inability of subgroups to explain heterogeneity and the lack of consistency in subgroups across end points suggests other factors may be contributing to the observed heterogeneity.
Limitations
Our systematic review and meta-analysis has several limitations. First, the durability of the effects is a concern since the median follow-up was 4-weeks for isocaloric trials and 2-weeks in hypercaloric trials, so the longstanding effects are unknown. Second, the median fructose dose administered was 96.8 g/day in isocaloric trials, which is well beyond the 95th percentile of intake, so the generalizability of the results is limited.65 Third, there were a limited number of subjects in the included studies, the majority of which were also of poor design and poor study quality (MQS<8 in 51% of trials). Most of the low-quality scores were attributable to a lack of or poor description of randomization, nonconsecutive or poorly described patient selection, and absence of blinding. However, no effect modification by study quality was seen in subgroup analyses. Fourth, end differences in the lipid end points rather than differences in lipid changes between trials groups were used owing to the data reported. Additionally, there was no evidence of baseline differences among trials (data not shown) or effect modification by randomization in subgroup analyses for any of the lipid end points. Fifth, imputations were required for both SDs or SEs of end values (11.5% of trials for LDL-C, 23.1% of trials for non-HDL-C, 37.5% of trials for apo B, 8.2% of trials for triglycerides, and 14.8% of trails for HDL-C) and of differences between end values due to missing study data (42.3% of trials for LDL-C, 100% of trials for non-HDL-C, 50% of trials for apo B, 65.3% of trials for triglycerides, and 63% of trials for HDL-C). Sixth, only one trial was identified that used high fructose corn syrup as a comparator, which is surprising since it is a dominant sweetener in the United States.66 Seventh, the subgroup analyses were underpowered. Although we did attempt to explore the relative contribution of the subgroups with meta-regression models, there are limitations performing these with so few studies. Seventh, since only published studies were included, publication bias may be a possibility, although there was no bias noted upon inspection of funnel plots and no evidence as assessed by the Begg and Egger tests. However, for the analysis of isocaloric trials of apo B and for all end points in the hypercaloric trial analyses, the number of trials was small (<10), and therefore the possibility of publication bias is difficult to determine. Finally, there was considerable heterogeneity in the analysis of apoB, non-HDL-C, triglycerides, and HDL-C, which was unexplained by sensitivity analyses or any of the subgroup analyses. It is possible that there may be other dietary factors contributing to the large heterogeneity, including viscous soluble dietary fiber,67,68 dietary pulses,29 nuts,69 garlic,70 or combination of these in some dietary patterns, such as the dietary portfolio,71 all of which have been shown to modify lipid responses. Overall, there remains a need for larger, longer, higher quality trials to address the sources of uncertainty that remain across the different analyses to date related to feeding control, fructose form, study design, and comparator.
Implications and Clinical Relevance
The American Heart Association3 and Canadian Diabetes Association 4 in their most recent guidance have taken a harm reduction approach with fructose, setting upper limits for intake based on its ability to raise fasting and postprandial triglycerides. The thresholds for intake were based on earlier meta-analyses by Livesey and Taylor5 from 2008 (100 g/day) and Sievenpiper6 from 2009 (60 g/day). The present systematic review and meta-analysis serves to update these earlier meta-analyses and improve on their eligibility criteria by extending the minimum follow-up (diet duration) requirement. Unlike Livesey and Taylor, where there was no restriction on length of follow-up and thus permitted the inclusion of acute and very short-term trials, we only considered trials ≥7 days. Since their analysis, we identified an additional 13 new trials that met these eligibility criteria. The advantage of including more trials is that it improves the precision of the summary estimates of the effect of fructose on lipids. The inclusion of more recent trials also allows for the control of energy in the analyses, as hypercaloric trials were only published after the census date of the Livesey and Taylor systematic review and meta-analysis (June 2006).5 As a result of this update, our systematic review and meta-analysis has arrived at a different set of conclusions. Fructose in isocaloric exchange for other carbohydrates did not show a triglyceride-raising effect across a wide dose range (median, 97.0 g/day; IQR, 60.8 to 151.0 g/day). Continuous univariate and multivariate meta-regression models also failed to identify thresholds for either fasting triglycerides, as presented in the current analysis, or postprandial triglycerides, as we have recently published.20 This lack of effect extended to established lipid targets (LDL-C, apo B, non-HDL-C, and HDL-C), as long as the comparisons were matched for calories. Therefore, based on the most up to date evidence, it appears unwarranted to set specific restrictions on the intake of fructose in the context of lipid effects. In our analyses, we did, however, show that fructose supplementing diets with excess calories (IQR, 24% to 35%) at high doses (IQR, 163.5 to 213.0 g/day) do increase both fasting and postprandial triglycerides, as well as apo B. This effect, however, is no different than what would be expected when overfeeding any other carbohydrate that might replace fructose. A subset of 5 of the isocaloric trials included in our systematic reviews and meta-analyses9,10,13,15,16 used diets providing excess energy (positive energy balance) in both the added fructose and carbohydrate comparator (starch or glucose) arms, thus permitting the effect of added fructose to be isolated from that of energy under matched yet excess energy feeding conditions. When we restricted our meta-analyses to these trials, there was no evidence of harm with added fructose providing excess energy as long as the comparison with the carbohydrate comparator (starch and glucose) was matched for the excess energy. As a result, there was no significant effect modification by energy balance in post hoc subgroup analyses of the isocaloric trials. Future guideline development may wish to focus on the provision of excess calories whether it be from fructose or any other high glycemic index carbohydrate (starch or glucose) as opposed to a specific dose. There is also a need to focus on other nutritional factors, foods, and dietary patterns that may modify lipid responses.29,67–71
Conclusions
Overall, the updated evidence for the effect of fructose on established lipid targets for cardiovascular disease risk reduction does not support earlier identified thresholds on which current clinical practice guidelines are based. There was no significant effect of fructose on LDL-C, non-HDL-C, apo B, triglycerides, or HDL-C in isocaloric comparisons with other carbohydrates across individuals with different metabolic phenotypes. There was, however, evidence of a significant triglyceride and apo B–raising effect in hypercaloric comparisons in which fructose supplemented diets with excess calories. In the absence of an effect in isocaloric comparisons, the effect of fructose seen in hypercaloric comparisons appears more attributable to the calories rather than fructose per se. Clinical practice guidelines, which are currently based on earlier meta-analyses, may wish to consider these current findings in their updates. There remains a need for larger, longer, higher quality trials that assess whether fructose has a meaningful effect on established lipid targets under ad libitum conditions, where fructose-containing sugars freely replace other sources of calories at real-world levels of exposure.
Acknowledgments
We wish to thank Teruko Kishibe for her help in the development of search terms used.
Sources of Funding
This work was funded by a Canadian Institutes of Health Research (CIHR) Knowledge Synthesis grant (funding reference number, 102078) and a research grant from the Calorie Control Council. Ha was funded by a Province of Ontario Graduate Scholarships, CIHR Frederick Banting and Charles Best Canada Graduate Scholarships Doctoral Award, and McMaster University Scholarship. Cozma was funded by a Province of Ontario Graduate Scholarship, CIHR Frederick Banting and Charles Best Canada Graduate Scholarships Master’s Award and Banting and Best Diabetes Centre (BBDC)-Novo Nordisk Studentship. de Souza was funded by a CIHR Postdoctoral Fellowship Award. D.J.A. Jenkins was funded by the Government of Canada through the Canada Research Chair Endowment. Sievenpiper was funded by a PSI Foundation Graham Farquharson Knowledge Translation Fellowship and Canadian Diabetes Association Clinician Scientist Award. None of the sponsors had a role in any aspect of the present study, including design and conduct of the study; collection, management, analysis, and interpretation of the data; and preparation, review, decision to publish, or approval of the manuscript.
Disclosures
Chiavaroli has received research support from the Canadian Institutes of Health Research (CIHR) and is a clinical research coordinator at Glycemic Index Laboratories, Toronto, Ontario, Canada. Ha has received funding from the CIHR, McMaster University, Province of Ontario, and the University of Toronto. She is the recipient of The Ashbaugh Graduate Scholarship. She has received payment from the World Health Organization (WHO) for work on a systematic review and meta-analysis commissioned by the WHO for work on the relation of saturated fatty acids with health outcomes. She and her colleagues received a cash prize for placing second in the regional “Mission Impulsible” Competition where they conceived and developed a marketable food product that contained dietary pulses. She received a travel award to attend the “Journey Through Science Day” hosted by PepsiCo and the New York Academy of Sciences as well as the Nutrica Travel Award from the Diabetes and Nutrition Study Group (DNSG) of the European Association for the Study of Diabetes (EASD). de Souza was funded by a CIHR Postdoctoral Fellowship Award and has received research support from the CIHR, the Calorie Control Council (CCC), the Canadian Foundation for Dietetic Research, and the Coca-Cola Company (investigator initiated, unrestricted grant). He has served as an external resource person to WHO’s Nutrition Guidelines Advisory Group and received travel support from WHO to attend group meetings. He is the lead author of 2 systematic reviews and meta-analyses commissioned by WHO on the relation of saturated fatty acids and trans fatty acids with health outcomes. A.L. Jenkins is part owner and vice-president of Glycemic Laboratories, Inc, a clinical research organization. She has received grant support from the Canadian Diabetes Association (CDA). Wolever is a part owner and the President of Glycemic Index Laboratories, Inc, Toronto, Canada, and has authored several popular diet books on the glycemic index for which he has received royalties from Phillipa Sandall Publishing Services and CABI Publishers. He has received consultant fees, honoraria, travel funding, or research support from or served on the scientific advisory board for CIHR, CDA, Dairy Farmers of Canada, McCain Foods, Temasek Polytechnic, Northwestern University, Royal Society of London, Glycemic Index Symbol program, CreaNutrition AG, McMaster University, Canadian Society for Nutritional Sciences, National Sports and Conditioning Association, Faculty of Public Health and Nutrition—Autonomous University of Nuevo Leon, Diabetes and Nutrition Study Group (DNSG) of the European Association for the Study of Diabetes (EASD). Beyene has received research support from the CIHR, CCC, and The Coca-Cola Company (investigator initiated, unrestricted). Kendall has received research support from the Advanced Foods and Material Network, Agrifoods and Agriculture Canada, the Almond Board of California, the American Pistachio Growers, Barilla, the California Strawberry Commission, the CCC, CIHR, the Canola Council of Canada, the Coca-Cola Company (investigator initiated, unrestricted grant), Hain Celestial, the International Tree Nut Council Nutrition Research and Education Foundation, Kellogg, Kraft, Loblaw Companies Ltd, Orafti, Pulse Canada, Saskatchewan Pulse Growers, Solae, and Unilever. He has received travel funding, consultant fees, or honoraria from Abbott Laboratories, the Almond Board of California, the American Peanut Council, the American Pistachio Growers, Barilla, Bayer, the Canola Council of Canada, the Coca-Cola Company, Danone, General Mills, the International Tree Nut Council Nutrition Research and Education Foundation, Kellogg, Loblaw Companies Ltd, Nutrition Foundation of Italy (NFI), Oldways Preservation Trust, Orafti, Paramount Farms, the Peanut Institute, PepsiCo, Pulse Canada, Sabra Dipping Co, Saskatchewan Pulse Growers, Solae, Sun-Maid, Tate and Lyle, and Unilever. He is on the Dietary Guidelines Committee for the DNSG of the EASD and has served on the scientific advisory board for the Almond Board of California, the International Tree Nut Council, Oldways Preservation Trust, Paramount Farms, and Pulse Canada. He is a member of the International Carbohydrate Quality Consortium (ICQC) and Board Member of the DNSG of the EASD. D.J.A. Jenkins has received research grants from Saskatchewan Pulse Growers, the Agricultural Bioproducts Innovation Program through the Pulse Research Network, the Advanced Foods and Material Network, Loblaw Companies Ltd, Unilever, Barilla, the Almond Board of California, Agriculture and Agri-food Canada, Pulse Canada, Kellogg’s Company, Canada, Quaker Oats, Canada, Procter & Gamble Technical Centre Ltd., Bayer Consumer Care, Springfield, NJ, Pepsi/Quaker, International Nut & Dried Fruit (INC), Soy Foods Association of North America, the Coca-Cola Company (investigator initiated, unrestricted grant), Solae, Haine Celestial, the Sanitarium Company, Orafti, the International Tree Nut Council Nutrition Research and Education Foundation, the Peanut Institute, the Canola and Flax Councils of Canada, the CCC, the CIHR, the Canada Foundation for Innovation, and the Ontario Research Fund. He has been on the speaker’s panel, served on the scientific advisory board and/or received travel support and/or honoraria from the Almond Board of California, Canadian Agriculture Policy Institute, Loblaw Companies Ltd, the Griffin Hospital (for the development of the NuVal scoring system, the Coca-Cola Company, Saskatchewan Pulse Growers, Sanitarium Company, Orafti, the Almond Board of California, the American Peanut Council, the International Tree Nut Council Nutrition Research and Education Foundation, the Peanut Institute, Herbalife International, Pacific Health Laboratories, Nutritional Fundamental for Health, Barilla, Metagenics, Bayer Consumer Care, Unilever Canada and Netherlands, Solae, Kellogg, Quaker Oats, Procter & Gamble, the Coca-Cola Company, EPICURE, the Griffin Hospital, Abbott Laboratories, the Canola Council of Canada, Dean Foods, the California Strawberry Commission, Haine Celestial, PepsiCo, the Alpro Foundation, Pioneer Hi-Bred International, DuPont Nutrition and Health, Spherix Consulting and WhiteWave Foods, the Advanced Foods and Material Network, the Canola and Flax Councils of Canada, the Nutritional Fundamentals for Health, Agri-Culture and Agri-Food Canada, the Canadian Agri-Food Policy Institute, Pulse Canada, the Saskatchewan Pulse Growers, the Soy Foods Association of North America, the Nutrition Foundation of Italy (NFI), Nutra-Source Diagnostics, the McDougall Program, the Toronto Knowledge Translation Group (St. Michael’s Hospital), the Canadian College of Naturopathic Medicine, The Hospital for Sick Children, the Canadian Nutrition Society (CNS), the American Society of Nutrition (ASN), Arizona State University, Paolo Sorbini Foundation, and the Institute of Nutrition, Metabolism and Diabetes. He received an honorarium from the US Department of Agriculture to present the 2013 W.O. Atwater Memorial Lecture. He received the 2013 Award for Excellence in Research from the International Nut and Dried Fruit Council. He received funding and travel support from the Canadian Society of Endocrinology and Metabolism to produce mini cases for the CDA. He is a member of the ICQC. His wife, ALJ, is a director and partner of Glycemic Index Laboratories, Inc, and his sister received funding through a grant from the St. Michael’s Hospital Foundation to develop a cookbook for one of his studies. Sievenpiper has received research support from the CIHR, CCC, American Society of Nutrition (ASN), CDA, The Coca-Cola Company (investigator initiated, unrestricted), Dr Pepper Snapple Group (investigator initiated, unrestricted), Pulse Canada, and The International Tree Nut Council Nutrition Research & Education Foundation. He has received reimbursement of travel expenses, speaker fees, and/or honoraria from the American Heart Association, American College of Physicians, ASN, National Institute of Diabetes and Digestive and Kidney Diseases, CDA, Canadian Nutrition Society, University of South Carolina, University of Alabama at Birmingham, Oldways Preservation Trust, Nutrition Foundation of Italy, CCC, DNSG of the EASD, International Life Sciences Institute (ILSI) North America, ILSI Brazil, Abbott Laboratories, Pulse Canada, Canadian Sugar Institute, Dr Pepper Snapple Group, The Coca-Cola Company, Corn Refiners Association, World Sugar Research Organization, Dairy Farmers of Canada, Società Italiana di Nutrizione Umana, III World Congress of Public Health Nutrition, C3 Collaborating for Health, White Wave Foods, Rippe Lifestyle, and mdBriefcase. He has ad hoc consulting arrangements with Winston & Strawn LLP, Perkins Coie LLP, and Tate & Lyle. He is on the Clinical Practice Guidelines Expert Committee for Nutrition Therapy of both the CDA and EASD, and Canadian Cardiovascular Society, as well as being on an ASN writing panel for a scientific statement on sugars. He is a member of the International Carbohydrate Quality Consortium (ICQC) and Board Member of the DNSG of the EASD. He serves an unpaid scientific advisor for the ILSI North America, Food, Nutrition, and Safety Program and the Technical Committee on Carbohydrates. His wife is an employee of Unilever Canada. None of the other authors had a relevant disclosure to report.
Supporting Information
Table S1. Search Strategy to identify controlled feeding trials on the effect of fructose on lipids
Table S2. Dose Response Models by Multivariate Meta-Regression of Isocaloric Trials*
Table S3. Dose Response Models by Multivariate Meta-Regression of Hypercaloric Trials*
Figure S1. Subgroup analyses in isocaloric feeding trials investigating the effect of isocaloric exchange of fructose for other sources of carbohydrate (CHO) on LDL-C. Data are weighted mean differences (MD) with 95% CI. Point estimates for each subgroup level (diamonds) are the pooled effect estimates. The dashed line represents the pooled effect estimate for the overall (total) analysis. The residual I2 value indicates the interstudy heterogeneity unexplained by the subgroup. Pairwise between-subgroup mean differences (95% CIs) for comparators were as follows: −0.11 mmol/L (−0.28, 0.07) (1 vs 2) to −0.09 mmol/L (−0.46, 0.27) (1 vs 3) to −0.41 mmol/L (−0.77, −0.05) (1 vs 4)* to −0.20 mmol/L (−0.63, 0.23) (2 vs 3) to −0.51 mmol/L (−0.94, −0.09) (2 vs 4)* to and −0.50 mmol/L (−1.03, 0.04) (3 vs 4). LDL-C indicates low-density lipoprotein cholesterol; MQS, Heyland Methodological Quality Score. *Statistically significant pairwise subgroup effect modification by meta-regression analyses (P<0.05).
Figure S2. Subgroup analyses in isocaloric feeding trials investigating the effect of isocaloric exchange of fructose for other sources of carbohydrate (CHO) on apo B. Data are weighted mean differences (MD) with 95% CI. Point estimates for each subgroup level (diamonds) are the pooled effect estimates. The dashed line represents the pooled effect estimate for the overall (total) analysis. The residual I2 value indicates the interstudy heterogeneity unexplained by the subgroup. Pairwise between-subgroup mean differences (95% CIs) for comparators were as follows: 0.06 mmol/L (−0.36, 0.47) (1 vs 2) to 0.05 mmol/L (−0.67, 0.76) (1 vs 3) to −0.13 mmol/L (−0.74, 0.47) (1 vs 4) to 0.10 mmol/L (−0.81, 1.01) (2 vs 3) to −0.08 mmol/L (−0.91, 0.75) (2 vs 4) to and −0.09 mmol/L (−1.1, 0.92) (3 vs 4). apoB indicates apo lipoprotein B; MQS, Heyland Methodological Quality Score. *Statistically significant pairwise subgroup effect modification by meta-regression analyses (P<0.05).
Figure S3. Subgroup analyses in isocaloric feeding trials investigating the effect of isocaloric exchange of fructose for other sources of carbohydrate (CHO) on non-HDL-C. Data are weighted mean differences (MD) with 95% CI. Point estimates for each subgroup level (diamonds) are the pooled effect estimates. The dashed line represents the pooled effect estimate for the overall (total) analysis. The residual I2 value indicates the interstudy heterogeneity unexplained by the subgroup. Pairwise between-subgroup mean differences (95% CIs) for comparators were as follows: −0.02 mmol/L (−0.26, 0.23) (1 vs 2) to −0.03 mmol/L (−0.33, 0.26) (1 vs 3) to −0.44 mmol/L (−1.02, 0.15) (1 vs 4) to −0.05 mmol/L (−0.48, 0.39) (2 vs 3) to −0.45 mmol/L (−1.12, 0.21) (2 vs 4) to and −0.47 mmol/L (−1.16, 0.22) (3 vs 4). Non-HDL-C, non–high-density lipoprotein cholesterol; MQS, Heyland Methodological Quality Score. *Statistically significant pairwise subgroup effect modification by meta-regression analyses (P<0.05).
Figure S4. Subgroup analyses in isocaloric feeding trials investigating the effect of isocaloric exchange of fructose for other sources of carbohydrate (CHO) on triglycerides. Data are weighted mean differences (MD) with 95% CI. Point estimates for each subgroup level (diamonds) are the pooled effect estimates. The dashed line represents the pooled effect estimate for the overall (total) analysis. The residual I2 value indicates the interstudy heterogeneity unexplained by the subgroup. Pairwise between-subgroup mean differences (95% CIs) for comparators were as follows: −0.11 mmol/L (−0.31, 0.09) (1 vs 2) to −0.11 mmol/L (−0.34, 0.12) (1 vs 3) to −0.18 mmol/L (−0.70, 0.35) (1 vs 4) to −0.46 mmol/L (−1.77, 0.85) (1 vs 5) to −0.21 mmol/L (−0.57, 0.14) (2 vs 3) to −0.28 mmol/L (−0.87, 0.30) (2 vs 4) to −0.56 mmol/L (−1.90, 0.77) (2 vs 5) to −0.29 mmol/L (−0.89, 0.31) (3 vs 4) to −0.57 mmol/L (−1.91, 0.78) (3 vs 5) and to −0.64 mmol/L (−2.06, 0.79) (4 vs 5). MQS, Heyland Methodological Quality Score. *Statistically significant pairwise subgroup effect modification by meta-regression analyses (P<0.05).
Figure S5. Subgroup analyses in isocaloric feeding trials investigating the effect of isocaloric exchange of fructose for other sources of carbohydrate (CHO) on HDL-C. Data are weighted mean differences (MD) with 95% CI. Point estimates for each subgroup level (diamonds) are the pooled effect estimates. The dashed line represents the pooled effect estimate for the overall (total) analysis. The residual I2 value indicates the interstudy heterogeneity unexplained by the subgroup. Pairwise between-subgroup mean differences (95% CIs) for comparators were as follows: −0.05 mmol/L (−0.12, 0.02) (1 vs 2) to −0.04 mmol/L (−0.15, 0.08) (1 vs 3) to −1.85 mmol/L (−2.10, −1.60)* (1 vs 4) to −0.09 mmol/L (−0.24, 0.07) (2 vs 3) to −1.90 mmol/L (−2.17, −1.63)* (2 vs 4) to and −1.89 mmol/L (−2.17, −1.60)* (3 vs 4). HDL-C indicates high-density lipoprotein cholesterol; MQS, Heyland Methodological Quality Score. *Statistically significant pairwise subgroup effect modification by meta-regression analyses (P<0.05).
Figure S6. Forest plots of the effect of fructose on LDL-C in hypercaloric feeding trials. Pooled effect estimates are shown as diamonds. Data are expressed as weighted MD with 95% CI using generic inverse variance random effects models. Interstudy heterogeneity was tested by Cochrane’s Q statistics (χ2 test) at a significance level of P<0.10 and quantified by I2, where I2≥50% is considered to be evidence of substantial heterogeneity and ≥75% considerable heterogeneity. Any CHO denotes any carbohydrate comparator. LDL-C indicates low-density lipoprotein cholesterol.
Figure S7. Forest plots of the effect of fructose on non-HDL-C in hypercaloric feeding trials. Pooled effect estimates are shown as diamonds. Data are expressed as weighted MD with 95% CI using generic inverse variance random effects models. Interstudy heterogeneity was tested by Cochrane’s Q statistics (χ2 test) at a significance level of P<0.10 and quantified by I2, where I2≥50% is considered to be evidence of substantial heterogeneity and ≥75% considerable heterogeneity. Any CHO denotes any carbohydrate comparator. HDL-C indicates high-density lipoprotein cholesterol.
Figure S8. Subgroup analyses in hypercaloric feeding trials investigating the effect of hypercaloric exchange of fructose for other sources of carbohydrate (CHO) on triglycerides. Data are mean differences (MD) with 95% CI. Point estimates for each subgroup level (diamonds) are the pooled effect estimates. The dashed line represents the pooled effect estimate for the overall (total) analysis. The residual I2 value indicates the interstudy heterogeneity unexplained by the subgroup. MQS indicates Heyland Methodological Quality Score. *Statistically significant pairwise subgroup effect modification by meta-regression analyses (P<0.05).
Figure S9. Forest plots of the effect of fructose on HDL-C in hypercaloric feeding trials. Pooled effect estimates are shown as diamonds. Data are expressed as weighted mean differences (MD) with 95% CI using generic inverse variance random effects models. Interstudy heterogeneity was tested by Cochrane’s Q statistics (χ2 test) at a significance level of P<0.10 and quantified by I2, where I2≥50% is considered to be evidence of substantial heterogeneity and ≥75% considerable heterogeneity. Any CHO denotes any carbohydrate comparator. HDL-C indicates high-density lipoprotein cholesterol.
Figure S10. Dose response meta-regression analyses for isocaloric trials on (A) LDL-C, (B) apoB, (C) non-HDL-C, and (D) triglycerides. HDL-C indicates high-density lipoprotein cholesterol; LDL-C, low-density lipoprotein cholesterol.
Figure S11. Dose response meta-regressions for isocaloric trials of HDL-C including (A) all isocaloric trials on HDL-C (P=0.084), (B) only those with non-fructose-containing comparators (P=0.952), and (C) only those with fructose-containing comparators (P=0.014). When the one outlier is removed from the analysis in (C), P=0.802. HDL-C indicates high-density lipoprotein cholesterol.
Figure S12. Funnel plots of the effect of fructose on established lipid targets: (A) low-density lipoprotein cholesterol (LDL-C), (B) non–high-density lipoprotein cholesterol (non-HDL-C), (C) apo lipoprotein B (apo B), and (D) HDL-C in isocaloric feeding trials. The solid line represents the pooled effect estimate expressed as the weighted mean difference (MD) for each analysis. The fitted line corresponds to the best-fit regression of the standard normal deviate of the fructose effect estimate against its precision (Egger’s test). Dashed lines present pseudo-95% confidence limits.
Figure S13. Funnel plots of the effect of fructose on established lipid targets: (A) triglycerides in isocaloric feeding trials and (B) triglycerides in hypercaloric feeding trials. The solid line represents the pooled effect estimate expressed as the weighted mean difference (MD) for each analysis. The fitted line corresponds to the best-fit regression of the standard normal deviate of the fructose effect estimate against its precision (Egger’s test). Dashed lines present pseudo-95% confidence limits.
References
- Lustig RH. Fructose: metabolic, hedonic, and societal parallels with ethanol. J Am Diet Assoc. 2010;110:1307–1321. doi: 10.1016/j.jada.2010.06.008. [DOI] [PubMed] [Google Scholar]
- Goran MI, Ulijaszek SJ, Ventura EE. High fructose corn syrup and diabetes prevalence: a global perspective. Glob Public Health. 2013;8:55–64. doi: 10.1080/17441692.2012.736257. [DOI] [PubMed] [Google Scholar]
- Miller M, Stone NJ, Ballantyne C, Bittner V, Criqui MH, Ginsberg HN, Goldberg AC, Howard WJ, Jacobson MS, Kris-Etherton PM, Lennie TA, Levi M, Mazzone T, Pennathur S American Heart Association Clinical Lipidology T, Prevention Committee of the Council on Nutrition PA, Metabolism, Council on Arteriosclerosis T, Vascular B, Council on Cardiovascular N, Council on the Kidney in Cardiovascular Disease. Triglycerides and cardiovascular disease: a scientific statement from the American Heart Association. Circulation. 2011;123:2292–2333. doi: 10.1161/CIR.0b013e3182160726. [DOI] [PubMed] [Google Scholar]
- Canadian Diabetes Association Clinical Practice Guidelines Expert Committee. Canadian Diabetes Association 2013 clinical practice guidelines for the prevention and management of diabetes in Canada. Can J Diabetes. 2013;37(suppl 1):S1–S212. doi: 10.1016/j.jcjd.2013.01.009. [DOI] [PubMed] [Google Scholar]
- Livesey G, Taylor R. Fructose consumption and consequences for glycation, plasma triacylglycerol, and body weight: meta-analyses and meta-regression models of intervention studies. Am J Clin Nutr. 2008;88:1419–1437. doi: 10.3945/ajcn.2007.25700. [DOI] [PubMed] [Google Scholar]
- Sievenpiper JL, Carleton AJ, Chatha S, Jiang HY, de Souza RJ, Beyene J, Kendall CWC, Jenkins DJA. Heterogeneous effects of fructose on blood lipids in individuals with type 2 diabetes: systematic review and meta-analysis of experimental trials in humans. Diabetes Care. 2009;32:1930–1937. doi: 10.2337/dc09-0619. [DOI] [PMC free article] [PubMed] [Google Scholar]
- Sunehag AL, Toffolo G, Campioni M, Bier DM, Haymond MW. Short-term high dietary fructose intake had no effects on insulin sensitivity and secretion or glucose and lipid metabolism in healthy, obese adolescents. J Pediatr Endocrinol. 2008;21:225–235. doi: 10.1515/jpem.2008.21.3.225. [DOI] [PubMed] [Google Scholar]
- Swarbrick MM, Stanhope KL, Elliott SS, Graham JL, Krauss RM, Christiansen MP, Griffen SC, Keim NL, Havel PJ. Consumption of fructose-sweetened beverages for 10 weeks increases postprandial triacylglycerol and apolipoprotein-B concentrations in overweight and obese women. Br J Nutr. 2008;100:947–952. doi: 10.1017/S0007114508968252. [DOI] [PMC free article] [PubMed] [Google Scholar]
- Stanhope KL, Schwarz JM, Keim NL, Griffen SC, Bremer AA, Graham JL, Hatcher B, Cox CL, Dyachenko A, Zhang W, McGahan JP, Seibert A, Krauss RM, Chiu S, Schaefer EJ, Ai M, Otokozawa S, Nakajima K, Nakano T, Beysen C, Hellerstein MK, Berglund L, Havel PJ. Consuming fructose-sweetened, not glucose-sweetened, beverages increases visceral adiposity and lipids and decreases insulin sensitivity in overweight/obese humans. J Clin Invest. 2009;119:1322–1334. doi: 10.1172/JCI37385. [DOI] [PMC free article] [PubMed] [Google Scholar]
- Ngo Sock ET, Lê KA, Ith M, Kreis R, Boesch C, Tappy L. Effects of a short-term overfeeding with fructose or glucose in healthy young males. Br J Nutr. 2010;103:939–943. doi: 10.1017/S0007114509992819. [DOI] [PubMed] [Google Scholar]
- Brymora A, Flisinski M, Johnson RJ, Goszka G, Stefanska A, Manitius J. Low-fructose diet lowers blood pressure and inflammation in patients with chronic kidney disease. Nephrol Dial Transplant. 2012;27:608–612. doi: 10.1093/ndt/gfr223. [DOI] [PMC free article] [PubMed] [Google Scholar]
- Madero M, Arriaga JC, Jalal D, Rivard C, McFann K, Perez-Mendez O, Vazquez A, Ruiz A, Lanaspa MA, Jimenez CR, Johnson RJ, Lozada LG. The effect of two energy-restricted diets, a low-fructose diet versus a moderate natural fructose diet, on weight loss and metabolic syndrome parameters: a randomized controlled trial. Metabolism. 2011;60:1551–1559. doi: 10.1016/j.metabol.2011.04.001. [DOI] [PubMed] [Google Scholar]
- Silbernagel G, Machann J, Unmuth S, Schick F, Stefan N, Haring HU, Fritsche A. Effects of 4-week very-high-fructose/glucose diets on insulin sensitivity, visceral fat and intrahepatic lipids: an exploratory trial. Br J Nutr. 2011;106:79–86. doi: 10.1017/S000711451000574X. [DOI] [PubMed] [Google Scholar]
- Aeberli I, Hochuli M, Gerber PA, Sze L, Murer SB, Tappy L, Spinas GA, Berneis K. Moderate amounts of fructose consumption impair insulin sensitivity in healthy young men: a randomized controlled trial. Diabetes Care. 2013;36:150–156. doi: 10.2337/dc12-0540. [DOI] [PMC free article] [PubMed] [Google Scholar]
- Johnston RD, Stephenson MC, Crossland H, Cordon SM, Palcidi E, Cox EF, Taylor MA, Aithal GP, Macdonald IA. No difference between high-fructose and high-glucose diets on liver triacylglycerol or biochemistry in healthy overweight men. Gastroenterology. 2013;145:1016–1025. doi: 10.1053/j.gastro.2013.07.012. e1012. [DOI] [PubMed] [Google Scholar]
- Stanhope KL, Bremer AA, Medici V, Nakajima K, Ito Y, Nakano T, Chen G, Fong TH, Lee V, Menorca RI, Keim NL, Havel PJ. Consumption of fructose and high fructose corn syrup increase postprandial triglycerides, LDL-cholesterol, and apolipoprotein-B in young men and women. J Clin Endocrinol Metab. 2011;96:E1596–E1605. doi: 10.1210/jc.2011-1251. [DOI] [PMC free article] [PubMed] [Google Scholar]
- Heden TD, Liu Y, Park YM, Nyhoff LM, Winn NC, Kanaley JA. Moderate amounts of fructose- or glucose-sweetened beverages do not differentially alter metabolic health in male and female adolescents. Am J Clin Nutr. 2014;100:796–805. doi: 10.3945/ajcn.113.081232. [DOI] [PMC free article] [PubMed] [Google Scholar]
- Jin R, Welsh JA, Le NA, Holzberg J, Sharma P, Martin DR, Vos MB. Dietary fructose reduction improves markers of cardiovascular disease risk in Hispanic-American adolescents with NAFLD. Nutrients. 2014;6:3187–3201. doi: 10.3390/nu6083187. [DOI] [PMC free article] [PubMed] [Google Scholar]
- Sievenpiper JL, de Souza RJ, Mirrahimi A, Yu ME, Carleton AJ, Beyene J, Chiavaroli L, Di Buono M, Jenkins AL, Leiter LA, Wolever TM, Kendall CW, Jenkins DJ. Effect of fructose on body weight in controlled feeding trials: a systematic review and meta-analysis. Ann Intern Med. 2012;156:291–304. doi: 10.7326/0003-4819-156-4-201202210-00007. [DOI] [PubMed] [Google Scholar]
- David Wang D, Sievenpiper JL, de Souza RJ, Cozma AI, Chiavaroli L, Ha V, Mirrahimi A, Carleton AJ, Di Buono M, Jenkins AL, Leiter LA, Wolever TM, Beyene J, Kendall CW, Jenkins DJ. Effect of fructose on postprandial triglycerides: a systematic review and meta-analysis of controlled feeding trials. Atherosclerosis. 2014;232:125–133. doi: 10.1016/j.atherosclerosis.2013.10.019. [DOI] [PubMed] [Google Scholar]
- Cozma AI, Sievenpiper JL, de Souza RJ, Chiavaroli L, Ha V, Wang DD, Mirrahimi A, Yu ME, Carleton AJ, Di Buono M, Jenkins AL, Leiter LA, Wolever TM, Beyene J, Kendall CW, Jenkins DJ. Effect of fructose on glycemic control in diabetes: a systematic review and meta-analysis of controlled feeding trials. Diabetes Care. 2012;35:1611–1620. doi: 10.2337/dc12-0073. [DOI] [PMC free article] [PubMed] [Google Scholar]
- Ha V, Sievenpiper JL, de Souza RJ, Chiavaroli L, Wang DD, Cozma AI, Mirrahimi A, Yu ME, Carleton AJ, Dibuono M, Jenkins AL, Leiter LA, Wolever TM, Beyene J, Kendall CW, Jenkins DJ. Effect of fructose on blood pressure: a systematic review and meta-analysis of controlled feeding trials. Hypertension. 2012;59:787–795. doi: 10.1161/HYPERTENSIONAHA.111.182311. [DOI] [PubMed] [Google Scholar]
- Wang DD, Sievenpiper JL, de Souza RJ, Chiavaroli L, Ha V, Cozma AI, Mirrahimi A, Yu ME, Carleton AJ, Di Buono M, Jenkins AL, Leiter LA, Wolever TM, Beyene J, Kendall CW, Jenkins DJ. The effects of fructose intake on serum uric acid vary among controlled dietary trials. J Nutr. 2012;142:916–923. doi: 10.3945/jn.111.151951. [DOI] [PMC free article] [PubMed] [Google Scholar]
- Sievenpiper JL, Chiavaroli L, de Souza RJ, Mirrahimi A, Cozma AI, Ha V, Wang DD, Yu ME, Carleton AJ, Beyene J, Di Buono M, Jenkins AL, Leiter LA, Wolever TM, Kendall CW, Jenkins DJ. ‘Catalytic’ doses of fructose may benefit glycaemic control without harming cardiometabolic risk factors: a small meta-analysis of randomised controlled feeding trials. Br J Nutr. 2012;108:418–423. doi: 10.1017/S000711451200013X. [DOI] [PMC free article] [PubMed] [Google Scholar]
- Cuany D, Benet T, Austin S. Development and single-laboratory validation of a method for the determination of total fructans in infant formula. J AOAC Int. 2010;93:202–212. [PubMed] [Google Scholar]
- Moher D, Liberati A, Tetzlaff J, Altman DG PRISMA Group. Preferred reporting items for systematic reviews and meta-analyses: the PRISMA statement. BMJ. 2009;339:b2535. doi: 10.1136/bmj.b2535. [DOI] [PMC free article] [PubMed] [Google Scholar]
- Heyland DK, Novak F, Drover JW, Jain M, Su X, Suchner U. Should immunonutrition become routine in critically ill patients? A systematic review of the evidence. JAMA. 2001;286:944–953. doi: 10.1001/jama.286.8.944. [DOI] [PubMed] [Google Scholar]
- Elbourne DR, Altman DG, Higgins JP, Curtin F, Worthington HV, Vail A. Meta-analyses involving cross-over trials: methodological issues. Int J Epidemiol. 2002;31:140–149. doi: 10.1093/ije/31.1.140. [DOI] [PubMed] [Google Scholar]
- Ha V, Sievenpiper JL, de Souza RJ, Jayalath VH, Mirrahimi A, Agarwal A, Chiavaroli L, Mejia SB, Sacks FM, Di Buono M, Bernstein AM, Leiter LA, Kris-Etherton PM, Vuksan V, Bazinet RP, Josse RG, Beyene J, Kendall CW, Jenkins DJ. Effect of dietary pulse intake on established therapeutic lipid targets for cardiovascular risk reduction: a systematic review and meta-analysis of randomized controlled trials. CMAJ. 2014;186:E252–E262. doi: 10.1503/cmaj.131727. [DOI] [PMC free article] [PubMed] [Google Scholar]
- Egger M, Davey Smith G, Schneider M, Minder C. Bias in meta-analysis detected by a simple, graphical test. BMJ. 1997;315:629–634. doi: 10.1136/bmj.315.7109.629. [DOI] [PMC free article] [PubMed] [Google Scholar]
- Begg CB. A measure to aid in the interpretation of published clinical trials. Stat Med. 1985;4:1–9. doi: 10.1002/sim.4780040103. [DOI] [PubMed] [Google Scholar]
- Pelkonen R, Aro A, Nikkila EA. Metabolic effects of dietary fructose in insulin dependent diabetes of adults. Acta Med Scand Suppl. 1972;542:187–193. doi: 10.1111/j.0954-6820.1972.tb05334.x. [DOI] [PubMed] [Google Scholar]
- Koivisto VA, Yki-Jarvinen H. Fructose and insulin sensitivity in patients with type 2 diabetes. J Intern Med. 1993;233:145–153. doi: 10.1111/j.1365-2796.1993.tb00667.x. [DOI] [PubMed] [Google Scholar]
- Thorburn AW, Crapo PA, Beltz WF, Wallace P, Witztum JL, Henry RR. Lipid metabolism in non-insulin-dependent diabetes: effects of long-term treatment with fructose-supplemented mixed meals. Am J Clin Nutr. 1989;50:1015–1022. doi: 10.1093/ajcn/50.5.1015. [DOI] [PubMed] [Google Scholar]
- Blayo A, Fontvielle AM, Rizkalla S, Bruzzo F, Slama G. Effets metaboliques de la consommation quotidienne pednant un an de saccharose ou de fructose par des diabetiques. (Metabolic effects of daily consumption for one year of granulated sucrose of fructose in diabetics.) Med Nutr. 1990;26:909–913. [Google Scholar]
- Anderson JW, Story LJ, Zettwoch NC, Gustafson NJ, Jefferson BS. Metabolic effects of fructose supplementation in diabetic individuals. Diabetes Care. 1989;12:337–344. doi: 10.2337/diacare.12.5.337. [DOI] [PubMed] [Google Scholar]
- McAteer EJ, O’Reilly G, Hadden DR. The effects of one month high fructose intake on plasma glucose and lipid levels in non-insulin-dependent diabetes. Diabet Med. 1987;4:62–64. doi: 10.1111/j.1464-5491.1987.tb00831.x. [DOI] [PubMed] [Google Scholar]
- Crapo PA, Kolterman OG, Henry RR. Metabolic consequence of two-week fructose feeding in diabetic subjects. Diabetes Care. 1986;9:111–119. doi: 10.2337/diacare.9.2.111. [DOI] [PubMed] [Google Scholar]
- Akerblom HK, Siltanen I, Kallio AK. Does dietary fructose affect the control of diabetes in children? Acta Med Scand Suppl. 1972;542:195–202. doi: 10.1111/j.0954-6820.1972.tb05335.x. [DOI] [PubMed] [Google Scholar]
- Bantle JP, Swanson JE, Thomas W, Laine DC. Metabolic effects of dietary fructose in diabetic subjects. Diabetes Care. 1992;15:1468–1476. doi: 10.2337/diacare.15.11.1468. [DOI] [PubMed] [Google Scholar]
- Osei K, Bossetti B. Dietary fructose as a natural sweetener in poorly controlled type 2 diabetes: a 12-month crossover study of effects on glucose, lipoprotein and apolipoprotein metabolism. Diabet Med. 1989;6:506–511. doi: 10.1111/j.1464-5491.1989.tb01218.x. [DOI] [PubMed] [Google Scholar]
- Osei K, Falko J, Bossetti BM, Holland GC. Metabolic effects of fructose as a natural sweetener in the physiologic meals of ambulatory obese patients with type II diabetes. Am J Med. 1987;83:249–255. doi: 10.1016/0002-9343(87)90693-0. [DOI] [PubMed] [Google Scholar]
- Grigoresco C, Rizkalla SW, Halfon P, Bornet F, Fontvieille AM, Bros M, Dauchy F, Tchobroutsky G, Slama G. Lack of detectable deleterious effects on metabolic control of daily fructose ingestion for 2 mo in NIDDM patients. Diabetes Care. 1988;11:546–550. doi: 10.2337/diacare.11.7.546. [DOI] [PubMed] [Google Scholar]
- Bantle JP, Laine DC, Thomas JW. Metabolic effects of dietary fructose and sucrose in types I and II diabetic subjects. JAMA. 1986;256:3241–3246. [PubMed] [Google Scholar]
- Bantle JP, Raatz SK, Thomas W, Georgopoulos A. Effects of dietary fructose on plasma lipids in healthy subjects. Am J Clin Nutr. 2000;72:1128–1134. doi: 10.1093/ajcn/72.5.1128. [DOI] [PubMed] [Google Scholar]
- Malerbi DA, Paiva ES, Duarte AL, Wajchenberg BL. Metabolic effects of dietary sucrose and fructose in type II diabetic subjects. Diabetes Care. 1996;19:1249–1256. doi: 10.2337/diacare.19.11.1249. [DOI] [PubMed] [Google Scholar]
- Sunehag AL, Toffolo G, Treuth MS, Butte NF, Cobelli C, Bier DM, Haymond MW. Effects of dietary macronutrient content on glucose metabolism in children. J Clin Endocrinol Metab. 2002;87:5168–5178. doi: 10.1210/jc.2002-020674. [DOI] [PubMed] [Google Scholar]
- Huttunen JK, Makinen KK, Scheinin A. Turku sugar studies XI. Effects of sucrose, fructose and xylitol diets on glucose, lipid and urate metabolism. Acta Odontol Scand. 1976;34:345–351. doi: 10.3109/00016357609004646. [DOI] [PubMed] [Google Scholar]
- Nikkila EA, Kekki M. Effects of dietary fructose and sucrose on plasma triglyceride metabolism in patients with endogenous hypertriglyceridemia. Acta Med Scand Suppl. 1972;542:221–227. doi: 10.1111/j.0954-6820.1972.tb05338.x. [DOI] [PubMed] [Google Scholar]
- Nestel PJ, Carroll KF, Havenstein N. Plasma triglyceride response to carbohydrates, fats and caloric intake. Metabolism. 1970;19:1–18. doi: 10.1016/0026-0495(70)90112-5. [DOI] [PubMed] [Google Scholar]
- Kaufmann NA, Poznanski R, Blondheim SH, Stein Y. Effect of fructose, glucose, sucrose and starch on serum lipids in carbohydrate induced hypertriglyceridemia and in normal subjects. Isr J Med Sci. 1966;2:715–726. [PubMed] [Google Scholar]
- Treuth MS, Sunehag AL, Trautwein LM, Bier DM, Haymond MW, Butte NF. Metabolic adaptation to high-fat and high-carbohydrate diets in children and adolescents. Am J Clin Nutr. 2003;77:479–489. doi: 10.1093/ajcn/77.2.479. [DOI] [PubMed] [Google Scholar]
- Turner JL, Bierman EL, Brunzell JD, Chait A. Effect of dietary fructose on triglyceride transport and glucoregulatory hormones in hypertriglyceridemic men. Am J Clin Nutr. 1979;32:1043–1050. doi: 10.1093/ajcn/32.5.1043. [DOI] [PubMed] [Google Scholar]
- Koh ET, Ard NF, Mendoza F. Effects of fructose feeding on blood parameters and blood pressure in impaired glucose-tolerant subjects. J Am Diet Assoc. 1988;88:932–938. [PubMed] [Google Scholar]
- Cybulska B, Naruszewicz M. The effect of short-term and prolonged fructose intake on VLDL-TG and relative properties on apo CIII1 and apo CII in the VLDL fraction in type IV hyperlipoproteinaemia. Nahrung. 1982;26:253–261. doi: 10.1002/food.19820260306. [DOI] [PubMed] [Google Scholar]
- Hallfrisch J, Reiser S, Prather ES. Blood lipid distribution of hyperinsulinemic men consuming three levels of fructose. Am J Clin Nutr. 1983;37:740–748. doi: 10.1093/ajcn/37.5.740. [DOI] [PubMed] [Google Scholar]
- Bossetti BM, Kocher LM, Moranz JF, Falko JM. The effects of physiologic amounts of simple sugars on lipoprotein, glucose, and insulin levels in normal subjects. Diabetes Care. 1984;7:309–312. doi: 10.2337/diacare.7.4.309. [DOI] [PubMed] [Google Scholar]
- Reiser S, Powell AS, Scholfield DJ, Panda P, Ellwood KC, Canary JJ. Blood lipids, lipoproteins, apoproteins, and uric acid in men fed diets containing fructose or high-amylose cornstarch. Am J Clin Nutr. 1989;49:832–839. doi: 10.1093/ajcn/49.5.832. [DOI] [PubMed] [Google Scholar]
- Swanson JE, Laine DC, Thomas W, Bantle JP. Metabolic effects of dietary fructose in healthy subjects. Am J Clin Nutr. 1992;55:851–856. doi: 10.1093/ajcn/55.4.851. [DOI] [PubMed] [Google Scholar]
- Forster H, Heller G. Studies on the significance of carbohydrates in a fully synthetic fat-free diet. Dtsch Med Wochenschr. 1973;98:1156–1163. doi: 10.1055/s-0028-1106986. [DOI] [PubMed] [Google Scholar]
- Le K-A, Faeh D, Stettler R, Ith M, Kreis R, Vermathen P, Boesch C, Ravussin E, Tappy L. A 4-wk high-fructose diet alters lipid metabolism without affecting insulin sensitivity or ectopic lipids in healthy humans. Am J Clin Nutr. 2006;84:1374–1379. doi: 10.1093/ajcn/84.6.1374. [DOI] [PubMed] [Google Scholar]
- Le K-A, Ith M, Kreis R, Faeh D, Bortolotti M, Tran C, Boesch C, Tappy L. Fructose overconsumption causes dyslipidemia and ectopic lipid deposition in healthy subjects with and without a family history of type 2 diabetes. Am J Clin Nutr. 2009;89:1760–1765. doi: 10.3945/ajcn.2008.27336. [DOI] [PubMed] [Google Scholar]
- Zhang YH, An T, Zhang RC, Zhou Q, Huang Y, Zhang J. Very high fructose intake increases serum LDL-cholesterol and total cholesterol: a meta-analysis of controlled feeding trials. J Nutr. 2013;143:1391–1398. doi: 10.3945/jn.113.175323. [DOI] [PubMed] [Google Scholar]
- Chiavaroli L, Mirrahimi A, de Souza RJ, Sievenpiper JL. Meta-analysis of fructose and cholesterol: a concern regarding missing data. J Nutr. 2014;144:538–539. doi: 10.3945/jn.113.187757. [DOI] [PubMed] [Google Scholar]
- Marriott BP, Cole N, Lee E. National estimates of dietary fructose intake increased from 1977 to 2004 in the United States. J Nutr. 2009;139:1228S–1235S. doi: 10.3945/jn.108.098277. [DOI] [PubMed] [Google Scholar]
- White JS. Misconceptions about high-fructose corn syrup: is it uniquely responsible for obesity, reactive dicarbonyl compounds, and advanced glycation endproducts? J Nutr. 2009;139:1219S–1227S. doi: 10.3945/jn.108.097998. [DOI] [PubMed] [Google Scholar]
- Whitehead A, Beck EJ, Tosh S, Wolever TM. Cholesterol-lowering effects of oat beta-glucan: a meta-analysis of randomized controlled trials. Am J Clin Nutr. 2014;100:1413–1421. doi: 10.3945/ajcn.114.086108. [DOI] [PMC free article] [PubMed] [Google Scholar]
- Ursoniu S, Sahebkar A, Serban MC, Banach M. Lipid profile and glucose changes after supplementation with astaxanthin: a systematic review and meta-analysis of randomized controlled trials. Arch Med Sci. 2015;11:253–266. doi: 10.5114/aoms.2015.50960. [DOI] [PMC free article] [PubMed] [Google Scholar]
- Blanco Mejia S, Kendall CW, Viguiliouk E, Augustin LS, Ha V, Cozma AI, Mirrahimi A, Maroleanu A, Chiavaroli L, Leiter LA, de Souza RJ, Jenkins DJ, Sievenpiper JL. Effect of tree nuts on metabolic syndrome criteria: a systematic review and meta-analysis of randomised controlled trials. BMJ Open. 2014;4:e004660. doi: 10.1136/bmjopen-2013-004660. [DOI] [PMC free article] [PubMed] [Google Scholar]
- Sahebkar A, Serban C, Ursoniu S, Banach M. Effect of garlic on plasma lipoprotein(a) concentrations: a systematic review and meta-analysis of randomized controlled clinical trials. Nutrition. 2015 doi: 10.1016/j.nut.2015.06.009. doi: 10.1016/j.nut.2015.06.009 [Epub ahead of print.] [DOI] [PubMed] [Google Scholar]
- Jenkins DJ, Jones PJ, Lamarche B, Kendall CW, Faulkner D, Cermakova L, Gigleux I, Ramprasath V, de Souza R, Ireland C, Patel D, Srichaikul K, Abdulnour S, Bashyam B, Collier C, Hoshizaki S, Josse RG, Leiter LA, Connelly PW, Frohlich J. Effect of a dietary portfolio of cholesterol-lowering foods given at 2 levels of intensity of dietary advice on serum lipids in hyperlipidemia: a randomized controlled trial. JAMA. 2011;306:831–839. doi: 10.1001/jama.2011.1202. [DOI] [PubMed] [Google Scholar]
Associated Data
This section collects any data citations, data availability statements, or supplementary materials included in this article.
Supplementary Materials
Table S1. Search Strategy to identify controlled feeding trials on the effect of fructose on lipids
Table S2. Dose Response Models by Multivariate Meta-Regression of Isocaloric Trials*
Table S3. Dose Response Models by Multivariate Meta-Regression of Hypercaloric Trials*
Figure S1. Subgroup analyses in isocaloric feeding trials investigating the effect of isocaloric exchange of fructose for other sources of carbohydrate (CHO) on LDL-C. Data are weighted mean differences (MD) with 95% CI. Point estimates for each subgroup level (diamonds) are the pooled effect estimates. The dashed line represents the pooled effect estimate for the overall (total) analysis. The residual I2 value indicates the interstudy heterogeneity unexplained by the subgroup. Pairwise between-subgroup mean differences (95% CIs) for comparators were as follows: −0.11 mmol/L (−0.28, 0.07) (1 vs 2) to −0.09 mmol/L (−0.46, 0.27) (1 vs 3) to −0.41 mmol/L (−0.77, −0.05) (1 vs 4)* to −0.20 mmol/L (−0.63, 0.23) (2 vs 3) to −0.51 mmol/L (−0.94, −0.09) (2 vs 4)* to and −0.50 mmol/L (−1.03, 0.04) (3 vs 4). LDL-C indicates low-density lipoprotein cholesterol; MQS, Heyland Methodological Quality Score. *Statistically significant pairwise subgroup effect modification by meta-regression analyses (P<0.05).
Figure S2. Subgroup analyses in isocaloric feeding trials investigating the effect of isocaloric exchange of fructose for other sources of carbohydrate (CHO) on apo B. Data are weighted mean differences (MD) with 95% CI. Point estimates for each subgroup level (diamonds) are the pooled effect estimates. The dashed line represents the pooled effect estimate for the overall (total) analysis. The residual I2 value indicates the interstudy heterogeneity unexplained by the subgroup. Pairwise between-subgroup mean differences (95% CIs) for comparators were as follows: 0.06 mmol/L (−0.36, 0.47) (1 vs 2) to 0.05 mmol/L (−0.67, 0.76) (1 vs 3) to −0.13 mmol/L (−0.74, 0.47) (1 vs 4) to 0.10 mmol/L (−0.81, 1.01) (2 vs 3) to −0.08 mmol/L (−0.91, 0.75) (2 vs 4) to and −0.09 mmol/L (−1.1, 0.92) (3 vs 4). apoB indicates apo lipoprotein B; MQS, Heyland Methodological Quality Score. *Statistically significant pairwise subgroup effect modification by meta-regression analyses (P<0.05).
Figure S3. Subgroup analyses in isocaloric feeding trials investigating the effect of isocaloric exchange of fructose for other sources of carbohydrate (CHO) on non-HDL-C. Data are weighted mean differences (MD) with 95% CI. Point estimates for each subgroup level (diamonds) are the pooled effect estimates. The dashed line represents the pooled effect estimate for the overall (total) analysis. The residual I2 value indicates the interstudy heterogeneity unexplained by the subgroup. Pairwise between-subgroup mean differences (95% CIs) for comparators were as follows: −0.02 mmol/L (−0.26, 0.23) (1 vs 2) to −0.03 mmol/L (−0.33, 0.26) (1 vs 3) to −0.44 mmol/L (−1.02, 0.15) (1 vs 4) to −0.05 mmol/L (−0.48, 0.39) (2 vs 3) to −0.45 mmol/L (−1.12, 0.21) (2 vs 4) to and −0.47 mmol/L (−1.16, 0.22) (3 vs 4). Non-HDL-C, non–high-density lipoprotein cholesterol; MQS, Heyland Methodological Quality Score. *Statistically significant pairwise subgroup effect modification by meta-regression analyses (P<0.05).
Figure S4. Subgroup analyses in isocaloric feeding trials investigating the effect of isocaloric exchange of fructose for other sources of carbohydrate (CHO) on triglycerides. Data are weighted mean differences (MD) with 95% CI. Point estimates for each subgroup level (diamonds) are the pooled effect estimates. The dashed line represents the pooled effect estimate for the overall (total) analysis. The residual I2 value indicates the interstudy heterogeneity unexplained by the subgroup. Pairwise between-subgroup mean differences (95% CIs) for comparators were as follows: −0.11 mmol/L (−0.31, 0.09) (1 vs 2) to −0.11 mmol/L (−0.34, 0.12) (1 vs 3) to −0.18 mmol/L (−0.70, 0.35) (1 vs 4) to −0.46 mmol/L (−1.77, 0.85) (1 vs 5) to −0.21 mmol/L (−0.57, 0.14) (2 vs 3) to −0.28 mmol/L (−0.87, 0.30) (2 vs 4) to −0.56 mmol/L (−1.90, 0.77) (2 vs 5) to −0.29 mmol/L (−0.89, 0.31) (3 vs 4) to −0.57 mmol/L (−1.91, 0.78) (3 vs 5) and to −0.64 mmol/L (−2.06, 0.79) (4 vs 5). MQS, Heyland Methodological Quality Score. *Statistically significant pairwise subgroup effect modification by meta-regression analyses (P<0.05).
Figure S5. Subgroup analyses in isocaloric feeding trials investigating the effect of isocaloric exchange of fructose for other sources of carbohydrate (CHO) on HDL-C. Data are weighted mean differences (MD) with 95% CI. Point estimates for each subgroup level (diamonds) are the pooled effect estimates. The dashed line represents the pooled effect estimate for the overall (total) analysis. The residual I2 value indicates the interstudy heterogeneity unexplained by the subgroup. Pairwise between-subgroup mean differences (95% CIs) for comparators were as follows: −0.05 mmol/L (−0.12, 0.02) (1 vs 2) to −0.04 mmol/L (−0.15, 0.08) (1 vs 3) to −1.85 mmol/L (−2.10, −1.60)* (1 vs 4) to −0.09 mmol/L (−0.24, 0.07) (2 vs 3) to −1.90 mmol/L (−2.17, −1.63)* (2 vs 4) to and −1.89 mmol/L (−2.17, −1.60)* (3 vs 4). HDL-C indicates high-density lipoprotein cholesterol; MQS, Heyland Methodological Quality Score. *Statistically significant pairwise subgroup effect modification by meta-regression analyses (P<0.05).
Figure S6. Forest plots of the effect of fructose on LDL-C in hypercaloric feeding trials. Pooled effect estimates are shown as diamonds. Data are expressed as weighted MD with 95% CI using generic inverse variance random effects models. Interstudy heterogeneity was tested by Cochrane’s Q statistics (χ2 test) at a significance level of P<0.10 and quantified by I2, where I2≥50% is considered to be evidence of substantial heterogeneity and ≥75% considerable heterogeneity. Any CHO denotes any carbohydrate comparator. LDL-C indicates low-density lipoprotein cholesterol.
Figure S7. Forest plots of the effect of fructose on non-HDL-C in hypercaloric feeding trials. Pooled effect estimates are shown as diamonds. Data are expressed as weighted MD with 95% CI using generic inverse variance random effects models. Interstudy heterogeneity was tested by Cochrane’s Q statistics (χ2 test) at a significance level of P<0.10 and quantified by I2, where I2≥50% is considered to be evidence of substantial heterogeneity and ≥75% considerable heterogeneity. Any CHO denotes any carbohydrate comparator. HDL-C indicates high-density lipoprotein cholesterol.
Figure S8. Subgroup analyses in hypercaloric feeding trials investigating the effect of hypercaloric exchange of fructose for other sources of carbohydrate (CHO) on triglycerides. Data are mean differences (MD) with 95% CI. Point estimates for each subgroup level (diamonds) are the pooled effect estimates. The dashed line represents the pooled effect estimate for the overall (total) analysis. The residual I2 value indicates the interstudy heterogeneity unexplained by the subgroup. MQS indicates Heyland Methodological Quality Score. *Statistically significant pairwise subgroup effect modification by meta-regression analyses (P<0.05).
Figure S9. Forest plots of the effect of fructose on HDL-C in hypercaloric feeding trials. Pooled effect estimates are shown as diamonds. Data are expressed as weighted mean differences (MD) with 95% CI using generic inverse variance random effects models. Interstudy heterogeneity was tested by Cochrane’s Q statistics (χ2 test) at a significance level of P<0.10 and quantified by I2, where I2≥50% is considered to be evidence of substantial heterogeneity and ≥75% considerable heterogeneity. Any CHO denotes any carbohydrate comparator. HDL-C indicates high-density lipoprotein cholesterol.
Figure S10. Dose response meta-regression analyses for isocaloric trials on (A) LDL-C, (B) apoB, (C) non-HDL-C, and (D) triglycerides. HDL-C indicates high-density lipoprotein cholesterol; LDL-C, low-density lipoprotein cholesterol.
Figure S11. Dose response meta-regressions for isocaloric trials of HDL-C including (A) all isocaloric trials on HDL-C (P=0.084), (B) only those with non-fructose-containing comparators (P=0.952), and (C) only those with fructose-containing comparators (P=0.014). When the one outlier is removed from the analysis in (C), P=0.802. HDL-C indicates high-density lipoprotein cholesterol.
Figure S12. Funnel plots of the effect of fructose on established lipid targets: (A) low-density lipoprotein cholesterol (LDL-C), (B) non–high-density lipoprotein cholesterol (non-HDL-C), (C) apo lipoprotein B (apo B), and (D) HDL-C in isocaloric feeding trials. The solid line represents the pooled effect estimate expressed as the weighted mean difference (MD) for each analysis. The fitted line corresponds to the best-fit regression of the standard normal deviate of the fructose effect estimate against its precision (Egger’s test). Dashed lines present pseudo-95% confidence limits.
Figure S13. Funnel plots of the effect of fructose on established lipid targets: (A) triglycerides in isocaloric feeding trials and (B) triglycerides in hypercaloric feeding trials. The solid line represents the pooled effect estimate expressed as the weighted mean difference (MD) for each analysis. The fitted line corresponds to the best-fit regression of the standard normal deviate of the fructose effect estimate against its precision (Egger’s test). Dashed lines present pseudo-95% confidence limits.