

Abstract
Background
Preclinical data suggest that an acute inflammatory response following myocardial infarction (MI) accelerates systemic atherosclerosis. Using combined positron emission and computed tomography, we investigated whether this phenomenon occurs in humans.
Methods and Results
Overall, 40 patients with MI and 40 with stable angina underwent thoracic 18F-fluorodeoxyglucose combined positron emission and computed tomography scan. Radiotracer uptake was measured in aortic atheroma and nonvascular tissue (paraspinal muscle). In 1003 patients enrolled in the Global Registry of Acute Coronary Events, we assessed whether infarct size predicted early (≤30 days) and late (>30 days) recurrent coronary events. Compared with patients with stable angina, patients with MI had higher aortic 18F-fluorodeoxyglucose uptake (tissue-to-background ratio 2.15±0.30 versus 1.84±0.18, P<0.0001) and plasma C-reactive protein concentrations (6.50 [2.00 to 12.75] versus 2.00 [0.50 to 4.00] mg/dL, P=0.0005) despite having similar aortic (P=0.12) and less coronary (P=0.006) atherosclerotic burden and similar paraspinal muscular 18F-fluorodeoxyglucose uptake (P=0.52). Patients with ST-segment elevation MI had larger infarcts (peak plasma troponin 32 300 [10 200 to >50 000] versus 3800 [1000 to 9200] ng/L, P<0.0001) and greater aortic 18F-fluorodeoxyglucose uptake (2.24±0.32 versus 2.02±0.21, P=0.03) than those with non–ST-segment elevation MI. Peak plasma troponin concentrations correlated with aortic 18F-fluorodeoxyglucose uptake (r=0.43, P=0.01) and, on multivariate analysis, independently predicted early (tertile 3 versus tertile 1: relative risk 4.40 [95% CI 1.90 to 10.19], P=0.001), but not late, recurrent MI.
Conclusions
The presence and extent of MI is associated with increased aortic atherosclerotic inflammation and early recurrent MI. This finding supports the hypothesis that acute MI exacerbates systemic atherosclerotic inflammation and remote plaque destabilization: MI begets MI.
Clinical Trial Registration
URL: https://www.clinicaltrials.gov. Unique identifier: NCT01749254.
Keywords: 18F-fluorodeoxyglucose positron emission and computed tomography, atherosclerosis, inflammation, vulnerable plaque
Despite recent advances, prognosis following acute myocardial infarction (MI) remains poor1–3 because of a considerable risk of recurrent infarction4 and ischemia.5 Such recurrent events are as likely to occur at the site of nonculprit plaques as at the site of the original culprit lesion.6 In postmortem studies of patients dying after acute MI, there is evidence of multiple plaque-related thrombotic events: on average, 2.4 per patient.7 Moreover, there is an increased incidence of ischemic stroke following MI (not exclusively due to embolic events), suggesting systemic and localized destabilization of remote atherosclerotic plaque.8,9
MI occurs predominantly as a result of acute atherosclerotic plaque rupture,3,9–11 with inflammation believed to be a key precipitant.10,11 Macrophages infiltrate high-risk plaque and secrete matrix metalloproteinases that weaken the fibrous cap and predispose the plaque to rupture.10,11 Recent preclinical murine data have indicated that MI induced by coronary artery ligation causes a systemic inflammatory response that involves macrophage mobilization, a generalized increase in atherosclerotic inflammation, and accelerated plaque progression12; however, this phenomenon has not been observed directly in humans.
Positron emission tomography (PET) combined with computed tomography (CT) allows the in vivo assessment of atherosclerotic disease in humans. Glucose analogue 18F-fluorodeoxyglucose (18F-FDG) is taken up by cells with high metabolic requirements. It has become a widely used as a measure of acute vascular inflammation correlating with atherosclerotic macrophage burden, response to drug therapy, and symptomatic status.13–16 Its generalized uptake within large arteries is a powerful predictor of subsequent adverse cardiovascular events.17
In this prospective clinical trial, we determined whether systemic atherosclerotic plaque metabolism is increased in patients with MI compared with those with stable coronary disease and whether this increase is more marked in those with larger infarctions. Furthermore, we explored whether this increase might be of clinical relevance and whether infarct size could predict recurrent early MI.
Methods
The study comprised 2 cohorts of patients: an imaging cohort, consisting of subjects with stable angina and MI, and an outcome cohort, comprising patients enrolled in the Global Registry of Acute Coronary Events (GRACE).18
Imaging Cohort
Subjects
Consecutive patients with acute ST-segment elevation MI (STEMI), non-STEMI,19 and stable angina pectoris scheduled for invasive coronary angiography were recruited from the Royal Infirmary of Edinburgh, as described previously.20 Patients with MI fulfilled the criteria for type 1 MI according to the Universal Definition of MI.19 STEMI was defined as new ST-segment elevation at the J point in 2 contiguous leads with the following cut points: ≥0.1 mV in all leads except V2 to V3, for which the thresholds were ≥0.2 mV for men and ≥0.25 mV for women. Consecutive patients with stable angina pectoris were recruited if they had typical symptoms of exertional anginal chest pain, had previously documented coronary artery disease (>70% stenosis of at least 1 major epicardial coronary artery), and were scheduled for invasive coronary angiography. Patients were excluded if they had suffered an acute coronary syndrome within the previous 3 months.
Other exclusion criteria were age <50 years, insulin-dependent diabetes mellitus, women of childbearing age not taking contraception, severe renal failure (serum creatinine >250 μmol/L), known contrast allergy, and inability to provide informed consent. Studies were performed with the approval of the local research ethics committee, in accordance with the Declaration of Helsinki, and with the written informed consent of each participant.
All patients underwent a comprehensive baseline clinical assessment including evaluation of their cardiovascular risk factor profile. Blood was drawn from all participants for evaluation of plasma C-reactive protein (CRP) concentrations, which were measured using the Multigent CRP Vario assay (Archi-Tech cSystems Assay; Abbott Laboratories).
PET-CT imaging
All patients underwent PET-CT imaging of the thorax with a hybrid scanner (Biograph mCT; Siemens Medical Systems) using 18F-FDG as well as coronary calcium scoring and CT angiography of the aorta and coronary arteries.20–22 Subjects were administered a target dose of 200 MBq 18F-FDG intravenously and subsequently rested in a quiet environment for 90 minutes. A low-dose attenuation-correction CT scan (50 mAs, 120 keV with CARE Dose 4D) was then performed, followed by PET imaging of the thorax, covering 1 PET bed for 20 minutes. Patients were asked to observe a low-carbohydrate, high-protein, and high-fat diet and to refrain from alcohol intake for at least 24 hours prior to the 18F-FDG scan to minimize cardiac uptake.
Following acquisition of the PET data, an electrocardiogram-gated breath-hold CT scan (non–contrast enhanced, 40 mAs/rotation, 120 kV; Siemens Medical Systems) was performed for calcium scoring. CT angiography was performed immediately afterward per the standardized scanning protocol.
Image analysis
Anonymized PET-CT data sets were presented in a random order on an OsiriX workstation (64 bit; version 5.5.1; OsiriX Imaging Software) to trained observers (N.V.J., A.S.) who were blinded to the patients’ clinical status.18 To aid image analysis, PET images were fused with the CT angiograms, and regions of interest were drawn around the thoracic aorta on serial 3-mm axial slices. Within these regions, mean and maximum tracer activities were measured using standard uptake values and corrected for blood-pool activity in the superior vena cava to provide tissue-to-background ratios (TBRs).20–24 The ascending aorta was defined as the segment of the aorta from the lower level of the right pulmonary artery up to the last slice at which the aorta maintained its circular cross-sectional appearance. The descending aorta was defined similarly as the region extending up from the tip of the diaphragm to the last circular slice. The aortic arch was defined as the region of aorta connecting the ascending and descending aortas (Figure1). Aortic radiotracer uptake was quantified using the method of Fayad et al.25 In brief, the following measures of uptake were measured on axial slices across the aorta as a whole and within each region: TBRmax, the average of the maximum TBR values measured on each axial slice; TBRmean, the average of the mean TBR values measured on each slice; max TBR, the maximum uptake TBR value in any axial section; and TBRMDS, the most diseased segment, defined as the highest maximal TBR value averaged over 3 consecutive slices.25 Thirty patients were selected randomly to test the repeatability of 18F-FDG measurements in the aorta. Fifteen patients from each cohort were selected, and 2 trained readers (N.V.J., S.P.L.) quantified aortic activity independently. Activity within nonvascular tissue was assessed using oval-shaped regions of interest drawn within paraspinal muscle (area ≈7 cm2) on 5 consecutive axial slices.
Figure 1.
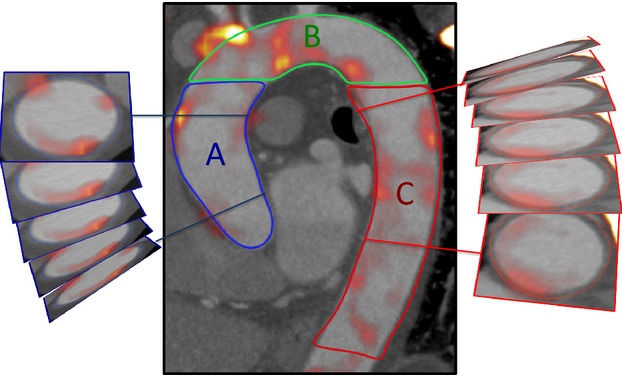
Measurement of radiotracer uptake in the aorta. The aorta was segmented into ascending aorta (A), arch of aorta (B), and descending aorta (C), as shown. Regions of interest were drawn around the aorta on axial slices to provide measures of radiotracer uptake.
CT analysis was performed on a dedicated cardiovascular workstation (Vitrea; Vital Images). Vessel-specific and total Agatston calcium scores were calculated, as described previously,21 for the coronary arteries, the aorta, and its different regions using a threshold of 130 Hounsfield units.26
Outcome Cohort
Full details of the GRACE methods have been published previously.27,28 The Edinburgh cohort of the prospectively maintained GRACE database was used to identify 1003 patients admitted with an acute coronary syndrome between January 20, 2003, and June 9, 2009.29 To be eligible, patients (aged >18 years) had to be admitted with an acute coronary syndrome as a presumptive diagnosis and had to have at least 1 of the following conditions: electrocardiographic changes consistent with acute coronary syndrome, serial increases in biomarkers of cardiac necrosis, or documented coronary artery disease. For consistency, only patients who had plasma troponin I concentrations quantified (Abbott Laboratories) in a standardized accredited laboratory were included. Exclusion criteria were secondary myocardial injury precipitated or accompanied by a significant comorbidity, trauma, or surgery. Information regarding patient demographic characteristics, medical history, timing and occurrence of acute coronary symptoms, clinical characteristics, electrocardiographic findings, treatment approaches, and in-hospital outcomes was collected through completion of a standardized proforma.27,28 The baseline and peak troponin I concentrations during admission were recorded, and patients were placed in tertiles based on their peak troponin I to reflect the degree of myocardial injury and the size of their infarct.30
The primary end point of the analysis was early recurrent MI following the index admission, defined as recurrent type 1 MI within 30 days of index admission.18 To avoid confounding with the index presentation, only those patients having recurrent MI beyond the first 24 hours after presentation were analyzed, as described previously.18 We also examined the factors associated with late recurrent MI as an exploratory end point, defined as a recurrent type 1 MI >30 days following index admission.
Statistical Analysis
As a prespecified end point of our previously reported trial (ClinicalTrials.gov identifier NCT01749254),20 we explored 18F-FDG uptake in remote aortic atheroma of patients with recent MI or stable coronary heart disease. Continuous data were tested for normality with the D’Agostino and Pearson omnibus test. Continuous parametric variables were expressed as mean±SD and compared using Student t tests. Nonparametric data were presented as median (interquartile range [IQR]) and compared using the Mann–Whitney U test or the Wilcoxon signed rank test, as appropriate. Interobserver reproducibility was calculated by the Bland–Altman method and intraclass correlation coefficients with 95% CIs. The Fisher exact test or the chi-square test was used for analysis of categorical variables. Correlation of parametric data was assessed using the Pearson correlation coefficient, and the Spearman rank correlation was used for nonparametric data.
Patients in the registry cohort were placed in tertiles according to their peak troponin concentration. Kaplan–Meier curves were used to estimate the distribution of early recurrent MI across the tertiles. Univariate analysis was undertaken to identify associations with early (≤30 days) and late (>30 days) recurrent MI that were then entered into the multivariate logistic regression model based on a univariate association of P<0.1. In addition, age and sex were included in the model. Statistical analysis was performed with GraphPad Prism version 6 (GraphPad Software Inc) and SPSS 19.0 (IBM Corp), as appropriate. Unless stated, a 2-sided P<0.05 was considered statistically significant.
Results
Imaging Cohort
Overall, 40 patients with stable angina and 40 with MI underwent 18F-FDG PET imaging. The median time between hospitalization and 18F-FDG PET imaging was 11 days (IQR 8 to 17 days) in patients with MI. Compared with patients with stable angina, patients with MI were younger, had less extensive coronary artery disease (Table1), and had lower coronary artery calcium scores (coronary artery calcium score: stable angina 599 Agatston units [AU; IQR 60 to 1302 AU]; MI 159 AU [IQR 42 to 456 AU]; P=0.006) (Tables1 and 2). Although apparently higher aortic calcium scores were noted in patients with stable angina, this difference did not reach statistical significance (aortic calcium scores; stable angina 538 AU [IQR 4 to 1870 AU]; MI 135 AU [IQR 0 to 805 AU]; P=0.12) (Table2).
Table 1.
Baseline Characteristics of Patients With Coronary Artery Disease
| Patients With Stable Angina | Patients With MI | |||
|---|---|---|---|---|
| All (n=40) | All (n=40) | STEMI (n=26) | NSTEMI (n=14) | |
| Age, y | 67±8 | 62±8 | 63±9 | 60±8 |
| Male sex | 36 (90) | 37 (93) | 24 (92) | 13 (93) |
| BMI, kg/m2 | 30±5 | 28±5 | 27±5 | 30±4 |
| Antecedent angina (active) | 40 (100) | 9 (23) | 5 (19) | 4 (29) |
| Heart rate, beats/min* | 59±9 | 56±7 | 56±7 | 56±7 |
| Systolic blood pressure, mm Hg | 134±14 | 132±21 | 131±20 | 121±21 |
| Diastolic blood pressure, mm Hg | 77±10 | 76±9 | 76±9 | 76±8 |
| Cardiovascular history | ||||
| Previous MI | 15 (38) | 5 (13) | 1 (4) | 4 (29) |
| Previous CVA/TIA | 4 (10) | 2 (5) | 1 (4) | 1 (7) |
| Previous PCI | 19 (48) | 5 (13) | 2 (8) | 3 (21) |
| Previous CABG | 11 (28) | 2 (5) | 2 (8) | 0 |
| Risk factors | ||||
| Smoking habit (ex or current) | 24 (60) | 25 (63) | 19 (73) | 6 (43) |
| Diabetes mellitus | 13 (33) | 8 (20) | 7 (27) | 1 (7) |
| Hypertension | 36 (90) | 17 (43) | 11 (42) | 6 (43) |
| Hypercholesterolaemia | 39 (98) | 19 (48) | 11 (42) | 8 (57) |
| Medications† | ||||
| Aspirin | 33 (83) | 40 (100) | 26 (100) | 14 (100) |
| Clopidogrel | 5 (13) | 39 (98) | 25 (96) | 14 (100) |
| Statin | 36 (90) | 39 (98) | 26 (100) | 13 (93) |
| β-blocker | 28 (70) | 32 (80) | 20 (77) | 12 (86) |
| ACEI/ARB | 20 (50) | 35 (88) | 25 (96) | 10 (71) |
| Calcium channel blockers | 16 (40) | 2 (5) | 2 (8) | 0 |
| Other antihypertensive | 6 (15) | 3 (8) | 1 (4) | 2 (14) |
| Oral nitrates | 15 (38) | 1 (3) | 0 | 1 (7) |
| Serum biochemistry | ||||
| Cholesterol, mg/dL | 151±31 | 181±46 | 181±50 | 185±43 |
| HDL-cholesterol, mg/dL | 43±12 | 43±12 | 43±12 | 39±12 |
| LDL-cholesterol, mg/dL | 81±27 | 112±43 | 108±43 | 120±39 |
| Triglycerides, mg/dL | 62±27 | 62±31 | 66±27 | 58±27 |
| Creatinine, mg/dL | 0.96±0.26 | 0.96±0.30 | 0.97±0.33 | 0.93±0.27 |
| Peak troponin concentration, ng/L (IQR) | — | 11 200 (3300 to >50 000) | 32 300 (10 200 to >50 000) | 3800 (1000 to 9200) |
Data are shown as mean±SD or number (percentage) except as noted. ACEI indicates angiotensin converting enzyme inhibitor; ARB, angiotensin receptor blocker; BMI, body mass index; CABG, coronary artery bypass grafting; CTCA, computed tomography coronary angiography; CVA, cerebrovascular accident; HDL, high-density lipoprotein; IQR, interquartile range; LDL, low-density lipoprotein; MI, myocardial infarction; NSTEMI, non–ST-segment elevation myocardial infarction; PCI, percutaneous coronary intervention; STEMI, ST-segment elevation myocardial infarction; TIA, transient ischemic attack.
Heart rate at the time of CTCA.
Medications at the time of scan.
Table 2.
Aortic Calcium Scores and 18F-FDG Tissue-to-Background Ratios in Patients With Stable Angina and Myocardial Infarction
| Patients With Stable Angina (n=40) | Patients With Myocardial Infarction (n=40) | P Value | Patients With STEMI (n=26) | Patients With NSTEMI (n=14) | P Value | |
|---|---|---|---|---|---|---|
| CT aortic calcium | ||||||
| Agatston units (IQR) | 538 (4 to 1870) | 135 (0 to 805) | 0.12 | 183 (0 to 377) | 55 (0 to 2523) | 0.91 |
| Volume, mm3 (IQR) | 532 (7 to 1718) | 149 (0 to 717) | 0.12 | 192 (0 to 387) | 94 (0 to 2263) | 0.85 |
| Mass, mg (IQR) | 131 (2 to 517) | 31 (31 to 1415) | 0.07 | 131 (2 to 517) | 43 (0 to 86) | 0.90 |
| 18F-FDG | ||||||
| Thoracic aorta mean TBRmax | 1.84±0.18 | 2.15±0.30 | <0.0001 | 2.24±0.32 | 2.02±0.21 | 0.03 |
| Thoracic aorta mean TBRmean | 1.41±0.14 | 1.60±0.17 | <0.0001 | 1.51±0.16 | 1.66±0.17 | 0.01 |
| Thoracic aorta max TBR | 2.22±0.31 | 2.64±0.52 | <0.0001 | 2.78±0.57 | 2.40±0.35 | 0.02 |
| Thoracic aorta TBRMDS | 2.11±0.23 | 2.54±0.49 | <0.0001 | 2.66±0.53 | 2.34±0.33 | 0.04 |
| Aortic subregions | ||||||
| Ascending aorta mean TBRmax | 1.84±0.20 | 2.21±0.35 | <0.0001 | 2.35±0.35 | 2.03±0.26 | 0.01 |
| Arch of aorta mean TBRmax | 1.88±0.22 | 2.26±0.34 | <0.0001 | 2.35±0.35 | 2.11±0.26 | 0.03 |
| Descending aorta mean TBRmax | 1.82±0.18 | 2.10±0.30 | <0.0001 | 2.17±0.32 | 1.98±0.21 | 0.08 |
18F-FDG, 18F-fluorodeoxyglucose; CT, computed tomography; IQR, interquartile range; max TBR, highest value tissue-to-background ratios in any axial slice; mean TBRmax, average of the maximum tissue-to-background ratios across all slices in the segment; mean TBRmean, average of the mean tissue-to-background ratios for all slices in the segment; NSTEMI, non–ST-segment elevation myocardial infarction; STEMI, ST-segment elevation myocardial infarction; TBRMDS, tissue-to-background ratio in the most diseased segment.
Positron emission tomography
The reproducibility of TBR measurements in the aorta for tracer activity was excellent, with no fixed or proportional biases and with narrow limits of agreement (Table S1). In contrast to the calcium scores, 18F-FDG uptake was 20% higher in the aortas of patients with recent MI than those with stable coronary artery disease (Table2 and Figure2). This finding was consistent in all regions of the aorta assessed (entire thoracic aorta, ascending aorta, aortic arch, descending aorta; all P<0.0001) and with all measures of tracer activity (mean TBRmax, mean TBRmean, max TBR, TBRMDS, all P<0.001). Furthermore, 18F-FDG activity was higher in patients with STEMI compared with those with non-STEMI (TBRmax 2.24±0.32 versus 2.02±0.21, respectively; P=0.03) (Table2), consistent with the former having sustained larger MIs (peak plasma troponin concentration 32 300 ng/L [IQR 10 200 to >50 000 ng/L] versus 3800 ng/L [IQR 1000 to 9200 ng/L]; P<0.0001). Indeed, aortic 18F-FDG activity correlated with peak plasma troponin I concentrations (r=0.43, P=0.01).
Figure 2.
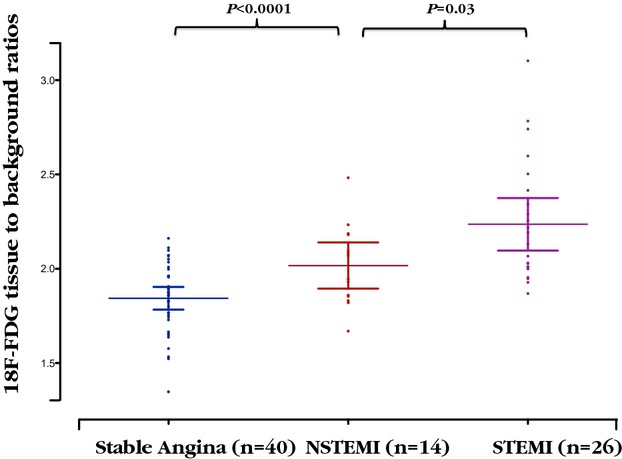
Uptake of 18F-FDG by aortic atherosclerosis in patients with stable and unstable coronary heart disease. Aortic mean of the maximum tissue-to-background ratio for 18F-FDG uptake in patients with stable angina, STEMI, and NSTEMI. Mean with 95% CI. 18F-FDG indicates 18F-fluorodeoxyglucose; NSTEMI, non–ST-segment elevation myocardial infarction; STEMI, ST-segment elevation myocardial infarction.
In patients with stable angina and those with MI, paraspinal uptake of 18F-FDG (mean TBRmax 0.79±0.25 versus 0.75±0.21, respectively; P=0.52) was similar.
C-reactive protein
Compared with patients with stable angina, patients with MI had higher plasma CRP concentrations (6.50 mg/dL [IQR 2.00 to 12.75 mg/dL] versus 2.00 mg/dL [IQR 0.50 to 4.00 mg/dL], P=0.0005). Among patients with MI, patients with STEMI appeared to have higher plasma CRP concentrations (7.50 mg/dL [IQR 2.00 to 13.75 mg/dL] versus 2.50 mg/dL [IQR 1.75 to 9.50 mg/dL]), but this difference did not reach statistical significance (P=0.22). There was a modest correlation between peak troponin I concentrations and CRP (r=0.35, P=0.03).
Outcome Cohort
A total of 1003 patients enrolled in the GRACE database were followed for a median follow-up period of 34 months (IQR 18 to 50 months). Early recurrent MI occurred in 54 patients following index admission, whereas late recurrent MI occurred in 89 patients.
Patients were classified into tertiles according to their peak plasma troponin I concentrations measured during the index admission (tertile 1, ≤220 ng/L; tertile 2, 230 to 6130 ng/L; and tertile 3, ≥6140 ng/L) (Table3). On univariate analysis, the risk of early recurrent infarction (≤30 days) was >4-fold higher among patients in the highest troponin tertile compared with the lowest, whereas risk was doubled in the middle tertile compared with the lowest (Table4 and Figure3). The variables with univariate association of P<0.1 were Killip score ≥2, ST-segment deviation, multivessel disease, and troponin I concentrations. On multivariate analysis, troponin emerged as an independent predictor of early MI after adjustment for other relevant variables (tertile 3 versus 1: relative risk 4.40 [95% CI 1.90 to 10.19], P=0.001; tertile 2 versus 1: relative risk 2.63 [95% CI 1.08 to 6.38], P=0.03). The only other independent predictor was Killip class 2 (1.86 [95% CI 1.06 to 3.24], P=0.03).
Table 3.
Baseline Characteristics of Patients From the GRACE Cohort
| Tertile 1 (n=332) | Tertile 2 (n=336) | Tertile 3 (n=335) | P Value | |
|---|---|---|---|---|
| Peak troponin I, range | ≤220 | 230 to 6130 | ≥6140 | — |
| Age, y | 65±12 | 66±12 | 63±13 | 0.02 |
| GRACE score | 124±47 | 197±49 | 218±41 | <0.0001 |
| Male sex | 212 (63.9) | 226 (67.3) | 254 (75.8) | 0.003 |
| Smoking habit | 214 (64.5) | 243 (72.3) | 235 (70.1) | 0.08 |
| Previous MI | 149 (44.9) | 91 (27.1) | 51 (15.2) | <0.0001 |
| Killip score ≥2 | 82 (24.7) | 114 (33.9) | 98 (29.3) | 0.03 |
| Previous CABG | 61 (18.4) | 25 (7.4) | 12 (3.6) | <0.0001 |
| Previous heart failure | 26 (7.8) | 25 (7.4) | 13 (3.9) | 0.07 |
| Diabetes | 53 (16.0) | 47 (14.0) | 47 (14.0) | 0.71 |
| ST-segment deviation | 77 (23.2) | 142 (42.3) | 275 (82.1) | <0.0001 |
| Multivessel disease | 92 (27.7) | 141 (42.0) | 125 (37.3) | <0.0001 |
| Recurrent MI ≤30 days | 7 (2.1) | 18 (5.4) | 29 (8.7) | 0.001 |
Data are shown as mean±SD or number (percentage). CABG, coronary artery bypass grafting; GRACE, Global Registry of Acute Coronary Events; MI, myocardial infarction.
Table 4.
Univariate Predictors of Early (≤30 Day) and Late (>30 Day) Recurrent MI
| Early (≤30 Day) Recurrent MI | P Value | Late (>30 Day) Recurrent MI | P Value | |
|---|---|---|---|---|
| Age, y | 1.02 (0.99 to 1.04) | 0.14 | 1.04 (1.02 to 1.06) | <0.0001 |
| Male sex | 1.30 (0.70 to 2.43) | 0.45 | 0.89 (0.56 to 1.41) | 0.63 |
| Smoker | 0.82 (0.46 to 1.46) | 0.55 | 1.04 (0.65 to 1.67) | 0.91 |
| Previous MI | 0.69 (0.36 to 1.32) | 0.28 | 3.81 (2.43 to 5.95) | <0.0001 |
| Killip score ≥2 | 1.86 (1.06 to 3.24) | 0.03 | 1.79 (1.14 to 2.82) | 0.01 |
| Previous CABG | 0.94 (0.37 to 2.42) | 0.99 | 2.91 (1.66 to 5.10) | <0.0001 |
| Previous heart failure | 0.86 (0.26 to 2.82) | 0.99 | 2.77 (1.40 to 5.45) | 0.008 |
| Diabetes | 0.72 (0.30 to 1.71) | 0.56 | 1.41 (0.80 to 2.48) | 0.27 |
| ST-segment deviation | 1.81 (1.03 to 3.19) | 0.05 | 1.18 (0.76 to 1.82) | 0.50 |
| Multivessel disease | 1.73 (0.99 to 2.99) | 0.06 | 1.57 (1.01 to 2.44) | 0.05 |
| Troponin tertiles | ||||
| Tertile 2 vs tertile 1 | 2.63 (1.08 to 6.38) | 0.03 | 1.07 (0.64 to 1.79) | 0.79 |
| Tertile 3 vs tertile 1 | 4.40 (1.90 to 10.19) | 0.001 | 0.80 (0.46 to 1.39) | 0.43 |
| Linear trend across tertiles | — | <0.0001 | — | 0.57 |
Data are shown as relative risk (95% CI). CABG, coronary artery bypass grafting; MI, myocardial infarction.
Figure 3.
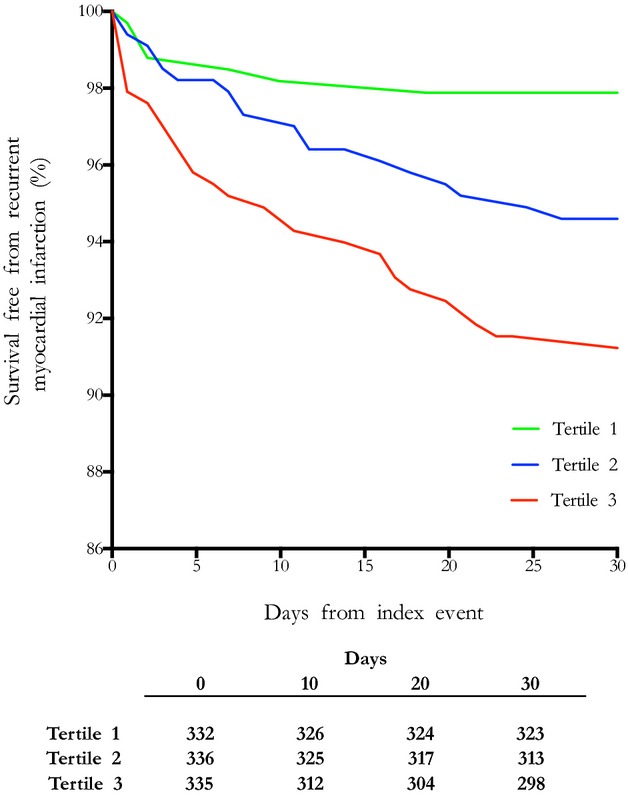
Kaplan–Meier curves demonstrating survival free from early recurrent myocardial infarction at 30 days. Patients were placed in tertiles according to their peak plasma troponin I concentrations (tertile 1, ≤220 ng/L; tertile 2, 230 to 6130 ng/L; tertile 3, ≥6140 ng/L).
In contrast, recurrent late MI was not associated with troponin tertiles on univariate analysis (tertile 2 versus 1: relative risk 1.07 [95% CI 0.64 to 1.79], P=0.79; tertile 3 versus 1: relative risk 0.80 [95% CI 0.46 to 1.39], P=0.43) but rather was more closely related to traditional predictors of MI (Table4).
Discussion
Using 18F-FDG PET imaging, in patients with recent MI, we demonstrated increased metabolic activity in remote aortic atherosclerotic plaques that correlated with the degree of myocardial necrosis and exceeded that observed in patients with stable coronary disease who had a greater atherosclerotic burden. Using the GRACE registry, we explored the clinical relevance of these findings to assess whether infarct size and the associated increase in atherosclerotic inflammation could predict recurrent coronary atherothombotic events in everyday clinical practice. Intriguingly, patients with the largest infarcts had a >4-fold increase in the risk of early recurrent MI, with baseline tertiles of plasma troponin concentration emerging as an independent predictor of these events. Consequently, we provided clinical data to support the hypothesis that MI exacerbates systemic atherosclerotic inflammation, destabilizes remote atheromatous plaque, and causes an increase in early recurrent atherothrombotic events.
Preclinical data have indicated that MI induces a macrophage-driven proinflammatory state31 that directly increases inflammation in remote atheroma and induces further atherosclerosis.12,32,33 In a mouse model, MI induced by coronary artery ligation increased splenic monocyte motility,12 with these cells exiting the spleen en masse and migrating both to the injured myocardium and, crucially, to remote atherosclerotic plaque.34 In addition, sympathetic stimulation following infarction increased the production and liberation of hematopoietic stem and progenitor cells from the bone marrow, resulting in further increases in circulating monocytes and the accumulation of macrophages within regions of remote atheroma.12 The net result was a marked accumulation of macrophages in remote atherosclerotic plaque following MI that resulted in acceleration of the disease process in these areas. The first aim of the current study was to test whether this proinflammatory phenomenon also occurred in humans, using 18F-FDG as a marker of vascular macrophage inflammatory activity. Because we could not measure 18F-FDG uptake before and after MI, we prospectively compared uptake between patients with stable coronary heart disease and those with recent MI.18 Despite a comparable or lower overall aortic and coronary plaque burden, aortic 18F-FDG uptake was 20% higher in patients who had sustained a recent MI. Indeed, the aortic 18F-FDG uptake was consistently increased across all regions of the thoracic aorta. In contrast, paraspinal muscle uptake was similar between the cohorts, indicating a specific vascular and atherosclerotic response rather than generalized nonspecific inflammation across all tissues. Based on clinical factors and peak plasma troponin concentration, patients with STEMI had larger infarcts and demonstrated greater increases in aortic 18F-FDG uptake than those with non-STEMI. We observed good correlation between peak plasma troponin I concentrations and aortic 18F-FDG activity, suggesting that the association may be causal.
Next we investigated whether the observed increases in vascular inflammatory activity were of clinical importance in actual practice. Our imaging cohort was not large enough to address this question, so we turned to data from the well-established GRACE registry. In >1000 patients, we demonstrated that the size of the initial MI emerged as an independent predictor of early recurrent MI over and above traditional risk factors, with a 4-fold increase in these events among those with the biggest infarcts. This finding indicates that the increased vascular inflammation associated with MI translates into adverse clinical events, perhaps due to plaque destabilization and the associated increased risk of rupture. Interestingly, our data also suggest that the clinical effects of this systemic inflammatory response are only transitory, with no association between infarct size and later recurrent events after 30 days, by which time the inflammation will have subsided and plaques begun to stabilize once more. Our data are also consistent with those of the smaller (n=378) Evaluation of MCC-135 for Left Ventricular Salvage in Acute Myocardial Infarction (EVOLVE) randomized controlled trial,35 which also observed an increased early event rate in patients in the highest tertile of troponin concentration, with a trend for an increase in recurrent MI. Our findings are supported by recently reported studies.36–39 Patients with acute coronary syndromes have increased plaque vulnerability in nonculprit lesions, with increased incidence of thin-capped fibroatheromas and adherent thrombus.39 Furthermore, patients with STEMI have accelerated plaque progression in nonculprit lesions on follow-up angiography,37 whereas stenting of such lesions at the same time as culprit lesions reduces adverse cardiovascular events.38 Moreover, patients with unstable coronary disease have higher metabolic carotid plaque activity compared with patients with stable disease, suggesting a panvascular inflammatory process, as indicated by our study.36
Taken together, our data offer clear support for the hypothesis that MI begets early recurrent MI due to upregulated macrophage-mediated inflammation in remote atherosclerotic plaque. It would also offer an explanation for the increased incidence of ischemic stroke following MI and would explain why immediate reperfusion for STEMI and the resultant limitation in myocardial injury confer greater reduction in the risk of recurrent events than revascularization after infarct completion.10,40
Although our data support the hypothesis that MI results in remote arterial inflammation, it could also be argued that more widespread and intense atherosclerotic inflammation occurs prior to the precipitation of MI and that this is the explanation for the association. The correlation between infarct size and the inflammatory signal would support the former explanation; however, to resolve this issue, 18F-FDG imaging would be required both before and after MI, which, given the unpredictable nature of these events, is extremely challenging in the clinical context. We also acknowledge that we did not directly measure MI size and used peak plasma troponin concentration as a surrogate measure; however, peak plasma troponin concentration has a strong correlation with infarct size (r=0.740, P<0.001)30,35 and is a valid surrogate marker, especially when applied to large data sets such as the registry cohort used in this study. Finally, we were unable to measure systemic markers of inflammation such as CRP in our outcome cohort; however, CRP is well known to correlate with troponin release after MI,41–43 and indeed this was observed in our imaging cohort.
In summary, we demonstrated that the presence and extent of MI are associated with increased aortic atherosclerotic inflammation and early recurrent MI, supporting the hypothesis that MI begets MI in humans.
Acknowledgments
We acknowledge the support of the staff at the Edinburgh Heart Centre at the Royal Infirmary of Edinburgh and the radiography and radiochemistry staff of the Clinical Research Imaging Centre.
Sources of Funding
The study was funded by the Chief Scientist Office, Scotland (ETM/160) and the British Heart Foundation (PG/12/8). Dweck, Mills and Newby are supported by the British Heart Foundation (CH/09/002, FS/10/024, FS/10/026). Newby is also supported by a Wellcome Trust Senior Investigator Award (WT103782AIA). Rudd is part-funded by the NIHR Cambridge Biomedical Research Centre. The Wellcome Trust Clinical Research Facility and the Clinical Research Imaging Centre are supported by NHS Research Scotland (NRS) through NHS Lothian.
Disclosures
None.
Supporting Information
Table S1. Interobserver reproducibility of aortic tissue-to-background ratios.
References
- Roger VL, Go AS, Lloyd-Jones DM, Adams RJ, Berry JD, Brown TM, Carnethon MR, Dai S, de Simone G, Ford ES, Fox CS, Fullerton HJ, Gillespie C, Greenlund KJ, Hailpern SM, Heit JA, Ho PM, Howard VJ, Kissela BM, Kittner SJ, Lackland DT, Lichtman JH, Lisabeth LD, Makuc DM, Marcus GM, Marelli A, Matchar DB, McDermott MM, Meigs JB, Moy CS, Mozaffarian D, Mussolino ME, Nichol G, Paynter NP, Rosamond WD, Sorlie PD, Stafford RS, Turan TN, Turner MB, Wong ND, Wylie-Rosett J. Heart disease and stroke statistics—2011 update: a report from the American Heart Association. Circulation. 2011;123:e18–e209. doi: 10.1161/CIR.0b013e3182009701. [DOI] [PMC free article] [PubMed] [Google Scholar]
- Naghavi M, Libby P, Falk E, Casscells SW, Litovsky S, Rumberger J, Badimon JJ, Stefanadis C, Moreno P, Pasterkamp G, Fayad Z, Stone PH, Waxman S, Raggi P, Madjid M, Zarrabi A, Burke A, Yuan C, Fitzgerald PJ, Siscovick DS, de Korte CL, Aikawa M, Juhani Airaksinen KE, Assmann G, Becker CR, Chesebro JH, Farb A, Galis ZS, Jackson C, Jang IK, Koenig W, Lodder RA, March K, Demirovic J, Navab M, Priori SG, Rekhter MD, Bahr R, Grundy SM, Mehran R, Colombo A, Boerwinkle E, Ballantyne C, Insull W, Jr, Schwartz RS, Vogel R, Serruys PW, Hansson GK, Faxon DP, Kaul S, Drexler H, Greenland P, Muller JE, Virmani R, Ridker PM, Zipes DP, Shah PK, Willerson JT. From vulnerable plaque to vulnerable patient: a call for new definitions and risk assessment strategies: part I. Circulation. 2003;108:1664–1672. doi: 10.1161/01.CIR.0000087480.94275.97. [DOI] [PubMed] [Google Scholar]
- Virmani R, Kolodgie FD, Burke AP, Farb A, Schwartz SM. Lessons from sudden coronary death: a comprehensive morphological classification scheme for atherosclerotic lesions. Arterioscler Thromb Vasc Biol. 2000;20:1262–1275. doi: 10.1161/01.atv.20.5.1262. [DOI] [PubMed] [Google Scholar]
- Milonas C, Jernberg T, Lindback J, Agewall S, Wallentin L, Stenestrand U. Effect of angiotensin-converting enzyme inhibition on one-year mortality and frequency of repeat acute myocardial infarction in patients with acute myocardial infarction. Am J Cardiol. 2010;105:1229–1234. doi: 10.1016/j.amjcard.2009.12.032. [DOI] [PubMed] [Google Scholar]
- Goldstein JA, Demetriou D, Grines CL, Pica M, Shoukfeh M, O’Neill WW. Multiple complex coronary plaques in patients with acute myocardial infarction. N Engl J Med. 2000;343:915–922. doi: 10.1056/NEJM200009283431303. [DOI] [PubMed] [Google Scholar]
- Stone GW, Maehara A, Lansky AJ, de Bruyne B, Cristea E, Mintz GS, Mehran R, McPherson J, Farhat N, Marso SP, Parise H, Templin B, White R, Zhang Z, Serruys PW. A prospective natural-history study of coronary atherosclerosis. N Engl J Med. 2011;364:226–235. doi: 10.1056/NEJMoa1002358. [DOI] [PubMed] [Google Scholar]
- Mann J, Davies MJ. Mechanisms of progression in native coronary artery disease: role of healed plaque disruption. Heart. 1999;82:265–268. doi: 10.1136/hrt.82.3.265. [DOI] [PMC free article] [PubMed] [Google Scholar]
- Witt BJ, Ballman KV, Brown RD, Jr, Meverden RA, Jacobsen SJ, Roger VL. The incidence of stroke after myocardial infarction: a meta-analysis. Am J Med. 2006;119:354. doi: 10.1016/j.amjmed.2005.10.058. e1–9. [DOI] [PubMed] [Google Scholar]
- Mooe T, Eriksson P, Stegmayr B. Ischemic stroke after acute myocardial infarction. A population-based study. Stroke. 1997;28:762–767. doi: 10.1161/01.str.28.4.762. [DOI] [PubMed] [Google Scholar]
- Libby P. Mechanisms of acute coronary syndromes and their implications for therapy. N Engl J Med. 2013;368:2004–2013. doi: 10.1056/NEJMra1216063. [DOI] [PubMed] [Google Scholar]
- Swirski FK, Nahrendorf M. Leukocyte behavior in atherosclerosis, myocardial infarction, and heart failure. Science. 2013;339:161–166. doi: 10.1126/science.1230719. [DOI] [PMC free article] [PubMed] [Google Scholar]
- Dutta P, Courties G, Wei Y, Leuschner F, Gorbatov R, Robbins CS, Iwamoto Y, Thompson B, Carlson AL, Heidt T, Majmudar MD, Lasitschka F, Etzrodt M, Waterman P, Waring MT, Chicoine AT, van der Laan AM, Niessen HW, Piek JJ, Rubin BB, Butany J, Stone JR, Katus HA, Murphy SA, Morrow DA, Sabatine MS, Vinegoni C, Moskowitz MA, Pittet MJ, Libby P, Lin CP, Swirski FK, Weissleder R, Nahrendorf M. Myocardial infarction accelerates atherosclerosis. Nature. 2012;487:325–329. doi: 10.1038/nature11260. [DOI] [PMC free article] [PubMed] [Google Scholar]
- Rogers IS, Nasir K, Figueroa AL, Cury RC, Hoffmann U, Vermylen DA, Brady TJ, Tawakol A. Feasibility of FDG imaging of the coronary arteries: comparison between acute coronary syndrome and stable angina. JACC Cardiovasc Imaging. 2010;3:388–397. doi: 10.1016/j.jcmg.2010.01.004. [DOI] [PubMed] [Google Scholar]
- Tawakol A, Migrino RQ, Bashian GG, Bedri S, Vermylen D, Cury RC, Yates D, LaMuraglia GM, Furie K, Houser S, Gewirtz H, Muller JE, Brady TJ, Fischman AJ. In vivo 18F-fluorodeoxyglucose positron emission tomography imaging provides a noninvasive measure of carotid plaque inflammation in patients. J Am Coll Cardiol. 2006;48:1818–1824. doi: 10.1016/j.jacc.2006.05.076. [DOI] [PubMed] [Google Scholar]
- Rudd JH, Warburton EA, Fryer TD, Jones HA, Clark JC, Antoun N, Johnstrom P, Davenport AP, Kirkpatrick PJ, Arch BN, Pickard JD, Weissberg PL. Imaging atherosclerotic plaque inflammation with [18F]-fluorodeoxyglucose positron emission tomography. Circulation. 2002;105:2708–2711. doi: 10.1161/01.cir.0000020548.60110.76. [DOI] [PubMed] [Google Scholar]
- Satomi T, Ogawa M, Mori I, Ishino S, Kubo K, Magata Y, Nishimoto T. Comparison of contrast agents for atherosclerosis imaging using cultured macrophages: FDG versus ultrasmall superparamagnetic iron oxide. J Nucl Med. 2013;54:999–1004. doi: 10.2967/jnumed.112.110551. [DOI] [PubMed] [Google Scholar]
- Rominger A, Saam T, Wolpers S, Cyran CC, Schmidt M, Foerster S, Nikolaou K, Reiser MF, Bartenstein P, Hacker M. 18F-FDG PET/CT identifies patients at risk for future vascular events in an otherwise asymptomatic cohort with neoplastic disease. J Nucl Med. 2009;50:1611–1620. doi: 10.2967/jnumed.109.065151. [DOI] [PubMed] [Google Scholar]
- Fox KA, Dabbous OH, Goldberg RJ, Pieper KS, Eagle KA, Van de Werf F, Avezum A, Goodman SG, Flather MD, Anderson FA, Jr, Granger CB. Prediction of risk of death and myocardial infarction in the six months after presentation with acute coronary syndrome: prospective multinational observational study (GRACE) BMJ. 2006;333:1091. doi: 10.1136/bmj.38985.646481.55. [DOI] [PMC free article] [PubMed] [Google Scholar]
- Thygesen K, Alpert JS, Jaffe AS, Simoons ML, Chaitman BR, White HD. Third universal definition of myocardial infarction. Eur Heart J. 2012;33:2551–2567. doi: 10.1093/eurheartj/ehs184. [DOI] [PubMed] [Google Scholar]
- Joshi NV, Vesey AT, Williams MC, Shah AS, Calvert PA, Craighead FH, Yeoh SE, Wallace W, Salter D, Fletcher AM, van Beek EJ, Flapan AD, Uren NG, Behan MW, Cruden NL, Mills NL, Fox KA, Rudd JH, Dweck MR, Newby DE. F-fluoride positron emission tomography for identification of ruptured and high-risk coronary atherosclerotic plaques: a prospective clinical trial. Lancet. 2013;383:705–713. doi: 10.1016/S0140-6736(13)61754-7. [DOI] [PubMed] [Google Scholar]
- Dweck MR, Chow MW, Joshi NV, Williams MC, Jones C, Fletcher AM, Richardson H, White A, McKillop G, van Beek EJ, Boon NA, Rudd JH, Newby DE. Coronary arterial 18F-sodium fluoride uptake: a novel marker of plaque biology. J Am Coll Cardiol. 2012;59:1539–1548. doi: 10.1016/j.jacc.2011.12.037. [DOI] [PubMed] [Google Scholar]
- Dweck MR, Jones C, Joshi N, Fletcher AM, Richardson H, White A, Marsden M, Pessotto R, Clark JC, Wallace WA, Salter DM, McKillop G, van Beek EJ, Boon NA, Rudd JH, Newby DE. Assessment of valvular calcification and inflammation by positron emission tomography in patients with aortic stenosis. Circulation. 2012;125:76–86. doi: 10.1161/CIRCULATIONAHA.111.051052. [DOI] [PubMed] [Google Scholar]
- Wong ND, Gransar H, Shaw L, Polk D, Moon JH, Miranda-Peats R, Hayes SW, Thomson LE, Rozanski A, Friedman JD, Berman DS. Thoracic aortic calcium versus coronary artery calcium for the prediction of coronary heart disease and cardiovascular disease events. JACC Cardiovasc Imaging. 2009;2:319–326. doi: 10.1016/j.jcmg.2008.12.010. [DOI] [PubMed] [Google Scholar]
- Dweck MR, Khaw HJ, Sng GK, Luo EL, Baird A, Williams MC, Makiello P, Mirsadraee S, Joshi NV, van Beek EJ, Boon NA, Rudd JH, Newby DE. Aortic stenosis, atherosclerosis, and skeletal bone: is there a common link with calcification and inflammation? Eur Heart J. 2013;34:1567–1574. doi: 10.1093/eurheartj/eht034. [DOI] [PubMed] [Google Scholar]
- Fayad ZA, Mani V, Woodward M, Kallend D, Abt M, Burgess T, Fuster V, Ballantyne CM, Stein EA, Tardif JC, Rudd JH, Farkouh ME, Tawakol A. Safety and efficacy of dalcetrapib on atherosclerotic disease using novel non-invasive multimodality imaging (dal-PLAQUE): a randomised clinical trial. Lancet. 2011;378:1547–1559. doi: 10.1016/S0140-6736(11)61383-4. [DOI] [PMC free article] [PubMed] [Google Scholar]
- Santos RD, Rumberger JA, Budoff MJ, Shaw LJ, Orakzai SH, Berman D, Raggi P, Blumenthal RS, Nasir K. Thoracic aorta calcification detected by electron beam tomography predicts all-cause mortality. Atherosclerosis. 2010;209:131–135. doi: 10.1016/j.atherosclerosis.2009.08.025. [DOI] [PubMed] [Google Scholar]
- Fox KA, Steg PG, Eagle KA, Goodman SG, Anderson FA, Jr, Granger CB, Flather MD, Budaj A, Quill A, Gore JM GRACE Investigators. Decline in rates of death and heart failure in acute coronary syndromes, 1999–2006. JAMA. 2007;297:1892–1900. doi: 10.1001/jama.297.17.1892. [DOI] [PubMed] [Google Scholar]
- Steg PG, Goldberg RJ, Gore JM, Fox KAA, Eagle KA, Flather MD, Sadiq I, Kasper R, Rushton-Mellor SK, Anderson FA. Baseline characteristics, management practices, and in-hospital outcomes of patients hospitalized with acute coronary syndromes in the Global Registry of Acute Coronary Events (GRACE) Am J Cardiol. 2002;90:358–363. doi: 10.1016/s0002-9149(02)02489-x. [DOI] [PubMed] [Google Scholar]
- Fox KA, Carruthers KF, Dunbar DR, Graham C, Manning JR, De Raedt H, Buysschaert I, Lambrechts D, Van de Werf F. Underestimated and under-recognized: the late consequences of acute coronary syndrome (GRACE UK-Belgian Study) Eur Heart J. 2010;31:2755–2764. doi: 10.1093/eurheartj/ehq326. [DOI] [PubMed] [Google Scholar]
- Younger JF, Plein S, Barth J, Ridgway JP, Ball SG, Greenwood JP. Troponin-I concentration 72 h after myocardial infarction correlates with infarct size and presence of microvascular obstruction. Heart. 2007;93:1547–1551. doi: 10.1136/hrt.2006.109249. [DOI] [PMC free article] [PubMed] [Google Scholar]
- Ono K, Matsumori A, Shioi T, Furukawa Y, Sasayama S. Cytokine gene expression after myocardial infarction in rat hearts: possible implication in left ventricular remodeling. Circulation. 1998;98:149–156. doi: 10.1161/01.cir.98.2.149. [DOI] [PubMed] [Google Scholar]
- Takaoka M, Uemura S, Kawata H, Imagawa K, Takeda Y, Nakatani K, Naya N, Horii M, Yamano S, Miyamoto Y, Yoshimasa Y, Saito Y. Inflammatory response to acute myocardial infarction augments neointimal hyperplasia after vascular injury in a remote artery. Arterioscler Thromb Vasc Biol. 2006;26:2083–2089. doi: 10.1161/01.ATV.0000232528.93786.0a. [DOI] [PubMed] [Google Scholar]
- Wright AP, Ohman MK, Hayasaki T, Luo W, Russo HM, Guo C, Eitzman DT. Atherosclerosis and leukocyte-endothelial adhesive interactions are increased following acute myocardial infarction in apolipoprotein E deficient mice. Atherosclerosis. 2010;212:414–417. doi: 10.1016/j.atherosclerosis.2010.06.022. [DOI] [PMC free article] [PubMed] [Google Scholar]
- Swirski FK, Nahrendorf M, Etzrodt M, Wildgruber M, Cortez-Retamozo V, Panizzi P, Figueiredo JL, Kohler RH, Chudnovskiy A, Waterman P, Aikawa E, Mempel TR, Libby P, Weissleder R, Pittet MJ. Identification of splenic reservoir monocytes and their deployment to inflammatory sites. Science. 2009;325:612–616. doi: 10.1126/science.1175202. [DOI] [PMC free article] [PubMed] [Google Scholar]
- Chia S, Senatore F, Raffel OC, Lee H, Wackers FJ, Jang IK. Utility of cardiac biomarkers in predicting infarct size, left ventricular function, and clinical outcome after primary percutaneous coronary intervention for ST-segment elevation myocardial infarction. JACC Cardiovasc Interv. 2008;1:415–423. doi: 10.1016/j.jcin.2008.04.010. [DOI] [PubMed] [Google Scholar]
- Kim EJ, Kim S, Kang DO, Seo HS. Metabolic activity of the spleen and bone marrow in patients with acute myocardial infarction evaluated by 18F-fluorodeoxyglucose positron emission tomograpic imaging. Circ Cardiovasc Imaging. 2014;7:454–460. doi: 10.1161/CIRCIMAGING.113.001093. [DOI] [PubMed] [Google Scholar]
- Han Y, Jing J, Tu S, Tian F, Xue H, Chen W, Chen J, Reiber JH, Chen Y. ST elevation acute myocardial infarction accelerates non-culprit coronary lesion atherosclerosis. Int J Cardiovasc Imaging. 2014;30:253–261. doi: 10.1007/s10554-013-0354-z. [DOI] [PubMed] [Google Scholar]
- Wald DS, Morris JK, Wald NJ Investigators P. Preventive angioplasty in myocardial infarction. N Engl J Med. 2014;370:283. doi: 10.1056/NEJMc1314696. [DOI] [PubMed] [Google Scholar]
- Kato K, Yonetsu T, Kim SJ, Xing L, Lee H, McNulty I, Yeh RW, Sakhuja R, Zhang S, Uemura S, Yu B, Mizuno K, Jang IK. Nonculprit plaques in patients with acute coronary syndromes have more vulnerable features compared with those with non-acute coronary syndromes: a 3-vessel optical coherence tomography study. Circ Cardiovasc Imaging. 2012;5:433–440. doi: 10.1161/CIRCIMAGING.112.973701. [DOI] [PubMed] [Google Scholar]
- Ioannidis JP, Katritsis DG. Percutaneous coronary intervention for late reperfusion after myocardial infarction in stable patients. Am Heart J. 2007;154:1065–1071. doi: 10.1016/j.ahj.2007.07.049. [DOI] [PubMed] [Google Scholar]
- Anzai T, Yoshikawa T, Shiraki H, Asakura Y, Akaishi M, Mitamura H, Ogawa S. C-reactive protein as a predictor of infarct expansion and cardiac rupture after a first Q-wave acute myocardial infarction. Circulation. 1997;96:778–784. doi: 10.1161/01.cir.96.3.778. [DOI] [PubMed] [Google Scholar]
- Orn S, Manhenke C, Ueland T, Damas JK, Mollnes TE, Edvardsen T, Aukrust P, Dickstein K. C-reactive protein, infarct size, microvascular obstruction, and left-ventricular remodelling following acute myocardial infarction. Eur Heart J. 2009;30:1180–1186. doi: 10.1093/eurheartj/ehp070. [DOI] [PubMed] [Google Scholar]
- Brunetti ND, Troccoli R, Correale M, Pellegrino PL, Di Biase M. C-reactive protein in patients with acute coronary syndrome: correlation with diagnosis, myocardial damage, ejection fraction and angiographic findings. Int J Cardiol. 2006;109:248–256. doi: 10.1016/j.ijcard.2005.06.021. [DOI] [PubMed] [Google Scholar]
Associated Data
This section collects any data citations, data availability statements, or supplementary materials included in this article.
Supplementary Materials
Table S1. Interobserver reproducibility of aortic tissue-to-background ratios.