Abstract
Background
Exposure of vascular smooth muscle cells (VSMCs) to excessive cyclic stretch such as in hypertension causes a shift in their phenotype. The focal adhesion protein zyxin can transduce such biomechanical stimuli to the nucleus of both endothelial cells and VSMCs, albeit with different thresholds and kinetics. However, there is no distinct vascular phenotype in young zyxin-deficient mice, possibly due to functional redundancy among other gene products belonging to the zyxin family. Analyzing zyxin function in VSMCs at the cellular level might thus offer a better mechanistic insight. We aimed to characterize zyxin-dependent changes in gene expression in VSMCs exposed to biomechanical stretch and define the functional role of zyxin in controlling the resultant VSMC phenotype.
Methods and Results
DNA microarray analysis was used to identify genes and pathways that were zyxin regulated in static and stretched human umbilical artery–derived and mouse aortic VSMCs. Zyxin-null VSMCs showed a remarkable shift to a growth-promoting, less apoptotic, promigratory and poorly contractile phenotype with ≈90% of the stretch-responsive genes being zyxin dependent. Interestingly, zyxin-null cells already seemed primed for such a synthetic phenotype, with mechanical stretch further accentuating it. This could be accounted for by higher RhoA activity and myocardin-related transcription factor-A mainly localized to the nucleus of zyxin-null VSMCs, and a condensed and localized accumulation of F-actin upon stretch.
Conclusions
At the cellular level, zyxin is a key regulator of stretch-induced gene expression. Loss of zyxin drives VSMCs toward a synthetic phenotype, a process further consolidated by exaggerated stretch.
Keywords: gene expression, hypertension, remodeling, vascular smooth muscle cells, zyxin
Chronic hypertension is an important risk factor for adverse cardiovascular events, causing a high degree of morbidity and mortality worldwide.1Consequently, circumferential wall stress in the arterial wall is increased, triggering a remodeling process with profound changes in gene expression of resident cells. This essentially stretch-induced remodeling process is driven by a phenotypic shift, namely, of the vascular smooth muscle cells (VSMCs), which is partly controlled by transcription factors such as activator protein 1 and serum response factor (SRF).2,3 However, these transcription factors are also activated by a variety of other stimuli such as proinflammatory cytokines. Recently, the focal adhesion protein zyxin has been shown to be specifically involved in mechanotransduction in endothelial cells and VSMCs.4–6 Considering the multiplicity of genes and important pathways associated with zyxin in our previous studies,4,5 lack of a distinct vascular phenotype in zyxin-deficient mice was surprising. Functional redundancy among closely related zyxin family members, namely, lipoma preferred partner (LPP) and thyroid hormone receptor interactor 6, could mask the effects of a loss of zyxin in the whole organism. Therefore, analysis of zyxin function at the cellular level in VSMCs might offer a better understanding of its role therein.
Zyxin is a structural protein that regulates actin polymerization at focal adhesions and stress fibers.7,8 It has been implicated in regulation of cell adhesion and cell cycle control, with conflicting reports about its role in cell migration.9 Such processes are crucially involved in adaptive and maladaptive remodeling of blood vessels. Such remodeling processes typically involve an initial increase in VSMC migration and proliferation.10 As opposed to the normally quiescent and contractile phenotype, VSMCs in remodeling arterial blood vessels acquire a synthetic phenotype with altered synthesis of extracellular matrix components.11 In VSMCs, SRF controls gene expression, which drives a contractile or a synthetic phenotype, depending on the transcriptional coactivators that bind to it.12 Among these coactivators are members of the myocardin-related transcription factor (MRTF) family, namely, myocardin, MRTF-A and B. While myocardin binds to SRF and drives the expression of contractile proteins responsible for the differentiated state of VSMCs,13,14 recent evidence suggests that MRTF-A and B promote synthetic gene expression, particularly under conditions of reduced myocardin expression as observed in different models of maladaptive vascular remodeling.15
Exaggerated stretch or increased wall tension such as in hypertension causes an expulsion of myocardin from the nucleus to the cytoplasm,16 resulting in reduced myocardin-dependent SRF activity. Thus, SRF activity can be fine-tuned by changes in the relative amounts of myocardin and MRTF-A bound to SRF. Actin polymerization dynamics is a critical regulator of SRF signaling through promoting the nuclear localization of MRTF-A.17 Actin polymerization in turn is regulated by the Rho family GTPase RhoA among other mechanisms.18 As zyxin is known to play a role in actin remodeling and its expression is regulated by SRF,19 we investigated whether genetic zyxin deficiency affects SRF signaling in VSMCs and thus determines their phenotype. Consequently, we analyzed the role of zyxin in VSMC phenotype control in vitro through (1) gene expression and pathway analyses of static (unstretched) and stretched VSMCs from wild-type and zyxin-deficient mice, and (2) phenotypically characterizing these cells to gain an insight into the underlying mechanism likely involving the MRTF–SRF axis.
Methods
Cell Culture
Mouse VSMCs were isolated from the aorta of wild-type and zyxin-deficient mice aged ≈12 weeks. Isolation of cells from the mouse aorta was performed as described (explant technique)20 with permission of the Regional Council Karlsruhe and in conformance with the Guide for the Care and Use of Laboratory Animals published by the US National Institutes of Health (NIH publication No. 85-23, revised 1996). Human arterial smooth muscle cells were isolated from freshly obtained umbilical cords. The isolation of these cells was approved by the local Ethics Committee (Heidelberg, Germany; reference S-182/2013) and was according to the principles outlined in the Declaration of Helsinki (1997). The isolated cells were cultured in DMEM supplemented with 50 U/mL penicillin, 50 μg/mL streptomycin, and 15% FBS. Cells up to passage 3 were used for all experiments. In order to expose cells to cyclic stretch, they were cultured on collagen I coated BioFlex™ 6-well plates (Flexcell, Hillsborough, NC). An FX-5000 Tension System (Flexcell) was used to subject the cells to 13% cyclic elongation at 0.5 Hz. A cyclic elongation of 18% was used for analyzing the apoptotic response of the cells to stretch and a 15% elongation was used for the RhoA activation assay. Intensity and time period of the stretch stimulus were chosen based on the requirements of the assay. Upon application of static stretch, VSMCs can rearrange their focal contacts, thus escaping the effects of stretch. To circumvent this, cyclic stretch was applied.
Animal Models
All animal studies were performed with permission of the Regional Council Karlsruhe and in conformance with the Guide for the Care and Use of Laboratory Animals published by the US National Institutes of Health (NIH publication No. 85-23, revised 1996). Approximately 24-week-old WT and zyxin−/− mice (n=6 in each group) were prepared for surgical procedures by anesthesia with isoflurane (3% v/v). Deoxycorticosterone acetate-salt (DOCA-salt) slow-release pellets (Innovative Research of America, FL; 50 mg) were subsequently implanted subcutaneously into all mice according to the manufacturer’s instructions. Drinking water was supplemented with 1% (w/v) NaCl for up to 21 days following implantation of the pellets. The resultant increase in blood pressure was monitored by using a tail-cuff blood pressure measuring protocol (NIBP, Harvard Apparatus, Panlab, MA), thereby allowing measurement of both systolic and diastolic blood pressure. The diastolic pressure was calculated by an algorithm using the NIBPchart software. The mice were sacrificed after 21 days and the excised arteries were fixed using zinc fixative followed by processing for histological analyses.
Perfusion of Isolated Mouse Arteries
Femoral arteries were isolated and perfused as previously described.20 In brief, the hindlimb was excised and immersed in perfusion buffer. The femoral artery was separated from the accompanying vein and connective tissue. Segments of the femoral artery were cut and mounted onto glass capillaries with a diameter of 120 μm. The arteries were perfused using the Pressure Myograph System 110P (Danish Myo Technology), and the response of the isolated arterial segments to gradually increasing levels of perfusion pressure was recorded subsequently. Alternatively, perfusion pressure was gradually increased to 50 mm Hg and appropriate vasoconstrictor or vasodilator substances were added to the vessel chamber to induce constriction or dilatation of the artery as required. The MyoVIEW system and software was used to record pressure and vessel diameter. All measurements were performed in a blinded fashion with respect to the genotype of the mice.
Plasmid Construction and Transfection
The zyxin expression plasmid was constructed by subcloning a full-length polymerase chain reaction (PCR) fragment including the first stop codon (positions 305 to 1999; NM_011777) derived from VSMC complementary DNA (cDNA) into the cDNA 6.2/N-EmGFP TOPO 5.9-kb vector, with the TOPO cloning reaction used according to the manufacturer’s recommendations (TOPO Mammalian Expression Vector Kit; Invitrogen). For the LPP expression plasmid, the same principle was used with a full-length PCR fragment including the first stop codon (Positions 551 to 2392; NM_178665.5). Positive constructs were sequenced and used for protein expression. A suspension of the mouse aortic VSMCs was transfected batchwise with the zyxin (or LPP)-expressing construct by using the nucleofection kit (AMAXA) according to the manufacturer’s instructions. A green fluorescent protein (GFP)-expressing construct (Lonza) was used as a control for all transfection experiments. The transgenic expression of zyxin or LPP was confirmed by immunofluorescence and Western blot analysis. Cells were used for further experiments 48 hours post--transfection. Primers used for amplification of the zyxin coding sequence were forward 5′-GGCCATGGCGGCCCCCCGC-3′, and reverse 5′-TCAGGTCTGGGCTCTAGCGGAGTG-3′; For amplification of the LPP coding sequence, primers used were forward 5′-GGCCATGTCTCACCCATCTTG-3′, and reverse 5′-CTACAGGTCAGTGCTTGCCT-3′.
Transfection With siRNA
VSMCs were transfected with short interfering RNA (siRNA) directed against MRTF-A as previously described.21 Scrambled siRNA (Qiagen) was used as a control. Transfection with siRNA targeting zyxin was done as previously described.4 For each well of a 6-well plate, 3 μg of siRNA was diluted in Opti-MEM I (Invitrogen) using 3 μL of MATra-si reagent (IBA) giving a final volume of 200 μL. After incubating the mixture for 20 minutes at ambient temperature, the solution was added onto the cells, which had been pre-incubated in 2 mL Opti-MEM I prior to the transfection. Cells were then incubated on a magnetic plate (IBA) at 37°C and 5% CO2. After 20 minutes, cells were washed and normal cell medium was added to the cells followed by incubation for 48 hours for knockdown of MRTF-A.
Gene Expression Analysis
Total RNA was extracted from the mouse aortic VSMCs using a RNA extraction kit (MachereyNagel) according to the manufacturers’ instructions. RNA was reverse transcribed to cDNA using the Moloney murine leukemia virus reverse transcriptase (M-MLV RT). Quantitative real-time PCR was performed in a LightCycler 1.2 (Roche) using the SYBR Green– based method for detection of gene amplification according to the manufacturer’s instructions. Amplification of the 60S ribosomal protein L32 (RPL32) or GAPDH served as an internal standard. The primer sequences used for amplification are listed in Table1.
Table 1.
Primers for Quantitative Real-Time PCR Analysis
| Gene | Primer Sequence (5′→3′) |
|---|---|
| Cyclin E2 | |
| Forward | ACC AGC CAG ACT CTC CGC AA |
| Reverse | CTC CAG ACA GTA CAG GTG GCC A |
| Fas or CD95 | |
| Forward | TGG ATC TGG GCT GTC CTG CC |
| Reverse | TTT CAC GAA CCC GCC TCC TCA |
| ITGA8 | |
| Forward | TCA AGG CGA GGA ACA GCA A |
| Reverse | CCT TGG GAA CCC GAT GGT |
| MMP13 | |
| Forward | CTTCTTCTTGTTGAGCTGGACTC |
| Reverse | CTGTGGAGGTCACTGTAGACT |
| RGS5 | |
| Forward | GCGGAGAAGGCAAAGCAA |
| Reverse | GTGGTCAATGTTCACCTCTTTAGG |
ITGA8 indicates integrin α8; MMP13, matrix metalloproteinase 13; PCR, polymerase chain reaction; RGS5, regulator of G-protein signaling 5.
Western Blot Analysis
VSMCs were lysed with sample buffer containing 0.1 μmol/L DTT and 0.1% of Triton X-100. For preparing cytosolic and nuclear fractions from cells, separate buffers were prepared. Samples were separated using SDS-PAGE and blotted onto polyvinylidene fluoride (PVDF) membranes. Analysis was done based on a chemiluminescence-based detection system (ImageQuant LAS 4000 mini). Primary antibodies used were rabbit anti-zyxin (B71, provided by M. Beckerle, Huntsman Cancer Institute, Salt Lake City, UT) (1:1000), goat anti-MRTF-A 1:1000 (Santa Cruz Biotechnology), rabbit anti-tubulin 1:1000 (Cell Signaling), mouse anti-RhoA 1:500 (Cytoskeleton), and rabbit anti-LPP 1:1000 (Atlas antibodies).
Nuclear Extraction
The following protocol was used: Mouse aortic VSMCs were lysed using buffer A containing 10 mmol/L HEPES, 10 mmol/L KCl, 1 μmol/L EDTA, 1 μmol/L EGTA, 15% Nonidet, and protease and phosphatase inhibitors. The lysates were centrifuged (12 000g at 4°C for 15 minutes) and the supernatant (cytosolic fraction) was transferred to a new tube and used for Western blot analysis. The residual pellet containing the nuclear fraction was dissolved in 40 μL buffer B consisting of 20 mmol/L HEPES, 400 mmol/L NaCl, 0.01 mol/L EDTA, 0.01 mol/L EGTA, 15% Nonidet, and protease and phosphatase inhibitors. This lysate was sonicated 2 times for 5 seconds at 50 W on ice. After centrifugation (12 000g at 4°C for 15 minutes), the supernatant containing the nuclear fraction was transferred to a new tube and used for Western blot analysis.
Inhibition of RhoA Activity
Wild-type (WT) and zyxin−/− VSMCs were exposed to Rho Inhibitor I (a C3 transferase denoted hereafter as ΔRho) (CT04, Cytoskeleton) at a concentration of 1 μg/mL for 12 or 24 hours, depending on the assay.
RhoA Activation Assay
The RhoA activation assay was performed using a RhoA activation assay kit (Cytoskeleton) according to the manufacturer’s recommendations. Briefly, VSMCs were stretched as discussed before at 15% cyclic elongation for 15 minutes following 24 hours of serum starvation. From the total cell lysates, the active form of RhoA was precipitated using Rhotekin-RBD beads followed by boiling with sample buffer. The resultant solution was analyzed by SDS-PAGE using the aforementioned mouse anti-RhoA antibody. A His-tagged control RhoA protein was used along with a GTPγS-positive control for each experiment.
Immunofluorescence Analysis
Except for staining stress fibers with Alexa fluor 488-labeled phalloidin (Invitrogen) and staining for zyxin, where cells were fixed with 4% paraformaldehyde, in all other cases, cells were fixed with ice-cold methanol for 15 minutes followed by drying for 30 minutes. After rehydration, the fixed cells were blocked with casein solution (0.25% casein, 0.1% BSA, 15 mmol/L NaN3, 50 mmol/L Tris pH 7.6). Cells were incubated at ambient temperature with primary antibody for 1 to 2 hours or overnight at 4°C. In case of arteries, deparaffinized vessel sections were blocked in a similar manner. Primary antibodies used were rabbit anti-zyxin (B71) 1:250, rabbit anti-MRTF-A 1:200 (Abcam), mouse anti-LPP 1:200 (Abcam), rabbit anti-calponin 1:400 (Abcam), and rabbit anti-PCNA 1:200 (Abcam). After washing, cells were incubated with the secondary antibody for 1 hour, for an additional 10 minutes with 4′,6-diamidino-2-phenylindole (DAPI) (Invitrogen), and mounted with Mowiol (Calbiochem). For confocal microscopy analysis, a IX81 microscope equipped with a IX-DSU disk unit and the MT20 multi-wavelength illumination system was used in combination with the cell^R software package (Olympus). Fluorescence intensity was analyzed using this software by comparing size-matched areas from 3 to 5 randomly chosen fields of view.
2-Dimensional-Cell Migration Assay
Mouse aortic VSMCs (1.5×10⁵) were plated in 6-well plastic plates and grown to confluency in DMEM medium containing 15% FBS. The monolayer was wounded by scratching with a pipette tip, and the distance between the edges was measured at ×4 magnification. This was considered as the starting time point (t=0). After 24 hours (t=24), measurements were made again. Migration velocity was calculated in micrometers per hour.
3-Dimensional-Collagen Gel Invasion Assay
A modification of the spheroid angiogenesis assay22 was used to measure the invasion of VSMCs into a collagen gel as previously described.23 Briefly, WT and zyxin−/− VSMCs were seeded (500 cells per spheroid) in growth medium containing methylcellulose in U-bottom 96-well plates for 24 hours. The spheroids were then suspended into a gel containing collagen-type-I and the resultant mixture was allowed to polymerize in 24-well plates. One hundred microliters of DMEM medium (containing 30% FCS) was added after 30 minutes over the gel surface. The cumulative length and number of sprouts originating from individual spheroids was measured after 24 hours at ×10 magnification. For each genotype, at least 10 spheroids were analyzed per experiment.
Proliferation Assay
Mouse aortic VSMCs were seeded into 6-well plastic plates (20 000 cells/well). After 6 hours, cells in a single well were fixed and stained with DAPI and photographed to determine the cell number at the starting time point (t=0). The remaining cells were serum starved for 24 hours. The medium was replaced by fresh DMEM medium with 15% FBS, and images were taken in the same manner after 72 hours. A 0% to 13% cyclic elongation was used for the stretch stimulation where appropriate. The nuclei were counted using a specially designed algorithm with the help of ImageJ software. Five images were taken for each well, and 3 technical replicates were used for each experiment. For statistical analysis, the figure “n” represents the number of biological replicates.
Collagen Gel Compaction Assay
Type I collagen prepared from rat tails was diluted 1:5 with DMEM. Mouse aortic VSMCs were added to the collagen solution previously neutralized using 0.1 mol/L NaOH, at a density of 5000 cells per 0.5 mL in each well of a 48-well plate. After 2 hours incubation at 37°C, the gels were gently detached and diameters were measured at ×4 magnification (considered as the starting time point; t=0). The contraction was monitored after 24 hours. Alternatively, the medium was replaced with fresh medium containing endothelin-1, epinephrine, or norepinephrine (each at 100 nmol/L).
Apoptosis Assay
Apoptosis was detected in VSMCs using the in situ cell death detection kit (Roche) based on TUNEL staining according to the manufacturer’s instructions. Briefly, cells were seeded into 6-well BioFlex™ plates. They were serum starved for 24 hours. The serum-free DMEM medium was replaced with fresh DMEM medium containing 15% FBS followed by treatment with trimeric Fas ligand (400 ng/mL) (IBA) or 1 μmol/L staurosporine (Tocris Biosciences). Cells were exposed to 18% cyclic elongation at 0.5 Hz for 18 hours. This higher intensity of stretch was used to induce more visible and reproducible apoptosis of the cells. The cells were fixed and stained with DAPI in combination with the above kit, and TUNEL-positive nuclei were counted.
Bioinformatic Analysis
Promoter sequences up to 4000 bp upstream of the translation initiation site of the 5 zyxin-dependent stretch-sensitive candidate genes (cyclin E2, Fas or CD95, ITGA8, MMP13, and RGS5) belonging to the species Mus musculus were analyzed using the MatInspector software (Genomatix). Potential SRF and PyPu4 consensus sequences in these promoters were determined in silico. The matrix for the PyPu box is not incorporated in Genomatix. However, matrices corresponding to human and murine ETS1 factors and heat shock factors were found to be similar to the stretch of pyrimidines in the PyPu box reported earlier.4 Therefore, such matrices were used to identify similar putative binding sequences closely resembling the PyPu box.
DNA Microarray Analysis
In order to study the zyxin-dependent regulation of stretch-sensitive genes, 3 batches of cells each were stretched for 6 hours (0% to 10% cyclic elongation at 0.5 Hz) using aortic VSMCs from zyxin-null mice (quiescent or stretched) and aortic VSMCs from wild-type littermates as a control (quiescent or stretched). Total RNA was isolated (as mentioned above) and processed for DNA microarray analysis according to the manufacturer’s instructions. Gene expression profiling was performed using the GeneChip® Mouse Genome 430 2.0 Array from Affymetrix. A custom CDF Version 17 with Entrez-based gene definitions was used to annotate the arrays. The raw fluorescence intensity values were normalized applying quantile normalization. A commercial software package SAS JMP10 Genomics, version 6, from SAS was used to analyze differential gene expression based on ANOVA. A false positive rate of a=0.05 with false discovery rate correction was taken as the level of significance. The false discovery rate value is the adjusted P-value, which estimates the probability of obtaining the observed sampleresults when the null hypothesis is actually true. The probability value ranges between 0 (0%) and 1 (100%). The false discovery rate of 1 means 100% (ie, 100% probability of obtaining the observed sample results when the null hypothesis [tested with ANOVA] is actually true).
Pathway analysis
Gene Set Enrichment Analysis was used to determine whether defined lists (or sets) of genes exhibit a statistically significant bias in their distribution within a ranked gene list (see http://www.broadinstitute.org/gsea/ for details).24 Gene Ontology terms related to molecular function (GO_mf) were used and pathways belonging to various cell functions were obtained from public external databases (KEGG, http://www.genome.jp/kegg/). The raw and normalized data are deposited in the Gene Expression Omnibus database (http://www.ncbi.nlm.nih.gov/geo/; accession No. GSE60447).
Statistical Analysis
All results are expressed as means±SEM of n individual experiments. For analyzing differences between 2 individual experimental groups, an unpaired Student t test was used with P<0.05 considered statistically significant. Differences among 3 or more experimental groups were analyzed by 1-way ANOVA, followed by a Tukey’s multiple comparison test for selected pairs of groups with a probability value of P<0.05 considered statistically significant.
Results
The Majority of Stretch-Sensitive Genes in VSMCs Are Zyxin-Dependent
Exposure to (cyclic) stretch causes zyxin translocation from focal adhesions to the nucleus in both native and cultured VSMCs5,20 (Figure 1). Since nuclear zyxin is responsible for regulation of 68% of stretch-sensitive genes in human endothelial cells,4 we performed a genome-wide DNA microarray analysis to test whether zyxin was equally important in regulating mechanosensitive gene expression in VSMCs. Approximately 90% of the stretch-sensitive genes in these cells were regulated by zyxin (Figure 2A through 2C). Five candidate genes having putative association with at least 1 of the critical pathways regulating VSMC behavior (ie, proliferation, migration, contraction, and apoptosis) were validated by real-time reverse transcriptase polymerase chain reaction (RT-PCR) (Figure 2D). Expression of all 5 genes (ie, cyclin E2, tumor necrosis factor receptor superfamily member 6 [Fas or CD95], integrin α8 [ITGA8], matrix metalloproteinase 13 [MMP13], and regulator of G-protein signaling 5 [RGS5]) was found to be stretch sensitive and zyxin dependent.
Figure 1.
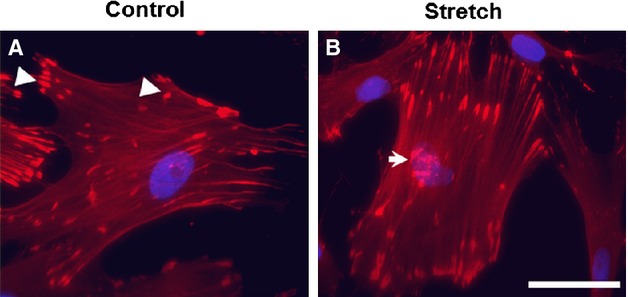
Cyclic stretch induces nuclear translocation of zyxin in vascular smooth muscle cells (VSMCs). A, Confocal immunofluorescence images of aortic VSMCs from wild-type mice as control show a punctate distribution of zyxin at focal contact points to the substrate (indicated by white arrowheads). B, VSMCs exposed to 13% cyclic elongation at 0.5 Hz for 1 hour show a marked translocation of zyxin from focal adhesions to the nucleus (indicated by white arrow). Scale bar indicates 50 μm.
Figure 2.
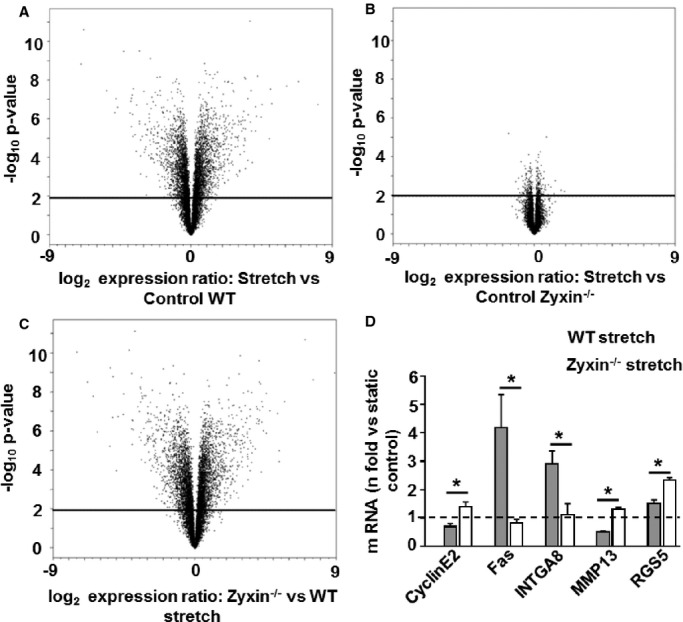
Zyxin is a crucial regulator of stretch-sensitive genes in VSMCs. A through C, Volcano plot analysis of changes in expression of genes in stretched WT and zyxin−/− VSMCs (fold expression vs calculated probability). Cells were stretched at 10% cyclic elongation for 6 hours and compared to unstretched (static) control cells. Genes that were differentially and significantly regulated (P<0.01) are displayed above the black solid line (n=3 for all experimental groups). 4718 genes were stretch-responsive in WT compared to only 315 in zyxin−/− VSMCs. D, Verification of 5 microarray target genes by real-time RT-PCR, *P<0.05 as indicated, n=3 for all experimental groups. ITGA8 indicates integrin α8; MMP13, matrix metalloproteinase 13; RGS5, regulator of G-protein signaling 5; RT-PCR, reverse transcriptase polymerase chain reaction; VSMCs, vascular smooth muscle cells; WT, wild type.
Gene Set Enrichment Analysis (Tables2 through 6) revealed that zyxin regulates distinct pathways in response to stretch. Out of those, we selected 4 based on their importance in determining the phenotype of VSMCs especially under pathophysiological conditions. Accordingly, proliferation, apoptosis, migration, and contractility of zyxin-deficient VSMCs were analyzed in further detail by in vitro functional assays to determine the significance of the observed changes in gene expression.
Table 2.
Stretch-Regulated Zyxin-Induced Pathways
| No. | Pathway (Source) Functional Description | Stretch vs Quiescent P (NES/FDR) | Stretch vs Quiescent/Zyxin Knockout P (NES/FDR) |
|---|---|---|---|
| 1 | Central nervous system neuron development (GO pathway) | 0.000* (1.95/0.057) | 0.900 (0.68/1.000) |
| 2 | Muscle contraction (GO pathway) | 0.000* (1.94/0.036) | 0.394 (1.02/1.000) |
| 3 | Muscle system process (GO pathway) | 0.000* (1.91/0.045) | 0.406 (1.03/1.000) |
| 4 | Ear morphogenesis (GO pathway) | 0.006* (1.66/0.221) | 0.132 (1.24/1.000) |
| 5 | Forebrain development (GO pathway) | 0.005* (1.64/0.243) | 0.308 (1.07/1.000) |
| 6 | Regionalization (GO pathway) | 0.000* (1.63/0.246) | 0.820 (0.85/1.000) |
| 7 | Inner ear morphogenesis (GO pathway) | 0.008* (1.63/0.242) | 0.114 (1.26/1.000) |
| 8 | Actin cytoskeleton organization and biogenesis (GO pathway) | 0.005* (1.62/0.236) | 0.252 (1.11/1.000) |
| 9 | Blood vessel morphogenesis (GO pathway) | 0.002* (1.62/0.236) | 0.252 (1.09/1.000) |
| 10 | Embryonic morphogenesis (GO pathway) | 0.005* (1.60/0.261) | 0.483 (0.99/1.000) |
| 11 | Ear development (GO pathway) | 0.007* (1.58/0.259) | 0.588 (0.93/1.000) |
| 12 | Cell maturation (GO pathway) | 0.009* (1.57/0.264) | 0.725 (0.86/1.000) |
| 13 | Di-, tri-valent inorganic cation transport (GO pathway) | 0.010* (1.56/0.276) | 0.456 (1.00/1.000) |
| 14 | Actin filament–based process (GO pathway) | 0.003* (1.56/0.275) | 0.244 (1.09/1.000) |
| 15 | Muscle fiber development (GO pathway) | 0.016* (1.55/0.276) | 0.505 (0.97/1.000) |
| 16 | Angiogenesis (GO pathway) | 0.007* (1.54/0.285) | 0.290 (1.07/1.000) |
| 17 | Anatomical structure formation (GO pathway) | 0.005* (1.54/0.283) | 0.424 (1.01/1.000) |
| 18 | Organ morphogenesis (GO pathway) | 0.000* (1.52/0.289) | 0.062 (1.18/1.000) |
| 19 | Vasculature development (GO pathway) | 0.007* (1.51/0.302) | 0.279 (1.07/1.000) |
| 20 | Blood vessel development (GO pathway) | 0.005* (1.51/0.299) | 0.273 (1.07/1.000) |
| 21 | Embryonic development (GO pathway) | 0.000* (1.51/0.290) | 0.332 (1.04/1.000) |
| 22 | Neurogenesis (GO pathway) | 0.002* (1.50/0.285) | 0.599 (0.96/1.000) |
| 23 | Membrane organization and biogenesis (GO pathway) | 0.008* (1.49/0.288) | 0.307 (1.05/1.000) |
| 24 | Cell–cell adhesion (GO pathway) | 0.020* (1.42/0.344) | 0.728 (0.91/1.000) |
| 25 | Cell morphogenesis (GO pathway) | 0.002* (1.42/0.336) | 0.761 (0.92/1.000) |
| 26 | Cellular structure morphogenesis (GO pathway) | 0.001* (1.40/0.355) | 0.715 (0.93/1.000) |
| 27 | Antigen processing and presentation (KEGG) | 0.013* (1.68/0.203) | 0.550 (0.95/1.000) |
| 28 | Dilated cardiomyopathy (KEGG) | 0.004* (1.67/0.187) | 0.721 (0.87/1.000) |
Selective GSEA-pathway analysis of stretch-sensitive genes in mouse aortic VSMCs (third column) and the role of zyxin therein deduced from changes in gene expression following zyxin deficiency (fourth column). Zyxin-induced pathways that respond in similar fashion in both groups are listed. Quiescent state indicates static VSMCs that were unstretched. All pathways are derived from the canonical pathway sets provided by KEGG (http://www.genome.jp/kegg/) and GO (pathways molecular function; http://www.geneontology.org). Only pathways found to be significantly altered (P≤0.02) by cyclic stretch and/or zyxin-deficiency have been included. As an estimate for the actual grade of enrichment and activation/inhibition of a given pathway, NES are listed. Additionally, FDR have been included; a value of FDR ≤0.4 is regarded to be significant. For analyses with altered parameters, please use the raw data provided at NCBI GEO (http://www.ncbi.nlm.nih.gov/geo/query) using the sample number [GSE60447] and the link http://www.ncbi.nlm.nih.gov/geo/query/acc.cgi?token=wdorceuihfapraf&acc=GSE60447. In GSEA, the ranking of genes is with respect to the degree of changes in expression. The normalized enrichment score NES reflects the degree to which a pathway (defined by a set of genes) is overrepresented at the top or bottom of this ranked list of genes for a given comparison (eg, quiescent VSMCs vs stretched VSMCs). Thus, a very high value for NES (eg, NES >1.8) reflects a marked activation of the pathway. Accordingly, a value of, eg, NES <−1.6 defines a significant inhibition of the pathway. The false discovery rate FDR enables estimation of the probability that a pathway defined to be significantly regulated by a high NES is falsely positive (eg, FDR=0.4 defines the probability that 6 of 10 predictions by GSEA are correct). The FDR of 1 means 100% (ie, 100% probability of obtaining the observed sample results when the null hypothesis [tested with ANOVA] is actually true). FDR indicates false discovery rates; GO, Gene Ontology; GEO, Gene Expression Omnibus; GSEA, Gene Set Enrichment Analysis; KEGG, Kyoto Encyclopedia of Genes and Genomes; NCBI, National Center for Biotechnology Information; NES, normalized enrichment scores; VSMCs, vascular smooth muscle cells.
P≤0.02.
Table 6.
Stretch-Regulated Zyxin-Repressed Pathways With Opposing Values of NES
| No. | Pathway (Source) Functional Description | Stretch vs Quiescent P (NES/FDR) | Stretch vs Quiescent/Zyxin Knockout P (NES/FDR) |
|---|---|---|---|
| 1 | M phase of mitotic cell cycle (GO pathway) | 0.000* (−1.92/0.024) | 0.000* (2.03/0.020) |
| 2 | Mitosis (GO pathway) | 0.000* (−1.94/0.024) | 0.000* (2.01/0.016) |
| 3 | M phase (GO pathway) | 0.000* (−1.96/0.024) | 0.000* (1.93/0.037) |
| 4 | Chromosome segregation (GO pathway) | 0.000* (−2.09/0.003) | 0.000* (1.92/0.035) |
| 5 | Mitotic cell cycle (GO pathway) | 0.008* (−1.48/0.285) | 0.000* (1.87/0.055) |
| 6 | Cell cycle phase (GO pathway) | 0.000* (−1.82/0.048) | 0.000* (1.83/0.079) |
| 7 | Response to oxidative stress (GO pathway) | 0.029 (−1.49/0.275) | 0.002* (1.77/0.137) |
| 8 | Cell division (GO pathway) | 0.000* (−1.75/0.080) | 0.000* (1.74/0.162) |
| 9 | Microtubule-based movement (GO pathway) | 0.816 (−0.81/0.967) | 0.002* (1.67/0.297) |
| 10 | Sister chromatid segregation (GO pathway) | 0.045 (−1.59/0.195) | 0.006* (1.66/0.300) |
| 11 | Mitotic sister chromatid segregation (GO pathway) | 0.024 (−1.57/0.209) | 0.009* (1.65/0.277) |
| 12 | Cytoskeleton-dependent intracellular transport (GO pathway) | 0.862 (−0.79/0.975) | 0.002* (1.65/0.265) |
| 13 | Cell cycle process (GO pathway) | 0.000* (−1.46/0.318) | 0.000* (1.54/0.476) |
| 14 | Starch and sucrose metabolism (KEGG) | 0.063 (−1.43/0.333) | 0.008* (1.78/0.147) |
Selective GSEA-pathway analysis of stretch-sensitive genes in mouse aortic VSMCs (third column) and the role of zyxin therein deduced from changes in gene expression following zyxin-deficiency (fourth column). Zyxin-repressed pathways that respond in opposite fashion in the 2 groups are shown. Quiescent state indicates static VSMCs which were unstretched. All pathways are derived from the canonical pathway sets provided by KEGG (http://www.genome.jp/kegg/) and GO (pathways molecular function; http://www.geneontology.org). Only pathways found to be significantly altered (P≤0.02) by cyclic stretch and/or zyxin-deficiency have been included. NES are listed. Additionally, FDR have been included; a value of FDR ≤0.4 is regarded to be significant. These values are interpreted in the same manner as outlined in the legend to Table2. Raw data provided at NCBI GEO (http://www.ncbi.nlm.nih.gov/geo/query) using the sample number [GSE60447]. FDR indicates false discovery rates; GEO, Gene Expression Omnibus; GO, Gene Ontology; GSEA, Gene Set Enrichment Analysis; KEGG, Kyoto Encyclopedia of Genes and Genomes; NCBI, National Center for Biotechnology Information; NES, normalized enrichment scores; VSMCs, vascular smooth muscle cells.
P≤0.02.
Table 3.
Stretch-Regulated Zyxin-Maintained Pathways
| No. | Pathway (Source) Functional Description | Stretch vs Quiescent P (NES/FDR) | Stretch vs Quiescent/Zyxin Knockout P (NES/FDR) |
|---|---|---|---|
| 1 | Lymphocyte differentiation (GO pathway) | 0.553 (−0.95/0.824) | 0.002* (−1.72/0.364) |
| 2 | Positive regulation of T-cell activation (GO pathway) | 0.560 (−0.95/0.828) | 0.006* (−1.68/0.327) |
| 3 | T-cell differentiation (GO pathway) | 0.416 (−1.02/0.766) | 0.002* (−1.63/0.385) |
| 4 | Epithelial-cell proliferation (GO pathway) | 0.318 (−1.09/0.699) | 0.010* (−1.63/0.345) |
| 5 | Protein amino acid N-linked glycosylation (GO pathway) | 0.434 (−1.01/0.777) | 0.015* (−1.58/0.400) |
| 6 | Adaptive immune response (GO pathway) | 0.183 (−1.19/0.656) | 0.012* (−1.54/0.372) |
| 7 | Adaptive immune response superfamily domains (GO pathway) | 0.203 (−1.18/0.651) | 0.002* (−1.54/0.363) |
| 8 | Leukocyte differentiation (GO pathway) | 0.761 (−0.87/0.942) | 0.004* (−1.51/0.350) |
Selective GSEA-pathway analysis of stretch-sensitive genes in mouse aortic VSMCs (third column) and the role of zyxin therein deduced from changes in gene expression following zyxin-deficiency (fourth column). Zyxin-maintained pathways that respond in similar fashion in both groups are shown. Quiescent state indicates static VSMCs that were unstretched. All pathways are derived from the canonical pathway sets provided by KEGG (http://www.genome.jp/kegg/) and GO (pathways molecular function; http://www.geneontology.org). Only pathways found to be significantly altered (P≤0.02) by cyclic stretch and/or zyxin-deficiency have been included. NES are listed. Additionally, FDR have been included; a value of FDR ≤0.4 is regarded to be significant. These values are interpreted in the same manner as outlined in the legend to Table2. Raw data provided at NCBI GEO (http://www.ncbi.nlm.nih.gov/geo/query) using the sample number [GSE60447]. FDR indicates false discovery rates; GEO, Gene Expression Omnibus; GO, Gene Ontology; GSEA, Gene Set Enrichment Analysis; KEGG, Kyoto Encyclopedia of Genes and Genomes; NCBI, National Center for Biotechnology Information; NES, normalized enrichment scores; VSMCs, vascular smooth muscle cells.
P≤0.02.
Table 4.
Stretch-Regulated Zyxin-Repressed Pathways
| No. | Pathway (Source) Functional Description | Stretch vs Quiescent P (NES/FDR) | Stretch vs Quiescent/Zyxin Knockout P (NES/FDR) |
|---|---|---|---|
| 1 | TGF-β receptor signaling pathway (GO pathway) | 0.246 (1.19/0.501) | 0.006* (1.68/0.302) |
| 2 | Mismatch repair (KEGG) | 0.000* (−2.12/0.000) | 0.375 (−1.06/0.961) |
| 3 | Homologous recombination (KEGG) | 0.002* (−1.82/0.056) | 0.105 (−1.34/0.698) |
| 4 | Purine metabolism (KEGG) | 0.012* (−1.44/0.331) | 0.277 (−1.09/0.920) |
| 5 | DNA repair (GO pathway) | 0.000* (−1.71/0.106) | 0.661 (−0.92/1.000) |
| 6 | Epithelial-cell differentiation (GO pathway) | 0.007* (−1.71/0.103) | 0.697 (−0.86/1.000) |
| 7 | DNA recombination (GO pathway) | 0.005* (−1.70/0.105) | 0.381 (−1.05/0.917) |
| 8 | Reproductive development process (GO pathway) | 0.007* (−1.69/0.110) | 0.577 (−0.94/1.000) |
| 9 | Covalent chromatin modification (GO pathway) | 0.004* (−1.67/0.125) | 0.954 (−0.65/1.000) |
| 10 | Response to DNA damage stimulus (GO pathway) | 0.005* (−1.55/0.239) | 0.788 (−0.89/1.000) |
| 11 | Response to endogenous stimulus (GO pathway) | 0.000* (−1.51/0.275) | 0.980 (−0.78/1.000) |
Selective GSEA-pathway analysis of stretch-sensitive genes in mouse aortic VSMCs (third column) and the role of zyxin therein deduced from changes in gene expression following zyxin deficiency (fourth column). Zyxin-repressed pathways that respond in similar fashion in both groups are shown. Quiescent state indicates static VSMCs that were unstretched. All pathways are derived from the canonical pathway sets provided by KEGG (http://www.genome.jp/kegg/) and GO (pathways molecular function; http://www.geneontology.org). Only pathways found to be significantly altered (P≤0.02) by cyclic stretch and/or zyxin-deficiency have been included. NES are listed. Additionally, FDR have been included; a value of FDR ≤0.4 is regarded to be significant. These values are interpreted in the same manner as outlined in the legend to Table2. Raw data provided at NCBI GEO (http://www.ncbi.nlm.nih.gov/geo/query) using the sample number [GSE60447]. FDR indicates false discovery rates; GEO, Gene Expression Omnibus; GO, Gene Ontology; GSEA, Gene Set Enrichment Analysis; KEGG, Kyoto Encyclopedia of Genes and Genomes; NCBI, National Center for Biotechnology Information; NES, normalized enrichment scores; TGF, transforming growth factor; VSMCs, vascular smooth muscle cells.
P≤0.02.
Table 5.
Stretch-Regulated Zyxin-Induced Pathways With Opposing Values of NES
| No. | Pathway (Source) Functional Description | Stretch vs Quiescent P (NES/FDR) | Stretch vs Quiescent/Zyxin Knockout P (NES/FDR) |
|---|---|---|---|
| 1 | Dorsal ventral pattern formation (GO pathway) | 0.000* (2.01/0.068) | 0.742 (−0.83/1.000) |
| 2 | Endoderm development (GO pathway) | 0.002* (1.96/0.074) | 0.739 (−0.78/1.000) |
| 3 | Cell fate determination (GO pathway) | 0.000* (1.95/0.043) | 0.602 (−0.90/1.000) |
| 4 | Axonogenesis (GO pathway) | 0.000* (1.86/0.085) | 0.035 (−1.29/0.610) |
| 5 | Neuron morphogenesis during differentiation (GO pathway) | 0.000* (1.84/0.106) | 0.065 (−1.26/0.661) |
| 6 | Neurite morphogenesis (GO pathway) | 0.000* (1.83/0.101) | 0.057 (−1.26/0.645) |
| 7 | Neuron development (GO pathway) | 0.000* (1.83/0.098) | 0.117 (−1.16/0.771) |
| 8 | Extracellular matrix organization and biogenesis (GO pathway) | 0.002* (1.83/0.090) | 0.195 (−1.18/0.756) |
| 9 | Neurite development (GO pathway) | 0.000* (1.81/0.098) | 0.093 (−1.20/0.732) |
| 10 | Oxygen and reactive oxygen species metabolic process (GO pathway) | 0.006* (1.78/0.140) | 0.221 (−1.19/0.744) |
| 11 | Myoblast development (GO pathway) | 0.008* (1.78/0.137) | 0.786 (−0.78/1.000) |
| 12 | Extracellular structure organization and biogenesis (GO pathway) | 0.002* (1.77/0.136) | 0.288 (−1.08/0.857) |
| 13 | Cellular morphogenesis during differentiation (GO pathway) | 0.000* (1.75/0.155) | 0.099 (−1.19/0.745) |
| 14 | Cell fate commitment (GO pathway) | 0.002* (1.75/0.156) | 0.025 (−1.46/0.420) |
| 15 | Cell projection morphogenesis (GO pathway) | 0.000* (1.74/0.167) | 0.427 (−1.01/0.982) |
| 16 | Myoblast maturation (GO pathway) | 0.017* (1.74/0.159) | 0.806 (−0.78/1.000) |
| 17 | Pattern specification process (GO pathway) | 0.000* (1.73/0.164) | 0.589 (−0.96/1.000) |
| 18 | Cell part morphogenesis (GO pathway) | 0.000* (1.72/0.168) | 0.405 (−1.01/0.962) |
| 19 | Regulation of B-cell activation (GO pathway) | 0.006* (1.72/0.162) | 0.262 (−1.14/0.818) |
| 20 | Embryonic skeletal development (GO pathway) | 0.012* (1.72/0.159) | 0.392 (−1.04/0.918) |
| 21 | Cell projection organization and biogenesis (GO pathway) | 0.000* (1.72/0.158) | 0.455 (−0.99/0.996) |
| 22 | Positive regulation of B-cell activation (GO pathway) | 0.008* (1.71/0.155) | 0.824 (−0.77/1.000) |
| 23 | Response to virus (GO pathway) | 0.010* (1.71/0.161) | 0.072 (−1.41/0.430) |
| 24 | Axon guidance (GO pathway) | 0.005* (1.69/0.176) | 0.013* (−1.57/0.411) |
| 25 | Neuron fate commitment (GO pathway) | 0.006* (1.69/0.171) | 0.692 (−0.85/0.999) |
| 26 | Heart development (GO pathway) | 0.000* (1.69/0.166) | 0.078 (−1.21/0.705) |
| 27 | Negative regulation of cell differentiation (GO pathway) | 0.016* (1.63/0.245) | 0.137 (−1.22/0.700) |
| 28 | Notch signaling pathway (GO pathway) | 0.007* (1.63/0.238) | 0.728 (−0.85/1.000) |
| 29 | Circulatory system process (GO pathway) | 0.009* (1.63/0.234) | 0.067 (−1.28/0.613) |
| 30 | Response to other organism (GO pathway) | 0.012* (1.62/0.240) | 0.148 (−1.20/0.732) |
| 31 | Blood circulation (GO pathway) | 0.005* (1.59/0.265) | 0.087 (−1.27/0.643) |
| 32 | Neuron differentiation (GO pathway) | 0.000* (1.58/0.266) | 0.346 (−1.03/0.946) |
| 33 | Muscle-cell differentiation (GO pathway) | 0.007* (1.58/0.259) | 0.083 (−1.30/0.602) |
| 34 | Negative regulation of developmental process (GO pathway) | 0.011* (1.55/0.276) | 0.149 (−1.18/0.756) |
| 35 | Tube morphogenesis (GO pathway) | 0.005* (1.54/0.278) | 0.020* (−1.36/0.535) |
| 36 | Small GTPase-mediated signal transduction (GO pathway) | 0.003* (1.53/0.288) | 0.970 (−0.83/1.000) |
| 37 | Muscle development (GO pathway) | 0.009* (1.53/0.285) | 0.363 (−1.02/0.945) |
| 38 | Negative regulation of cell proliferation (GO pathway) | 0.010* (1.52/0.289) | 0.697 (−0.89/1.000) |
| 39 | Taxis (GO pathway) | 0.014* (1.51/0.294) | 0.006* (−1.53/0.361) |
| 40 | Innate immune response (GO pathway) | 0.020* (1.51/0.292) | 0.088 (−1.27/0.630) |
| 41 | Chemotaxis (GO pathway) | 0.014* (1.50/0.294) | 0.007* (−1.53/0.370) |
| 42 | Positive regulation of multicellular organismal process (GO pathway) | 0.014* (1.50/0.290) | 0.011* (−1.51/0.348) |
| 43 | Generation of neurons (GO pathway) | 0.002* (1.50/0.288) | 0.484 (−0.99/0.993) |
| 44 | Regulation of small GTPase-mediated signal transduction (GO pathway) | 0.012* (1.50/0.285) | 0.442 (−0.99/0.994) |
| 45 | Behavior (GO pathway) | 0.002* (1.48/0.286) | 0.369 (−1.02/0.943) |
| 46 | Skeletal development (GO pathway) | 0.012* (1.47/0.293) | 0.692 (−0.91/1.000) |
| 47 | Regulation of signal transduction (GO pathway) | 0.000* (1.45/0.319) | 0.165 (−1.11/0.862) |
| 48 | Response to biotic stimulus (GO pathway) | 0.016* (1.40/0.357) | 0.284 (−1.08/0.854) |
| 49 | Regulation of multicellular organismal process (GO pathway) | 0.017* (1.39/0.362) | 0.044 (−1.24/0.673) |
| 50 | Systemic lupus erythematosus (KEGG) | 0.002* (1.72/0.263) | 0.100 (−1.29/0.715) |
| 51 | Endocytosis (KEGG) | 0.000* (1.71/0.203) | 0.125 (−1.17/0.899) |
| 52 | Proteasome (KEGG) | 0.000* (1.66/0.173) | 0.945 (−0.66/1.000) |
Selective GSEA-pathway analysis of stretch-sensitive genes in mouse aortic VSMCs (third column) and the role of zyxin therein deduced from changes in gene expression following zyxin-deficiency (fourth column). Zyxin-induced pathways that respond in opposite fashion in the 2 groups are shown. Quiescent state indicates static VSMCs that were unstretched. All pathways are derived from the canonical pathway sets provided by KEGG (http://www.genome.jp/kegg/) and GO (pathways molecular function; http://www.geneontology.org). Only pathways found to be significantly altered (P≤0.02) by cyclic stretch and/or zyxin-deficiency have been included. NES are listed. Additionally, FDR have been included; a value of FDR ≤0.4 is regarded to be significant. These values are interpreted in the same manner as outlined in the legend to Table2. Raw data provided at NCBI GEO (http://www.ncbi.nlm.nih.gov/geo/query) using the sample number [GSE60447]. FDR indicates false discovery rates; GEO, Gene Expression Omnibus; GO, Gene Ontology; GSEA, Gene Set Enrichment Analysis; KEGG, Kyoto Encyclopedia of Genes and Genomes; NCBI, National Center for Biotechnology Information; NES, normalized enrichment scores; VSMCs, vascular smooth muscle cells.
P≤0.02.
Zyxin Negatively Regulates Proliferation and Sensitizes Stretched VSMCs to Fas Ligand (FasL)-Induced Apoptosis
Based on the prominent role of 2 validated genes, namely, cyclin E2 in cell cycle control hence proliferation and the growth-promoting properties of MMP13, we compared the proliferation rate of zyxin-deficient and WT VSMCs. Already without stretch, zyxin-null VSMCs displayed a markedly increased rate of proliferation in vitro, which within 72 hours was ≈1.6-fold higher as in WT cells (Figure 3A). The capacity of these cells to proliferate was apparently near maximum, as exposure to cyclic stretch caused no further increase in proliferation but more clearly (2.2-fold) exceeded that of the stretched WT VSMCs (Figure 3A). In fact, stretch led to a decrease in proliferation of WT VSMCs, which could be due to induction of apoptosis in these cells. To determine whether this enhanced proliferative response is strictly zyxin dependent, we tested whether re-expression of zyxin in the zyxin-null cells (Figure 4) could normalize proliferation of these cells. Transient re-expression of zyxin in fact reduced their proliferation rate to that observed with WT VSMCs while the control plasmid GFP had no significant effect (Figure 3A). It was technically not possible to re-express zyxin in stretched VSMCs as stretch caused a significant loss of transfected cells.
Figure 3.
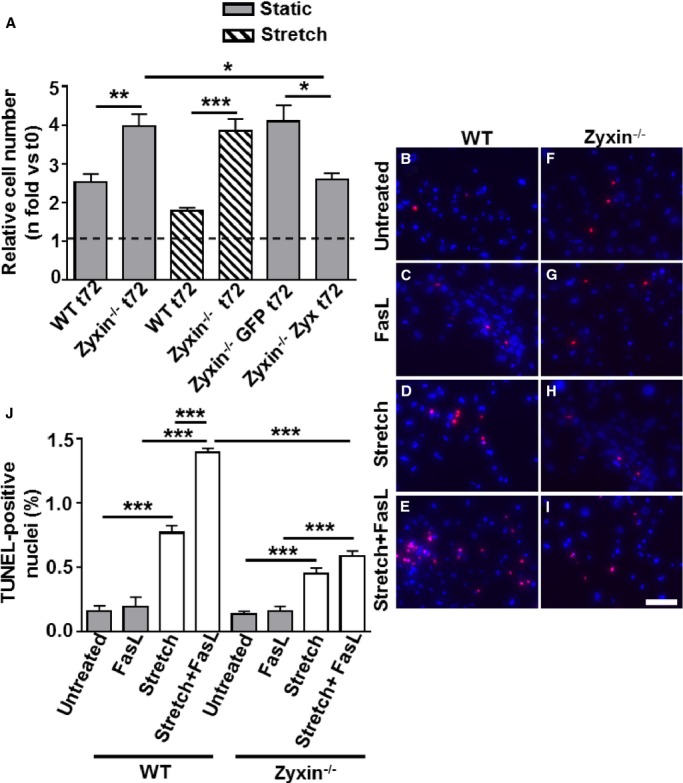
Zyxin−/− VSMCs proliferate faster than their WT counterparts and are less prone to stretch-stimulated, FasL-induced apoptosis. A, Statistical summary of proliferation of VSMCs, monitored by counting the number of cell nuclei stained with DAPI at 0 hour (t0) and after 72 hours (t72). For stretch-stimulated VSMCs, a 13% cyclic elongation was used. A plasmid encoding GFP was used as a transfection control (Zyxin−/− GFP) for the zyxin−/− VSMCs transfected with the zyxin expression construct (Zyxin−/−Zyx). *P<0.05, **P<0.01 and ***P<0.001 as indicated, n=5 for all groups except for Zyxin−/− GFP t72 and Zyxin−/−Zyx t72 where n=3. B through I, Detection of apoptotic nuclei by TUNEL staining (red). DAPI-stained nuclei are shown in blue. Scale bar represents 100 μm. Cells were stretched at 18% cyclic elongation for 18 hours in the absence or presence of FasL (400 ng/mL). J, Statistical summary of apoptotic TUNEL-positive nuclei. ***P<0.001 as indicated, n=3 for all groups. DAPI indicates 4′,6-diamidino-2-phenylindole; FasL, Fas ligand; GFP, green fluorescent protein; TUNEL, terminal deoxynucleotidyl transferase–mediated dUTP nick end labeling; VSMCs, vascular smooth muscle cells; WT, wild type.
Figure 4.
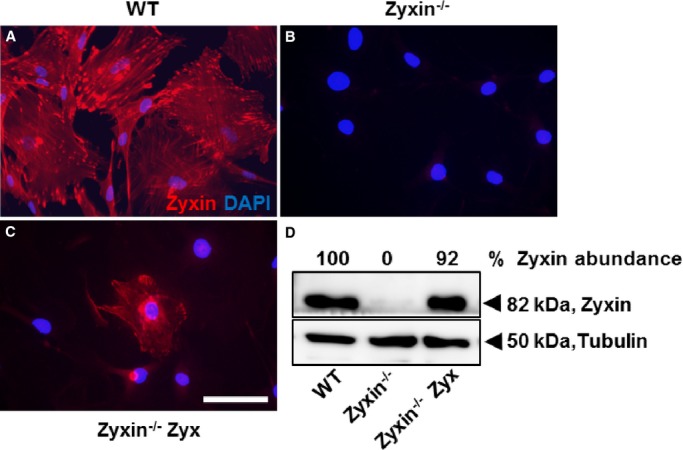
Transient re-expression of zyxin in zyxin−/− VSMCs. A, Confocal immunofluorescence image of VSMCs from wild-type (C57BL/6J) mice showing zyxin localization at focal adhesions (in red). DAPI-stained nuclei are in blue. B, Absence of zyxin immunofluorescence in zyxin-null VSMCs confirming the specificity of the antibody against zyxin. C, Exemplary image of a zyxin-deficient VSMC transfected with a plasmid expressing the coding sequence for zyxin (Zyxin−/− Zyx). Transgenic re-expression occurs at the focal adhesions, indicating a localization similar to that of the native protein. Scale bar represents 100 μm. D, Validation of zyxin re-expression by Western blot analysis. DAPI indicates 4′,6-diamidino-2-phenylindole; VSMCs, vascular smooth muscle cells; WT, wild type.
To test whether the increased expression of the Fas receptor (Figure 2D) had any effect on apoptosis, we exposed both WT and zyxin-null VSMCs to recombinant trimeric FasL in the presence of cyclic stretch. While FasL had no effect on VSMC apoptosis in the absence of stretch, stretched zyxin-deficient VSMCs showed significantly less apoptosis in response to FasL than their WT counterparts as determined by the number of TUNEL-positive nuclei (Figure 3B through 3J). We were unable to test the effect of zyxin re-expression in this context because the transfection process itself (electroporation) induces apoptosis and cell death, which precludes a correct interpretation of FasL-induced apoptosis. Migration often accompanies proliferation and critically regulates VSMC behavior. We therefore investigated whether the changes in gene expression and associated pathways outlined by the DNA microarray analysis also affected the rate of migration of the VSMCs.
Zyxin-Null Cells Display Enhanced Migration in Culture
To determine the role of zyxin in cell motility, we used the scratch-wound assay, which is a 2-dimensional model for cell migration. After 24 hours, the ability of cells to migrate to the midline of the scratch was found to be significantly higher in zyxin-null cells (Figure 5A through 5I). Quantitative analysis revealed a migration speed ≈1.7-fold higher in zyxin−/− VSMCs as compared to WT VSMCs. Re-expression of zyxin in zyxin−/− VSMCs restored migration speed to that observed for WT VSMCs, while GFP overexpression had no effect. VSMCs cultured in a 2-dimensional environment often behave in a manner different from that in a 3-dimensional matrix in which they are normally embedded in the vascular wall. We therefore examined their ability to invade a collagen gel as a measure of their migratory potential when seeded in the form of 3-dimensional spheroids. Spheroids composed of zyxin−/− VSMCs consistently showed a higher invasion of the collagen gel compared to WT VSMCs (Figure 6). Thus, zyxin appears to negatively regulate cell motility of VSMCs. To verify whether a transient loss of zyxin in VSMCs was sufficient to induce an increase in their migration and proliferation, we used a siRNA targeting zyxin in human arterial VSMCs. Transient silencing of zyxin expression led to a significant increase in migration and proliferation (Figure 7 and 8). Apart from a high rate of proliferation and migration, activated synthetic VSMCs frequently display a decrease in contractility. Therefore, we tested whether the zyxin-deficient VSMCs also have an altered contractility.
Figure 5.
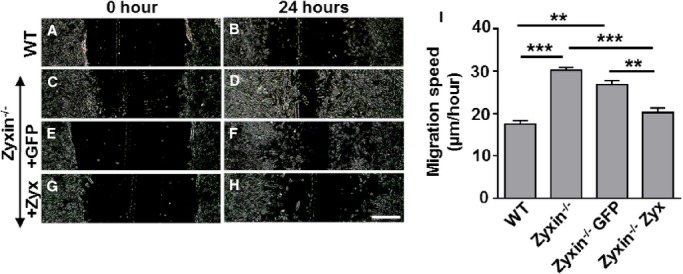
Zyxin−/− VSMCs are primed for migration in a 2D scratch assay. A through H, Representative images of the migration of WT and zyxin−/− VSMCs into a 2D scratch after 24 hours. Scale bar represents 500 μm. The sharpness and contrast of the images were adjusted to the same extent to clearly represent the migration front. I, Quantitative analysis of migration speed of the cells. The distance traveled by the cell front was divided by the time period to get the 2D migration speed. **P<0.01, ***P<0.001 as indicated. For all groups, n=5 except for Zyxin−/− GFP and Zyxin−/−Zyx where n=3. 2D indicates 2-dimensional; GFP, green fluorescent protein; VSMCs, vascular smooth muscle cells; WT, wild type.
Figure 6.
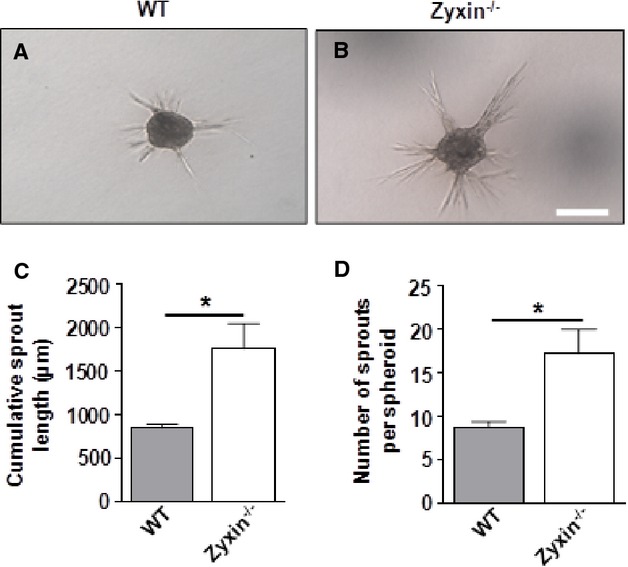
Zyxin-null VSMCs display enhanced invasion in a 3D collagen gel invasion assay. A and B, Representative images of sprout formation from 3D spheroids composed of WT and zyxin−/− VSMCs, respectively, after 24 hours. Scale bar represents 200 μm. C and D, Quantitative analysis of cumulative sprout length and number of sprouts, respectively, as a measure of migration and invasion of VSMCs into a collagen gel. *P<0.05 as indicated, n=3 for each group. 3D indicates 3-dimensional; VSMCs, vascular smooth muscle cells; WT, wild type.
Figure 7.
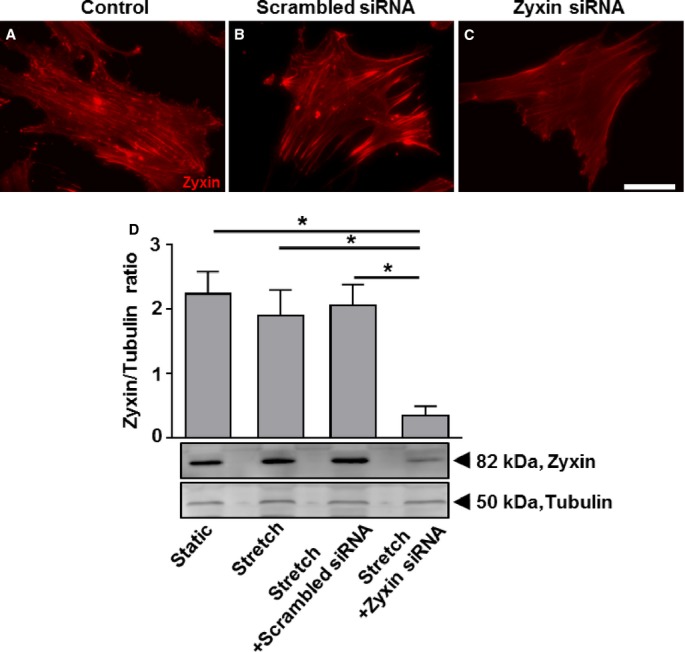
Zyxin silencing in human arterial vascular smooth muscle cells (VSMCs) by using short interfering RNA (siRNA). A through C, Representative immunofluorescence images showing knockdown of zyxin in human arterial VSMCs 72 hours post-transfection with a siRNA targeting zyxin. Scale bar represents 100 μm. Scrambled siRNA acts as a control for transfection of cells with a siRNA targeting zyxin. D, Western blot analysis of zyxin silencing (bottom) and its statistical summary (top), *P<0.05 as indicated, n=3 for each group.
Figure 8.
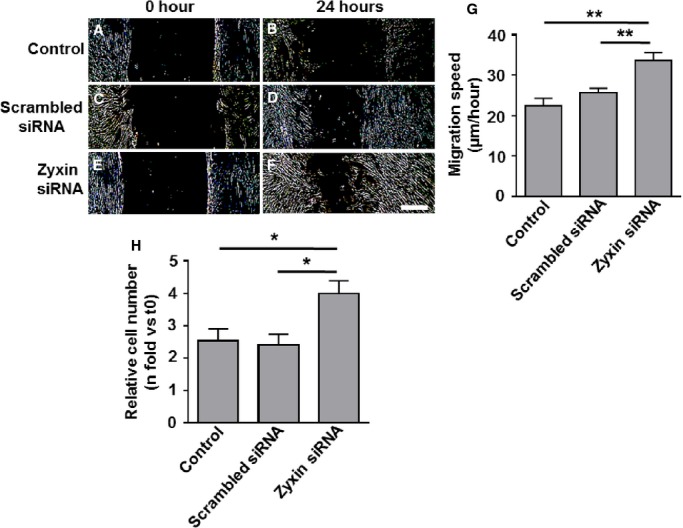
Transient silencing of zyxin by siRNA promotes migration and proliferation of human arterial VSMCs. A through F, Representative images of the migration of human arterial VSMCs into a 2-D scratch after 24 hours. Scale bar represents 500 μm. The sharpness and contrast of the images were adjusted to the same extent to clearly represent the migration front. G, Quantitative analysis of migration speed of the cells. The distance traveled by the cell front was divided by the time period to get the 2D migration speed. **P<0.01 as indicated, n=4. H, Statistical summary of proliferation of VSMCs, monitored by counting the number of cell nuclei stained with DAPI at 0 hour (t0) and after 72 hours (t72). *P<0.05, n=4 for all groups. 2D indicates 2-dimensional; siRNA short interfering RNA; VSMCs, vascular smooth muscle cells.
Basal and Agonist-Induced Contraction Is Compromised in Zyxin-Null VSMCs Lacking an Organized Actin Assembly
A collagen gel compaction assay is an indirect measure of the ability of cells to contract in vitro, thus leading to a reduction in gel diameter. Zyxin-deficient VSMCs seeded into a collagen gel produced a significantly lower compaction of the gel after 24 hours as compared to WT VSMCs (Figure 9A). To determine whether this lack of force generation could be further unmasked in the presence of a vasoconstrictor, we measured the gel diameter in the presence of endothelin 1, epinephrine, and norepinephrine, respectively. The apparent contractile deficit of the zyxin-deficient VSMCs was in fact further accentuated by these agonists (Figure 9A). As a direct method to analyze any contractile deficit of zyxin-null VSMCs, we pressurized femoral arteries from WT and zyxin−/− mice (5 to 12 weeks old) in situ while exposing them to increasing concentrations of vasoconstrictors such as endothelin 1 and epinephrine. Femoral arteries from zyxin−/− mice displayed a significantly reduced constriction compared to arteries isolated from WT mice (Figure 9B). To assess the origin of this contractile deficit, we examined stress fiber formation in zyxin-deficient VSMCs both in presence and absence of cyclic stretch.
Figure 9.
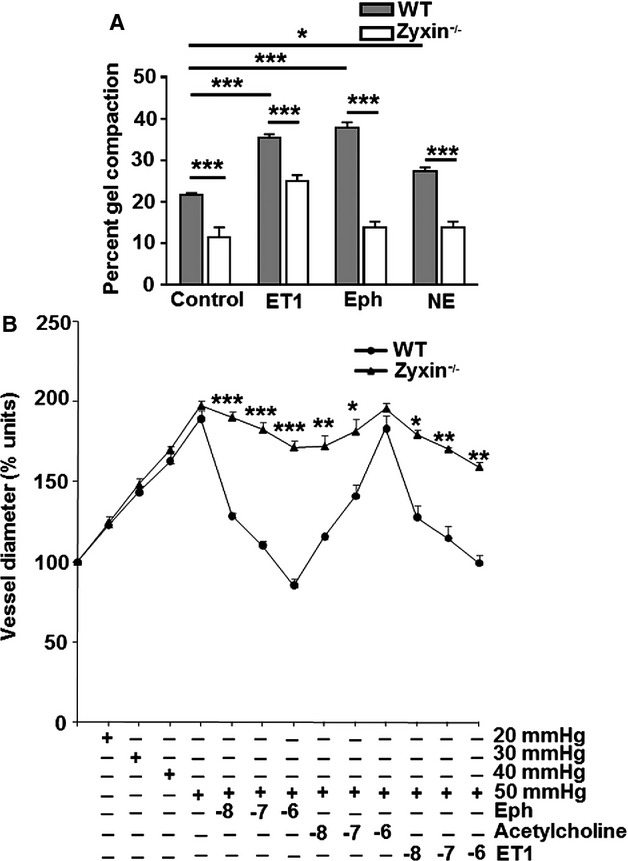
Loss of zyxin leads to a contractile deficit of VSMCs in vitro and isolated femoral arteries in situ. A, Analysis of the ability of WT and zyxin−/− VSMCs to pull a collagen gel, thereby reducing its diameter over a time period of 24 hours, an indirect measure of the contractility of the VSMCs. VSMCs seeded in the collagen gels were additionally stimulated with vasoconstrictor agonists such as ET1, Eph, and NE (100 nmol/L of each agonist). *P<0.05, ***P<0.001 as indicated, n=4 for each experimental group. B, Pressure-diameter measurements of isolated femoral arteries from WT and zyxin−/− mice in the absence and presence of increasing concentrations of vasoconstrictors, Eph and ET1; 10−8 to 10−6 mol/L. Acetylcholine was used as a control for vessel integrity indicated by vasodilatation. *P<0.05, **P<0.01, and ***P<0.001 as indicated, n=3 to 5. Mean values for vessel diameter from “n” individual experiments were compared between WT and zyxin−/− mice at each data point by unpaired t test. Eph indicates epinephrine; ET1, endothelin 1; NE, norepinephrine; VSMCs, vascular smooth muscle cells; WT, wild type.
Considering data in the literature8 on the role of zyxin inactin stress fiber assembly and repair, we measured the intensity of actin stress fiber labeling with Alexa fluor 488 tagged-phalloidin in WT and zyxin-deficient static and stretched VSMCs. Zyxin-null VSMCs showed higher levels of phalloidin-labeled F-actin already under static conditions compared to WT VSMCs (Figure 10A, 10C, and 10E). Cyclic stretch induced a robust increase in stress fiber–specific F-actin fluorescence in WT as well as in zyxin-deficient VSMCs. However, of note was the localized accumulation of F-actin lacking the regular, parallel orientation of stress fibers in WT VSMCs but being replaced by clusters of condensed F-actin (Figure 10B, 10D, and 10F). Thus, zyxin-null VSMCs lack an organized actin network for efficient contraction. These observations were reproduced in human arterial VSMCs following transient knockdown of zyxin using siRNA (Figure 7 and 1).
Figure 10.
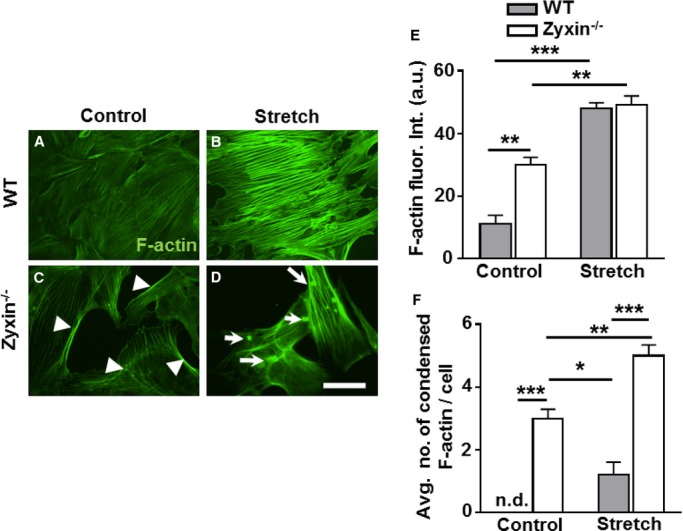
Zyxin−/− stretched VSMCs display a disarray of F-actin stress fibers. A through D, F-actin stress fibers in control and stretched VSMCs (15% cyclic elongation for 1 hour) were stained with Alexa fluor 488-labeled phalloidin (white). Scale bar represents 50 μm. E, Quantification of F-actin fluorescence intensity in control and stretched VSMCs with zyxin-deficient VSMCs having prominent F-actin staining along the edges of the cells (white arrowheads in Figure 10C). **P<0.01, ***P<0.001 as indicated, n=3 for each group. F, The average number of condensed F-actin deposits (white arrows, D) within the cells was quantified. *P<0.05, **P<0.01 and ***P<0.001 as indicated, n.d. indicates not detectable, n=3 for each group. VSMCs indicates vascular smooth muscle cells; WT, wild type.
Figure 11.
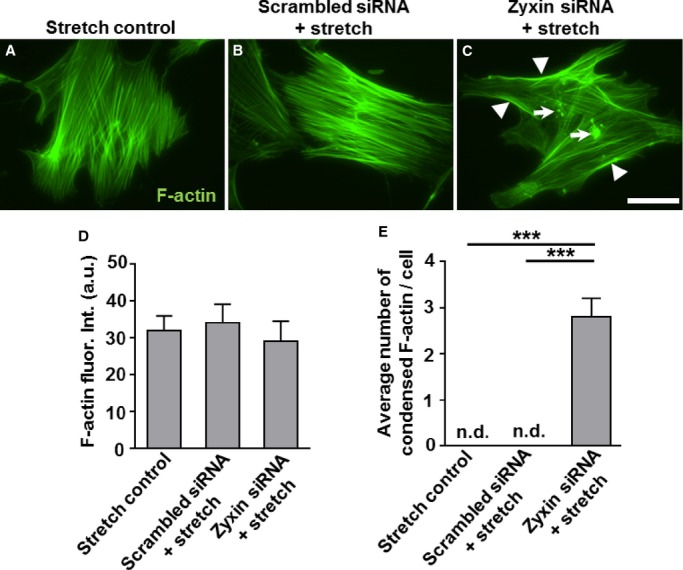
Zyxin silencing in human arterial vascular smooth muscle cells (VSMCs) leads to localized accumulation of F-actin. A through C, Representative immunofluorescence images of human arterial VSMCs showing F-actin-specific phalloidin staining. White arrowheads represent accumulation of F-actin-positive staining at the cell edges and white arrows represent condensed actin spots. Scale bar represents 50 μm. D, Statistical summary of total F-actin fluorescence intensity, which was not significantly different between groups. E, Quantification of condensed F-actin spots (shown by white arrows in C). ***P<0.001 as indicated, n=3 for each group. n.d. indicates not detectable; siRNA, short interfering RNA.
RhoA Is Constitutively Active in Zyxin-Null VSMCs Triggering Nuclear Accumulation of MRTF-A
Due to the accumulation of phalloidin-labeled F-actin fibers already in static zyxin-deficient VSMCs along with intense F-actin labeling of malformed stress fibers upon stretch, we examined these cells for activation of the GTPase RhoA, which is known to be involved in the build-up of such stress fibers. Following a 15% cyclic elongation of cells for 15 minutes and pulldown of active RhoA from total cell lysates, significantly higher levels of activated RhoA both in quiescent and stretched zyxin-deficient VSMCs were observed (Figure 2A and 2B). VSMCs lacking zyxin thus seem to be in a state where the GTPase is constantly active.
Figure 12.
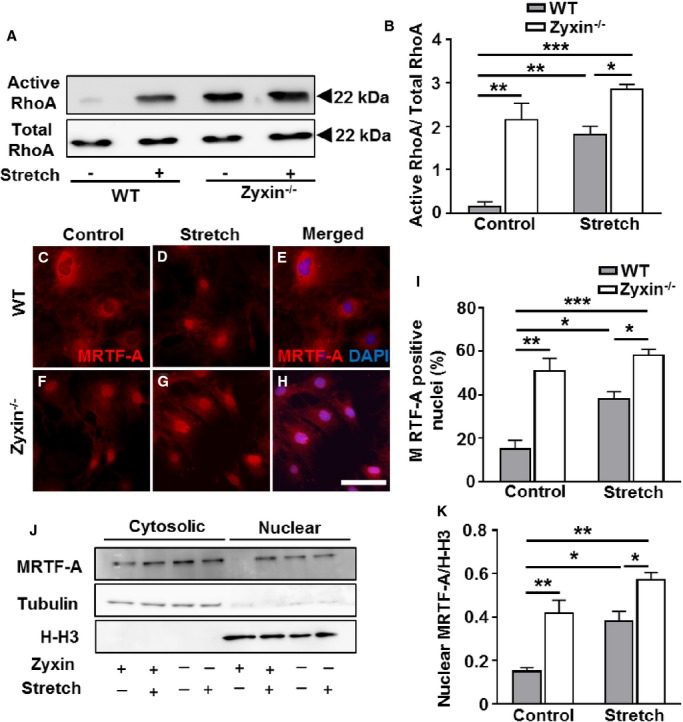
Zyxin−/− VSMCs have an active RhoA status, which induces stronger nuclear translocation of MRTF-A in zyxin−/− VSMCs. A, Western blot of active RhoA immunoprecipitated from total cell lysates by Rhotekin Rho binding domain (RBD) beads 15 minutes after exposure of the VSMCs to cyclic stretch (15% cyclic elongation, 0.5 Hz) or left unstretched. B, Quantification of active RhoA: total RhoA ratio as compared to WT VSMCs. Although stretch induced RhoA activation in both genotypes, RhoA activity was higher in zyxin−/− VSMCs; *P<0.05, **P<0.01, ***P<0.001 as indicated, n=3 for each experimental group. Total RhoA remained unchanged in WT and zyxin-deficient VSMCs. C, D, F, and G, Representative immunofluorescence images of MRTF-A (red) localization in WT and zyxin-deficient VSMCs. E and H, Representative merged images showing MRTF-A and DAPI colocalization in stretched VSMCs (H) but not in control unstretched VSMCs (E). DAPI-stained nuclei are shown in blue. Scale bar represents 100 μm. I, Statistical summary of stretch-induced nuclear translocation of MRTF-A in both types of VSMCs. *P<0.05, **P<0.01, ***P<0.001 as indicated, n=3 for each group. J and K, Western blot analysis (J, representative Western blot and K, statistical summary) of nuclear and cytosolic fractions from WT and zyxin-deficient VSMCs demonstrating the stronger nuclear localization of MRTF-A in zyxin-null VSMCs, *P<0.05, **P<0.01 as indicated, n=3 for each group. H-H3 and tubulin were used as markers for the nuclear and cytosolic fraction, respectively. DAPI indicates 4′,6-diamidino-2-phenylindole; H-H3, Histone H3; MRTF-A, myocardin-related transcription factor A; VSMCs, vascular smooth muscle cells; WT, wild type.
Signaling via RhoA is a key determinant of MRTF-A activity by regulating its cellular localization. Hence, we analyzed whether these cells have an altered subcellular localization of MRTF-A. Confocal immunofluorescence (Figure 2C through 2I) as well as Western blot analyses of nuclear and cytosolic fractions (Figure 2J and 2K) derived from quiescent (static control) and stretched VSMCs revealed a stronger nuclear localization of MRTF-A already in unstretched zyxin-deficient VSMCs, which was further accentuated upon short-term exposure to cyclic stretch. Likewise, in stretched human arterial VSMCs, there was stronger MRTF-A translocation to the nucleus upon siRNA-mediated knockdown of zyxin (Figure 3).
Figure 13.
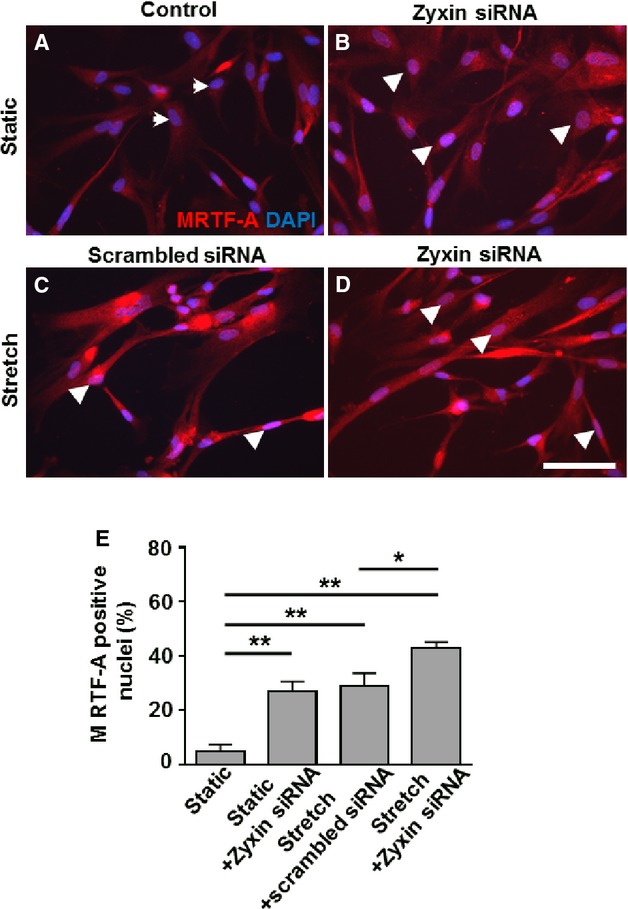
Stronger nuclear translocation of MRTF-A in human arterial VSMCs following zyxin silencing. A through D, Representative merged confocal immunofluorescence images of MRTF-A (red) localization in human arterial VSMCs costained with DAPI (blue). Scale bar represents 100 μm. White arrowheads indicate MRTF-A-positive nuclei, while white arrows represent nuclei negative for MRTF-A. Scrambled siRNA serves as a control for transfection of cells with siRNA targeting zyxin. E, Statistical summary of MRTF-A positive nuclei in human arterial VSMCs with or without zyxin silencing in the presence or absence of cyclic stretch. *P<0.05, **P<0.01 as indicated, n=3 for each group. DAPI indicates 4′,6-diamidino-2-phenylindole; MRTF-A, myocardin-related transcription factor A; siRNA, short interfering RNA; VSMCs, vascular smooth muscle cells.
MRTF-A Expression Partly Regulates Zyxin-Dependent Changes in Gene Expression
Based on the above results, we analyzed whether the zyxin-dependent changes in stretch-sensitive gene expression in VSMCs could be associated with the strong MRTF-A signaling in these cells. To this end, MRTF-A was silenced in zyxin-null VSMCs using siRNA (Figure 4) and stretch-induced changes in gene expression of the 5 candidate genes studied earlier (Figure 2D) were analyzed. Knockdown of MRTF-A in these cells reversed the changes in 3 out of the 5 genes found to be mechanosensitive and zyxin-dependent, namely, cyclin E2, ITGA8, and MMP13 but not Fas or RGS5 (Figure 5).
Figure 14.
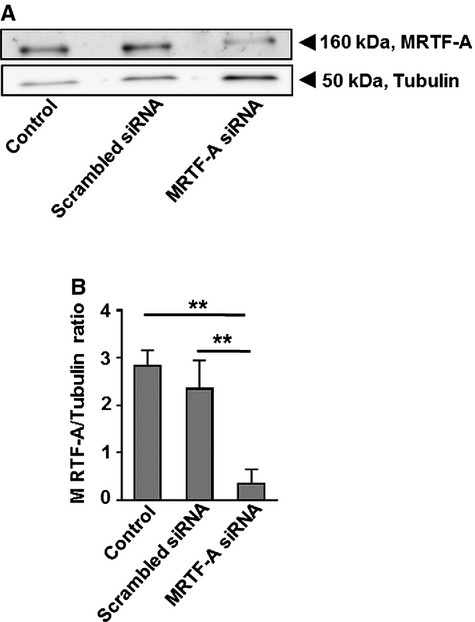
MRTF-A silencing by using siRNA specific for myocardin-related transcription factor A (MRTF-A). A, Western blot validation of MRTF-A silencing by siRNA. Scrambled siRNA acts as a control for transfection of cells with a siRNA targeting MRTF-A. Tubulin acts as a loading control. B, Statistical summary of MRTF-A silencing, **P<0.01 as indicated, n=3 for each group. siRNA indicates short interfering RNA.
Figure 15.
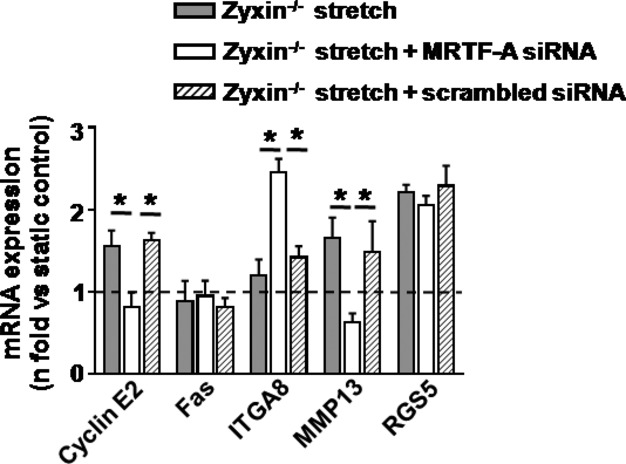
MRTF-A silencing partially rescues gene expression changes resulting from zyxin deficiency. Effect of MRTF-A silencing on stretch-sensitive zyxin-dependent gene expression analyzed by quantitative real-time RT-PCR, *P<0.05 as indicated, n=3 for each group. ITGA8 indicates integrin α8; MMP13, matrix metalloproteinase 13; MRTF-A, myocardin-related transcription factor A; RGS5, regulator of G-protein signaling 5; RT-PCR, reverse transcriptase polymerase chain reaction; siRNA, short interfering RNA.
RhoA-MRTF-A Axis Drives the Enhanced Migration and Proliferation of Zyxin−/− VSMCs
To test whether RhoA and MRTF-A were causally involved in the growth-promoting and promigratory phenotype of zyxin−/− VSMCs, we inhibited RhoA activation using a potent inhibitor of Rho proteins (denoted as ΔRho). On the other hand, MRTF-A was transiently silenced using siRNA. Inhibition of RhoA activation as well as silencing of MRTF-A significantly reduced the migration and proliferation of zyxin−/− VSMCs, recapitulating those of WT VSMCs (Figure 6 and 7).
Figure 16.
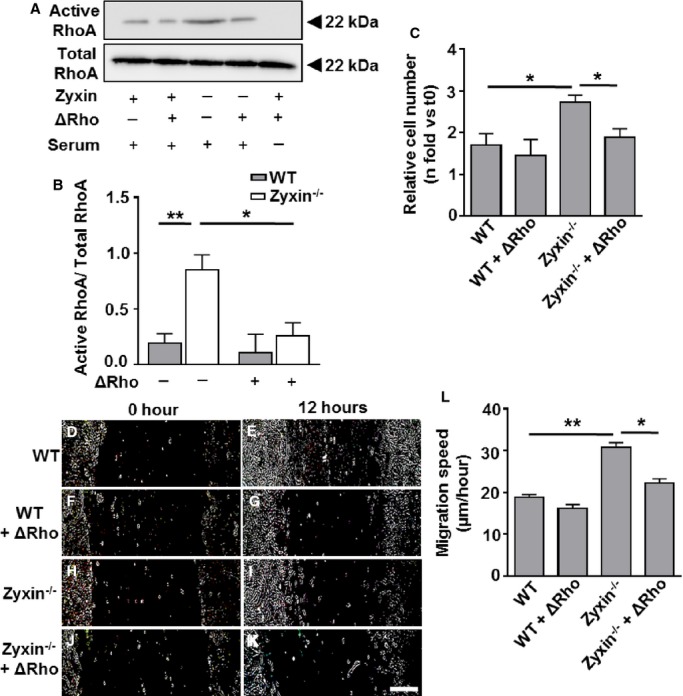
Inhibition of RhoA activity reduces the proliferation and migration of Zyxin−/− VSMCs. A, Western blot of active RhoA immunoprecipitated from total cell lysates by Rhotekin Rho binding domain (RBD) beads 12 hours after exposure of the VSMCs to a Rho inhibitor (denoted by ΔRho) or left untreated. Serum-starved WT VSMCs were used as a negative control for Rho activation. B, Quantification of active RhoA: total RhoA ratio as compared to WT VSMCs. *P<0.05, **P<0.01 as indicated, n=4 for each experimental group. Total RhoA remained unchanged in WT and zyxin-deficient VSMCs. C, Statistical summary of proliferation of VSMCs, monitored by counting the number of cell nuclei stained with DAPI at 0 hour (t0) and after 24 hours (t24). The Rho inhibitor was added at 0 hour and again after 12 hours along with fresh medium. *P<0.05 as indicated, n=4 for each group. D through K, Representative images of the migration of WT and zyxin−/− VSMCs into a 2-dimensional scratch after 12 hours following treatment with the Rho inhibitor. Scale bar represents 500 μm. The sharpness and contrast of the images were adjusted to the same extent to clearly represent the migration front. L, Quantitative analysis of migration speed of the cells. The distance traveled by the cell front was divided by the time period to get the 2-dimensional migration speed. *P<0.05, **P<0.01 as indicated, n=4 for each group. DAPI indicates 4′,6-diamidino-2-phenylindole; VSMCs, vascular smooth muscle cells; WT, wild type.
Figure 17.
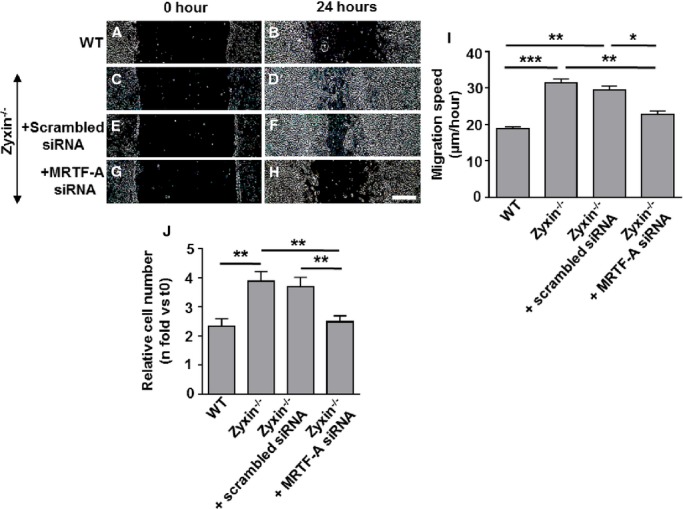
Transient silencing of MRTF-A by siRNA diminishes the migration and proliferation of zyxin−/− VSMCs. A through H, Representative images of the migration of WT and zyxin−/− VSMCs into a 2-D scratch after 24 hours. The scratch was made 72 hours post-transfection with siRNA targeting MRTF-A. Scale bar represents 500 μm. The sharpness and contrast of the images were adjusted to the same extent to clearly represent the migration front. I, Quantitative analysis of migration speed of the cells. The distance traveled by the cell front was divided by the time period to get the 2D migration speed. *P<0.05, **P<0.01 and ***P<0.001 as indicated, n=4 for all groups. J, Statistical summary of proliferation of VSMCs, monitored by counting the number of cell nuclei stained with DAPI at 0 hour (t0) and after 72 hours (t72). **P<0.01, n=4 for all groups. 2D indicates 2-dimensional; DAPI, 4′,6-diamidino-2-phenylindole; MRTF-A, myocardin-related transcription factor A; siRNA, short interfering RNA; VSMCs, vascular smooth muscle cells; WT, wild type.
Zyxin-Dependent Stretch-Sensitive Genes Display Putative SRF Binding Sites
In endothelial cells, zyxin regulates stretch-sensitive gene expression by binding to a sequence of pyrimidines (PyPu box) in the proximal promoter region of such genes.4 We therefore examined the 5 zyxin-dependent candidate genes reported before for putative PyPu binding sites using an in silico analysis. We could not identify any reproducible PyPu element in the promoter regions of these genes (Table7). Since 3 of these 5 candidate genes were also MRTF-A dependent, we next looked for SRF binding sites in the promoter sequences of these genes. Interestingly, all 3 genes, namely, cyclin E2, ITGA8, and MMP13, were found to contain putative SRF binding sites (Table8).
Table 7.
In Silico Promoter Analysis of the 5 Zyxin-Dependent Candidate Genes for Putative PyPu Binding Sites
| Gene | Matrix | Start | End | C.S | M.S | Sequence |
|---|---|---|---|---|---|---|
| CyclinE2 | V$HSF1.04 | −663 | −687 | 1 | 0.851 | caaagcttctctgggagcTTCTctg |
| ITGA8 | V$HSF1.04 | −3817 | −3841 | 1 | 0.791 | gttgaagcctcaggatccTTCTctc |
| V$HSF1.04 | −3522 | −3546 | 1 | 0.761 | accccttatgaaggaaacTTCTctc | |
| MMP13 | V$HSF1.04 | −3761 | −3785 | 0.85 | 0.838 | tttacatattcttaaaatTTCAatc |
| RGS5 | V$HSF1.04 | −3577 | −3601 | 0.973 | 0.805 | tagagataatctccaaagTTCCatg |
| V$HSF1.04 | −2489 | −2513 | 1 | 0.779 | tggggtccttcttgttggTTCTatg | |
| V$HSF1.04 | −1621 | −1645 | 1 | 0.775 | tgcaggctgtcctcaaacTTCTgtt | |
| V$HSF1.04 | −236 | −260 | 1 | 0.789 | gggcatgtttctggtggcTTCTgtc |
In silico promoter analysis of the 5 zyxin-dependent candidate genes for putative PyPu binding sites. Putative binding sites which remotely resemble the PyPu box are tabulated. The HSF has some similarity to the PyPu sequence but a prominent and reproducible stretch of pyrimidines was not detectable compared to that observed in ECs.4 A maximum C.S is obtained when there is a strong match between highly conserved bases of the matrix and the input sequence. A good match to the matrix or the M.S has a value >0.80. Promoter sequences ≈4000 bp upstream of the transcription start site were analyzed for this purpose. C.S indicates core similarity; ECs, endothelial cells; HSF, heat shock factor; ITGA8, integrin α8; M.S, matrix similarity; MMP13, matrix metalloproteinase 13; RGS5, regulator of G-protein signaling 5.
Table 8.
In Silico Promoter Analysis of the 3 MRTF-A-Regulated Zyxin-Dependent Candidate Genes for Putative SRF Binding Sites
| Gene | Matrix | Start | End | C.S | M.S | Sequence |
|---|---|---|---|---|---|---|
| CyclinE2 | V$SRF.04 | −2464 | −2482 | 1 | 0.865 | ctaacccgtTATGgcaaga |
| ITGA8 | V$SRF.03 | −2524 | −2542 | 1 | 0.805 | cttcacctatATGGactgc |
| V$SRF.05 | −1053 | −1071 | 1 | 0.816 | ctagcctgagAAGGctgtg | |
| V$SRF.02 | −381 | −399 | 1 | 0.868 | tgttcCATAtgcggcgaga | |
| V$SRF.04 | −380 | −398 | 1 | 0.925 | ctcgccgcaTATGgaacac | |
| MMP13 | V$SRF.04 | −2915 | −2933 | 0.901 | 0.87 | tggaccacaTAAGacccaa |
| V$SRF.02 | −1737 | −1755 | 1 | 0.851 | gggctCATAtcagggccca | |
| V$SRF.04 | −1736 | −1754 | 1 | 0.872 | gggccctgaTATGagccct | |
| V$SRF.05 | −1423 | −1441 | 1 | 0.838 | ttgacctcaaAAGGgggag |
In silico promoter analysis of the 3 MRTF-A-regulated zyxin-dependent candidate genes for putative SRF binding sites. Putative SRF binding sites are tabulated. A maximum C.S is obtained when there is a strong match between highly conserved bases of the matrix and the input sequence. A good match to the matrix or the M.S has a value >0.80. Promoter sequences ≈4000 bp upstream of the transcription start site were analyzed for this purpose. C.S indicates core similarity; ITGA8, integrin α8; M.S, matrix similarity; MMP13, matrix metalloproteinase 13; MRTF-A, myocardin-related transcription factor A; SRF, serum response factor.
Loss of Zyxin Seems Dispensable in Adult Mice in a Model of Experimental Hypertension
Due to the prominent zyxin-dependency of stretch-sensitive genes in VSMCs observed in vitro, we examined the effects of experimentally induced hypertension in adult mice (24 weeks old) lacking zyxin using a deoxycorticosterone acetate (DOCA)-salt model. After 21 days of treatment with deoxycorticosterone acetate (DOCA)-salt, systolic and diastolic blood pressure values were similarly elevated in both WT and zyxin−/− mice (Figure 8A). Proliferation of VSMCs as measured by the number of PCNA-positive nuclei was not significantly different between the 2 genotypes (Figure 8B through 8D). The expression of calponin, a component of the cytoskeleton and contractile apparatus of VSMCs, which is sensitive to experimental hypertension, was also identical in arterial wall from both WT and zyxin−/− mice (Figure 8E through 8G). Thus, loss of zyxin seems to be dispensable in mice at this age.
Figure 18.
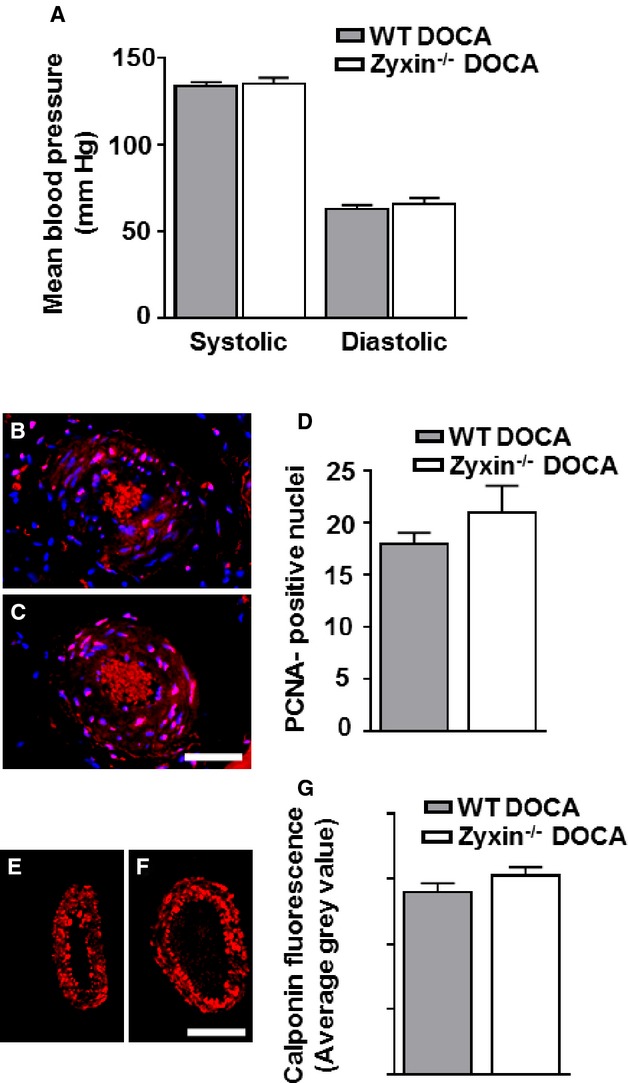
Loss of zyxin seems dispensable in mice with experimentally induced hypertension. A, Systolic and diastolic blood pressure in 6-month-old WT and zyxin-null mice 21 days after induction of hypertension. Measurements were made by a tail-cuff method, n=6 for each group. B and C, Representative confocal immunofluorescence images of femoral artery sections from mice. Scale bar represents 50 μm. Overlay of PCNA (red) and nuclear staining with DAPI (blue) is shown in pink. D, Quantitative summary of PCNA-positive nuclei indicating the number of proliferating smooth muscle cells in the arterial wall. No significant differences were observed between the 2 groups, n=6 for each group. E and F, Representative confocal immunofluorescence images of femoral artery sections from DOCA-salt-treated WT and zyxin-null mice showing the expression of calponin (red). Scale bar represents 50 μm. G, Statistical summary of calponin intensity in femoral artery sections from DOCA-treated mice. Values were not significantly different between the 2 groups, n=6 for each group. DAPI indicates 4′,6-diamidino-2-phenylindole; DOCA, deoxycorticosterone acetate; PCNA, proliferating cell nuclear antigen; WT, wild type.
Isolated Femoral Arteries From Old Zyxin-Null Mice Are Less Responsive to Changes in Perfusion Pressure
Isolated femoral arteries from adult (24 weeks) and very old (72 weeks) WT or zyxin-null mice were perfused at gradually increasing levels of pressure. No significant differences in response to elevated levels of perfusion pressure—so-called myogenic response—were observed in arteries from adult WT and zyxin-null mice (Figure 9A). Arteries from very old zyxin−/− mice, however, failed to show significant changes in diameter at higher values of perfusion pressure (Figure 9B). Since the zyxin−/− VSMCs showed an activated phenotype in vitro that was not replicated in adult zyxin-null mice both under in vivo and in situ conditions, we hypothesized that redundant members of the zyxin family might be responsible for masking the cardiovascular phenotype in mice until they are much older (ie, 18 months as compared to 6 months).
Figure 19.
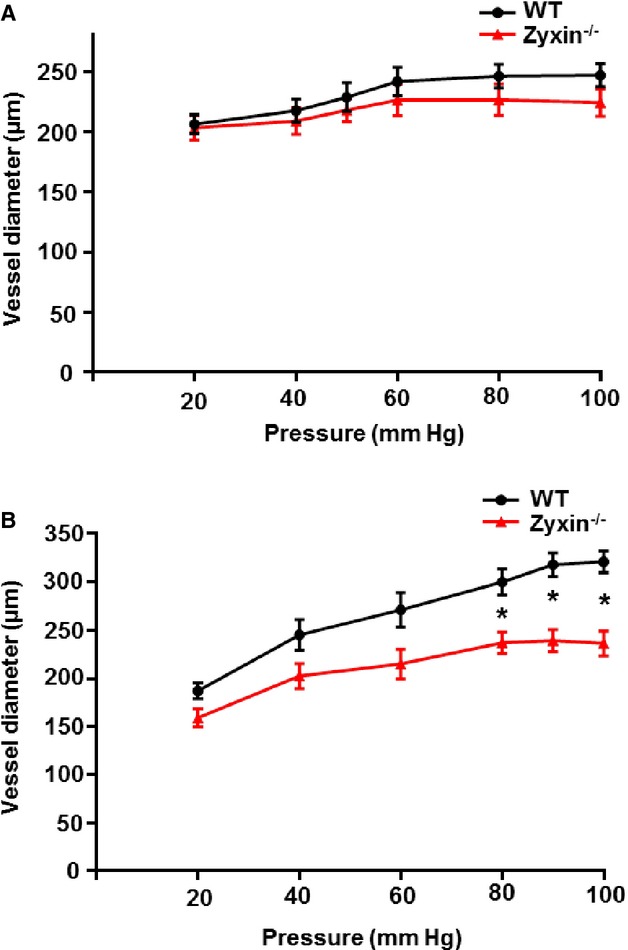
Femoral arteries from old zyxin-null mice are less sensitive to changes in vessel diameter with increasing levels of perfusion pressure. A, Pressure-diameter readings in femoral arteries from 24-week-old wild-type (WT) and zyxin-null mice. Values were not significantly different between the 2 groups, n=5 for each group. B, Changes in vessel diameter in femoral arteries from 72-week-old WT and zyxin-null mice exposed to gradually increasing levels of perfusion pressure. *P<0.05, n=5 for femoral arteries from WT mice and n=3 for femoral arteries from zyxin-null mice. Differences in mean vessel diameter between the 2 groups at each data point were analyzed by an unpaired t test.
The LIM Domain Protein LPP Likely Compensates for Loss of Zyxin in VSMCs
Owing to the lack of a cardiovascular phenotype in zyxin−/− mice at baseline conditions, we tested the possibility of the closely related member of the zyxin family, namely LPP, as a likely source of functional compensation. LPP was found to be expressed in VSMCs and colocalized with zyxin at focal adhesions (Figure 10). As a proof of principle, we transiently overexpressed LPP protein in zyxin−/− VSMCs and measured their migration and proliferation. Overexpression of LPP was confirmed by both immunofluorescence and Western blot analysis (Figure 1). A 1.8-fold increase in LPP expression was sufficient to reduce both proliferation and migration of zyxin−/− VSMCs to the level of WT VSMCs (Figure 2).
Figure 20.
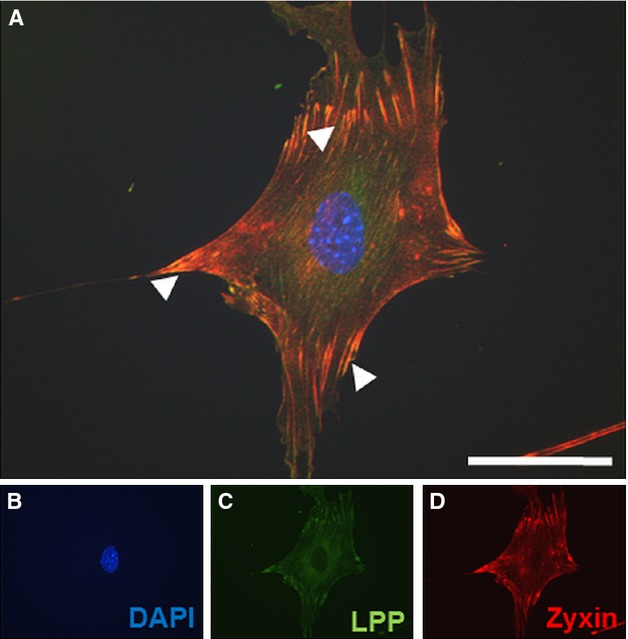
LPP protein colocalizes with zyxin at focal adhesions in VSMCs. A, Representative merged confocal immunofluorescence image of an aortic VSMC from wild-type mice showing a punctate distribution of zyxin and LPP at focal contact points to the substrate (indicated by white arrowheads). Colocalization is indicated in yellow. B through D, Individual confocal immunofluorescence images of VSMC nucleus, LPP and zyxin expression, respectively, shown in blue, green, and red. Scale bar indicates 50 μm. DAPI indicates 4′,6-diamidino-2-phenylindole; LPP, lipoma preferred partner; VSMCs, vascular smooth muscle cells.
Figure 21.
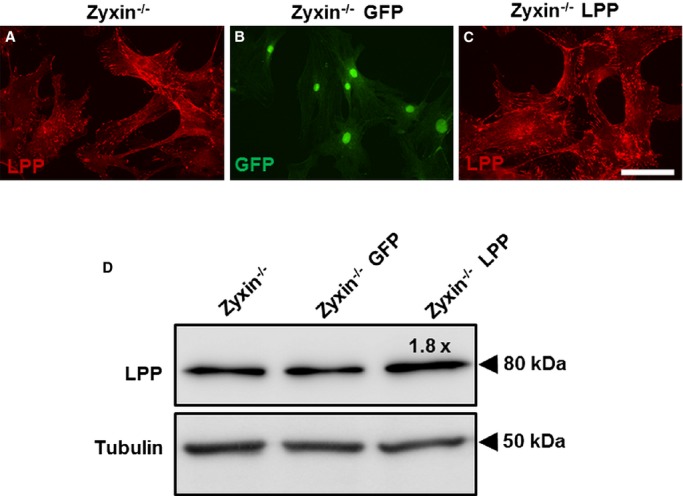
Transient overexpression of LPP in zyxin−/− VSMCs. A, Confocal immunofluorescence image of VSMCs from zyxin−/− mice showing LPP localization at focal adhesions (in red). B, Zyxin−/− VSMCs transfected with GFP as a transfection control. C, Exemplary image of zyxin-deficient VSMCs transfected with a plasmid expressing the coding sequence for LPP (Zyxin−/− LPP). Scale bar represents 100 μm. D, Validation of LPP over-expression by Western blot analysis showing a 1.8-fold increase in LPP expression, n=4 for each group. GFP indicates green fluorescent protein; LPP, lipoma preferred partner; VSMCs, vascular smooth muscle cells.
Figure 22.
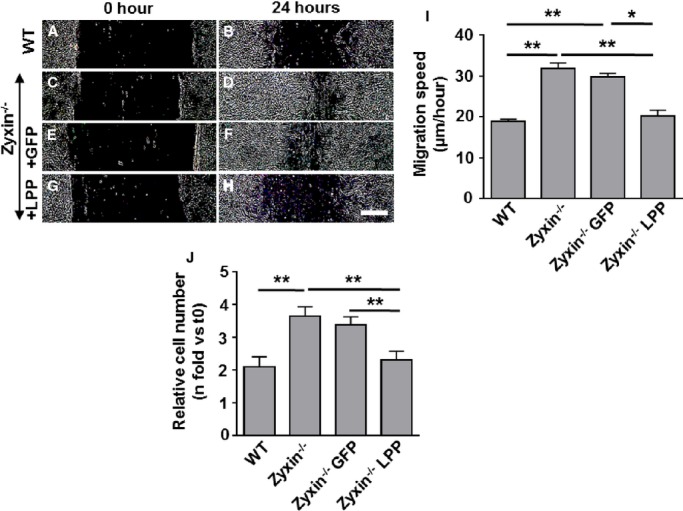
Overexpression of LPP in zyxin−/− VSMCs recapitulates the migration and proliferation behavior of WT VSMCs. A through H, Representative images of the migration of WT and zyxin−/− VSMCs into a 2D scratch after 24 hours. Scale bar represents 500 μm. The sharpness and contrast of the images were adjusted to the same extent to clearly represent the migration front. I, Quantitative analysis of migration speed of the cells. The distance traveled by the cell front was divided by the time period to get the 2D migration speed. *P<0.05, **P<0.01 as indicated. For all groups, n=4. J, Statistical summary of proliferation of VSMCs, monitored by counting the number of cell nuclei stained with DAPI at 0 hour (t0) and after 72 hours (t72). A plasmid encoding GFP was used as a transfection control (Zyxin−/− GFP) for the zyxin−/− VSMCs transfected with the LPP expression construct (Zyxin−/− LPP). **P<0.01 as indicated, n=4 for all groups. 2D indicates 2-dimensional; DAPI, 4′,6-diamidino-2-phenylindole; GFP, green fluorescent protein; LPP, lipoma preferred partner; VSMCs, vascular smooth muscle cells; WT, wild type.
Discussion
Among the focal adhesion proteins, zyxin has been studied in some detail, and several lines of evidence suggest that it may function as a mechanosensor.4,5,20 With substantial evidence of the importance of zyxin in endothelial cells,4,20 we aimed at defining its role in VSMCs. This study reports a different subset of stretch-induced genes regulated by zyxin in VSMCs compared to that observed for endothelial cells. We used an in vitro approach with primary VSMCs from these animals to study the consequences of a permanent loss of zyxin at the cellular level. We assume that 1 reason for the apparent lack of a (cardio)vascular phenotype in zyxin-deficient mice (up to 18 months old; data not shown) under baseline conditions is functional redundancy of the closely related zyxin family members LPP and thyroid hormone receptor interactor 6. Interestingly, LPP-deficient mice also do not have a distinct phenotype,25 despite the presence of a more severe phenotype in flies and zebrafish lacking zyxin and LPP, respectively.26,27
Using pathway analysis tools, zyxin-dependent genes could be attributed to important pathways mediating VSMC behavior. These pathways (Tables2 through 6) indicate that in VSMCs, zyxin is pro-apoptotic and inhibits proliferation and migration, which was replicated in our in vitro experiments. Previously, conflicting roles of zyxin in apoptosis have been reported with zyxin promoting apoptosis28 or inhibiting it.29 This may be due to the cell type–specific function of zyxin and/or the type and relative potency of the stimulus used to induce apoptosis.
The reduced collagen gel compaction of zyxin-null VSMCs might be indicative for generating insufficient force to pull on the collagen fibers. The poor response to vasoconstrictors could be due to higher expression of RGS5 (Figure 2D), which is known to limit G-protein coupled receptor–mediated contraction of VSMCs. Although we found stronger F-actin staining in zyxin-deficient VSMCs, this was mainly localized along the cell boundary or in condensed actin-rich regions, and thus may explain the lack of tension exerted by these cells on the collagen matrix. Zyxin-null fibroblasts are known to have a defect in building robust stress fibers.30,31 Zyxin-deficient VSMCs seem to differ in some aspects. While there is a defect in building robust stress fibers, F-actin staining is more intense but concentrated along the cell boundary or spotlike within the cytoplasm. Thus, zyxin-null VSMCs try to accumulate actin in response to stretch but fail to build robust stress fibers, so that actin aggregates form as reported previously.31 Another difference between this study and the previous report30 might be due to the use of mouse embryonic fibroblasts as compared to aortic VSMCs from adult mice in which dynamic stress fibers might have had more time to adapt to the lack of zyxin. Finally, the composition of stress fibers could also differ between VSMCs and fibroblasts since this is known to depend on factors such as the inherent motility of cells.32
Since RhoA is associated with cell contractility,33 the increased RhoA activity in poorly contractile zyxin-null VSMCs seems counterintuitive. However, without strings of parallel stress fibers, the increased RhoA activity in the zyxin-deficient VSMCs could not generate sufficient tension. Interestingly, despite their enhanced RhoA activity, zyxin-null VSMCs displayed an increased migratory capacity as compared to WT VSMCs. This, however, is not unprecedented. There is evidence that RhoA regulates membrane protrusion with high RhoA activity localized to cell protrusions and retracting tails of randomly migrating cells.34 Moreover, there are reports of RhoA supporting migration of VSMCs35 and thereby their involvement in vascular remodeling processes such as neointima formation and arteriogenesis.36 Indeed, we observed an impaired migration and proliferation of zyxin−/− VSMCs upon inhibition of RhoA activation.
Rho GTPases can regulate the activity of MRTF-A and B, which are co-activators of the transcription factor SRF. Accordingly, the strong enrichment of MRTF-A in the nucleus of zyxin-null VSMCs paralleled the increased RhoA activity. Although there is substantial evidence for MRTF-A supporting the differentiated (contractile) state of VSMCs through promoting expression of specific SRF target genes, recent evidence suggests that a high level of MRTF-A activity may actually drive VSMC migration and proliferation under pathophysiological conditions where myocardin is downregulated.15 Expression of myocardin is decreased in most vascular remodeling processes and also in dedifferentiated VSMCs in culture. Likewise, in stretch-stimulated VSMCs, myocardin is exported out of the nucleus16 while MRTF-A translocates to the nucleus. Thus, the increase in nuclear MRTF-A seems to switch the SRF-dependent gene program from phenotype stabilization toward migration and proliferation. Accordingly, transient silencing of MRTF-A in zyxin−/− VSMCs significantly reduced their migration and proliferation. In dedifferentiated VSMCs, modulation of SRF activity by MRTF-A via Rho signaling in fact has a significant impact on proliferation and migration.15,21 In certain cancer cell lines,21 constitutive MRTF-A activity is critical for their motility and invasiveness. In this context, decreased levels of zyxin have been associated with several forms of cancers.9,37 It is thus likely that the absence of zyxin in VSMCs triggers a promigratory and activated phenotype by a corresponding shift toward the RhoA-MRTF-A axis, which drives basal SRF activity. We could rescue part of zyxin-dependent gene expression in zyxin-deficient VSMCs by knockdown of MRTF-A (Figure 5). Thus, zyxin does seem to partly regulate gene expression through the MRTF-A-SRF pathway. We have previously reported the binding of zyxin to a sequence of pyrimidines (PyPu box) in the promoter regions of stretch-sensitive zyxin-dependent genes in endothelial cells.4 However, in silico analysis of putative PyPu binding sites in the promoter regions of candidate mechanosensitive genes in VSMCs did not reveal such a consensus sequence (Table7). This together with the much higher threshold of stretch-dependent activation of zyxin in VSMCs20 indicates that the zyxin-dependent gene expression likely follows a different mechanism in VSMCs compared to endothelial cells. Interestingly, in agreement with the partial regulation of zyxin-dependent gene expression by MRTF-A, several putative SRF binding sites were observed in the promoter regions of zyxin-dependent mechanosensitive candidate genes (Table8). Therefore, the RhoA-MRTF-A axis seems to be at least 1 of the mechanisms regulating zyxin-dependent gene expression in VSMCs.
Despite the presence of a pronounced in vitro phenotype in zyxin-null VSMCs, adult mice lacking zyxin did not display changes in blood pressure or arterial remodeling in comparison to WT mice when challenged with experimental hypertension. Accordingly, isolated femoral arteries from adult zyxin-null mice were identical to those from WT mice in their (myogenic) response to increasing levels of perfusion pressure in situ. Interestingly, in very old zyxin-null mice, there was a stark deficit in this so-called myogenic response, suggesting that in the arterial vessel wall of these mice either the contractile capacity of the VSMCs was downregulated or their communication with the extracellular matrix was disturbed.
The important role of zyxin in regulating the VSMC phenotype at the cellular level might have been masked in animal studies. Our preliminary studies in very old hypertensive (deoxycorticosterone acetate or DOCA-salt-treated) zyxin−/− mice in fact point to an in vivo phenotype (data not shown) closely resembling our observations with cultured zyxin−/− VSMCs. Further extensive in vivo studies with zyxin-deficient mice that are challenged with pathophysiological stress and knockdown of multiple zyxin family members in mice should further elucidate the varied vascular functions of this mechanotransducer protein.
Acknowledgments
This work is dedicated to Dr Marco Cattaruzza, a respected colleague involved in the planning of this project who recently passed away. We are thankful to Laura Hoffman and Mary Beckerle for providing us with the zyxin-specific antibodies and zyxin-deficient mice, and Renate Cattaruzza for expert technical assistance.
Sources of Funding
Dr Markus Hecker was supported by funding from the European Commission (Marie Curie Initial Training Networks SmArt and SmArteR) and intramural funds.
Disclosures
None.
References
- Schwartz SM, Geary RL, Adams LD. Vascular failure: a hypothesis. Curr Atheroscler Rep. 2003;5:201–207. doi: 10.1007/s11883-003-0025-y. [DOI] [PubMed] [Google Scholar]
- Demicheva E, Hecker M, Korff T. Stretch-induced activation of the transcription factor activator protein-1 controls monocyte chemoattractant protein-1 expression during arteriogenesis. Circ Res. 2008;103:477–484. doi: 10.1161/CIRCRESAHA.108.177782. [DOI] [PubMed] [Google Scholar]
- Wang Z, Wang D-Z, Hockemeyer D, McAnally J, Nordheim A, Olson EN. Myocardin and ternary complex factors compete for SRF to control smooth muscle gene expression. Nature. 2004;428:185–189. doi: 10.1038/nature02382. [DOI] [PubMed] [Google Scholar]
- Wójtowicz A, Babu SS, Li L, Gretz N, Hecker M, Cattaruzza M. Zyxin mediation of stretch-induced gene expression in human endothelial cells. Circ Res. 2010;107:898–902. doi: 10.1161/CIRCRESAHA.110.227850. [DOI] [PubMed] [Google Scholar]
- Cattaruzza M, Lattrich C, Hecker M. Focal adhesion protein zyxin is a mechanosensitive modulator of gene expression in vascular smooth muscle cells. Hypertension. 2004;43:726–730. doi: 10.1161/01.HYP.0000119189.82659.52. [DOI] [PubMed] [Google Scholar]
- Sun Z, Huang S, Li Z, Meininger GA. Zyxin is involved in regulation of mechanotransduction in arteriole smooth muscle cells. Front Physiol. 2012;3:472. doi: 10.3389/fphys.2012.00472. [DOI] [PMC free article] [PubMed] [Google Scholar]
- Crawford AW, Michelsen JW, Beckerle MC. An interaction between zyxin and alpha-actinin. J Cell Biol. 1992;116:1381–1393. doi: 10.1083/jcb.116.6.1381. [DOI] [PMC free article] [PubMed] [Google Scholar]
- Hoffman LM, Jensen CC, Kloeker S, Wang C-LA, Yoshigi M, Beckerle MC. Genetic ablation of zyxin causes Mena/VASP mislocalization, increased motility, and deficits in actin remodeling. J Cell Biol. 2006;172:771–782. doi: 10.1083/jcb.200512115. [DOI] [PMC free article] [PubMed] [Google Scholar]
- Mise N, Savai R, Yu H, Schwarz J, Kaminski N, Eickelberg O. Zyxin is a transforming growth factor-β (TGF-β)/Smad3 target gene that regulates lung cancer cell motility via integrin α5β1. J Biol Chem. 2012;287:31393–31405. doi: 10.1074/jbc.M112.357624. [DOI] [PMC free article] [PubMed] [Google Scholar]
- Haudenschild CC, Grunwald J, Chobanian AV. Effects of hypertension on migration and proliferation of smooth muscle in culture. Hypertension. 1985;7:I101–I104. doi: 10.1161/01.hyp.7.3_pt_2.i101. [DOI] [PubMed] [Google Scholar]
- Mahoney WM, Schwartz SM. Defining smooth muscle cells and smooth muscle injury. J Clin Invest. 2005;115:221–224. doi: 10.1172/JCI24272. [DOI] [PMC free article] [PubMed] [Google Scholar]
- Parmacek MS. Myocardin-related transcription factors: critical coactivators regulating cardiovascular development and adaptation. Circ Res. 2007;100:633–644. doi: 10.1161/01.RES.0000259563.61091.e8. [DOI] [PubMed] [Google Scholar]
- Long X, Bell RD, Gerthoffer WT, Zlokovic BV, Miano JM. Myocardin is sufficient for a smooth muscle-like contractile phenotype. Arterioscler Thromb Vasc Biol. 2008;28:1505–1510. doi: 10.1161/ATVBAHA.108.166066. [DOI] [PMC free article] [PubMed] [Google Scholar]
- Wang Z, Wang D-Z, Pipes GCT, Olson EN. Myocardin is a master regulator of smooth muscle gene expression. Proc Natl Acad Sci USA. 2003;100:7129–7134. doi: 10.1073/pnas.1232341100. [DOI] [PMC free article] [PubMed] [Google Scholar]
- Minami T, Kuwahara K, Nakagawa Y, Takaoka M, Kinoshita H, Nakao K, Kuwabara Y, Yamada Y, Yamada C, Shibata J, Usami S, Yasuno S, Nishikimi T, Ueshima K, Sata M, Nakano H, Seno T, Kawahito Y, Sobue K, Kimura A, Nagai R, Nakao K. Reciprocal expression of MRTF-A and myocardin is crucial for pathological vascular remodelling in mice. EMBO J. 2012;31:4428–4440. doi: 10.1038/emboj.2012.296. [DOI] [PMC free article] [PubMed] [Google Scholar]
- Pfisterer L, Feldner A, Hecker M, Korff T. Hypertension impairs myocardin function: a novel mechanism facilitating arterial remodelling. Cardiovasc Res. 2012;96:120–129. doi: 10.1093/cvr/cvs247. [DOI] [PubMed] [Google Scholar]
- Olson EN, Nordheim A. Linking actin dynamics and gene transcription to drive cellular motile functions. Nat Rev Mol Cell Biol. 2010;11:353–365. doi: 10.1038/nrm2890. [DOI] [PMC free article] [PubMed] [Google Scholar]
- Kimura K, Ito M, Amano M, Chihara K, Fukata Y, Nakafuku M, Yamamori B, Feng J, Nakano T, Okawa K, Iwamatsu A, Kaibuchi K. Regulation of myosin phosphatase by Rho and Rho-associated kinase (Rho-kinase) Science. 1996;273:245–248. doi: 10.1126/science.273.5272.245. [DOI] [PubMed] [Google Scholar]
- Schratt G, Philippar U, Berger J, Schwarz H, Heidenreich O, Nordheim A. Serum response factor is crucial for actin cytoskeletal organization and focal adhesion assembly in embryonic stem cells. J Cell Biol. 2002;156:737–750. doi: 10.1083/jcb.200106008. [DOI] [PMC free article] [PubMed] [Google Scholar]
- Suresh Babu S, Wojtowicz A, Freichel M, Birnbaumer L, Hecker M, Cattaruzza M. Mechanism of stretch-induced activation of the mechanotransducer zyxin in vascular cells. Sci Signal. 2012;5:ra91. doi: 10.1126/scisignal.2003173. [DOI] [PubMed] [Google Scholar]
- Medjkane S, Perez-Sanchez C, Gaggioli C, Sahai E, Treisman R. Myocardin-related transcription factors and SRF are required for cytoskeletal dynamics and experimental metastasis. Nat Cell Biol. 2009;11:257–268. doi: 10.1038/ncb1833. [DOI] [PMC free article] [PubMed] [Google Scholar]
- Korff T, Augustin GH. Integration of endothelial cells in multicellular spheroids prevents apoptosis and induces differentiation. J Cell Biol. 1998;143:1341–1352. doi: 10.1083/jcb.143.5.1341. [DOI] [PMC free article] [PubMed] [Google Scholar]
- Scherer C, Pfisterer L, Wagner AH, Hödebeck M, Cattaruzza M, Hecker M, Korff T. Arterial wall stress controls NFAT5 activity in vascular smooth muscle cells. J Am Heart Assoc. 2014;3:e000626. doi: 10.1161/JAHA.113.000626. doi: 10.1161/JAHA.113.000626. [DOI] [PMC free article] [PubMed] [Google Scholar]
- Subramanian A, Tamayo P, Mootha VK, Mukherjee S, Ebert BL, Gillette MA, Paulovich A, Pomeroy SL, Golub TR, Lander ES, Mesirov JP. Gene set enrichment analysis: a knowledge-based approach for interpreting genome-wide expression profiles. Proc Natl Acad Sci USA. 2005;102:15545–15550. doi: 10.1073/pnas.0506580102. [DOI] [PMC free article] [PubMed] [Google Scholar]
- Vervenne HBVK, Crombez KRMO, Delvaux EL, Janssens V, Van de Ven WJM, Petit MMR. Targeted disruption of the mouse Lipoma Preferred Partner gene. Biochem Biophys Res Commun. 2009;379:368–373. doi: 10.1016/j.bbrc.2008.12.074. [DOI] [PubMed] [Google Scholar]
- Renfranz PJ, Blankman E, Beckerle MC. The cytoskeletal regulator zyxin is required for viability in Drosophila melanogaster. Anat Rec. 2010;293:1455–1469. doi: 10.1002/ar.21193. [DOI] [PMC free article] [PubMed] [Google Scholar]
- Vervenne HBVK, Crombez KRMO, Lambaerts K, Carvalho L, Köppen M, Heisenberg CP, Van de Ven WJ, Petit MM. Lpp is involved in Wnt/PCP signaling and acts together with Scrib to mediate convergence and extension movements during zebrafish gastrulation. Dev Biol. 2008;320:267–277. doi: 10.1016/j.ydbio.2008.05.529. [DOI] [PubMed] [Google Scholar]
- Hervy M, Hoffman LM, Jensen CC, Smith M, Beckerle MC. The LIM protein zyxin binds CARP-1 and promotes apoptosis. Genes Cancer. 2010;1:506–515. doi: 10.1177/1947601910376192. [DOI] [PMC free article] [PubMed] [Google Scholar]
- Kato T, Muraski J, Chen Y, Tsujita Y, Wall J, Glembotski CC, Schaefer E, Beckerle M, Sussman MA. Atrial natriuretic peptide promotes cardiomyocyte survival by cGMP-dependent nuclear accumulation of zyxin and Akt. J Clin Invest. 2005;115:2716–2730. doi: 10.1172/JCI24280. [DOI] [PMC free article] [PubMed] [Google Scholar]
- Hoffman LM, Jensen CC, Chaturvedi A, Yoshigi M, Beckerle MC. Stretch-induced actin remodeling requires targeting of zyxin to stress fibers and recruitment of actin regulators. Mol Biol Cell. 2012;23:1846–1859. doi: 10.1091/mbc.E11-12-1057. [DOI] [PMC free article] [PubMed] [Google Scholar]
- Smith MA, Blankman E, Gardel ML, Luettjohann L, Waterman CM, Beckerle MC. A zyxin-mediated mechanism for actin stress fiber maintenance and repair. Dev Cell. 2010;19:365–376. doi: 10.1016/j.devcel.2010.08.008. [DOI] [PMC free article] [PubMed] [Google Scholar]
- Pellegrin S, Mellor H. Actin stress fibres. J Cell Sci. 2007;120:3491–3499. doi: 10.1242/jcs.018473. [DOI] [PubMed] [Google Scholar]
- Wang Y, Zheng XR, Riddick N, Bryden M, Baur W, Zhang X, Surks HK. ROCK isoform regulation of myosin phosphatase and contractility in vascular smooth muscle cells. Circ Res. 2009;104:531–540. doi: 10.1161/CIRCRESAHA.108.188524. [DOI] [PMC free article] [PubMed] [Google Scholar]
- Pertz O, Hodgson L, Klemke RL, Hahn KM. Spatiotemporal dynamics of RhoA activity in migrating cells. Nature. 2006;440:1069–1072. doi: 10.1038/nature04665. [DOI] [PubMed] [Google Scholar]
- Liu B, Itoh H, Louie O, Kubota K, Kent KC. The signaling protein Rho is necessary for vascular smooth muscle migration and survival but not for proliferation. Surgery. 2002;132:317–325. doi: 10.1067/msy.2002.125786. [DOI] [PubMed] [Google Scholar]
- Arnold C, Feldner A, Pfisterer L, Hödebeck M, Troidl K, Genové G, Wieland T, Hecker M, Korff T. RGS5 promotes arterial growth during arteriogenesis. EMBO Mol Med. 2014;6:1075–1089. doi: 10.15252/emmm.201403864. [DOI] [PMC free article] [PubMed] [Google Scholar]
- Wu H, Liu T, Wang R, Tian S, Liu M, Li X, Tang H. MicroRNA-16 targets zyxin and promotes cell motility in human laryngeal carcinoma cell line HEp-2. IUBMB Life. 2011;63:101–108. doi: 10.1002/iub.417. [DOI] [PubMed] [Google Scholar]


