Abstract
This paper presents the wear characteristics of the composite ceramic coating made with Al2O3-40wt%8YSZ on the biomedical grade Ti-6Al-4V alloy (grade 5) used for total joint prosthetic components, with the aim of improving their tribological behavior. The coatings were deposited using a plasma spraying technique, and optimization of plasma parameters was performed using response surface methodology to obtain dense coating. The tribological behaviors of the coated and uncoated substrates were evaluated using a ball-on-plate sliding wear tester at 37°C in simulated body-fluid conditions. The microstructure of both the titanium alloy and coated specimen were examined using an optical microscope and scanning electron microscope. The hardness of the plasma-sprayed alumina–zirconia composite coatings was 2.5 times higher than that of the Ti-6Al-4V alloy, while the wear rate of Ti-6Al-4V alloy was 253 times higher than that of the composite-coated Ti-6Al-4V alloy. The superior wear resistance of the alumina–zirconia coated alloy is attributed to its enhanced hardness and intersplat bonding strength. Wear-track examination showed that the predominant wear mechanism of Ti-6Al-4V alloy was abrasive and adhesive wear, whereas, in the case of alumina–zirconia composite coated alloy, the wear was dominated by microchipping and microcracking.
Keywords: Ti-6Al-4V alloy, alumina–zirconia, wear, Hank’s solution, titanium
Introduction
Titanium and its alloys are widely used in dental and load-bearing bioimplants, owing to their advantageous properties such as low density, low modulus, high strength-toweight ratio, excellent fatigue strength, and excellent formability, as well as superior biocompatibility and corrosion resistance.1–3 However, titanium alloy exhibits high frictional values and greater material transfer to nonmetallic counterfaces.4,5 These poor tribological properties of Ti alloys restrict their usage for articulating biomedical components. In order to overcome these wear-related problems, ceramic materials are presently being used as an alternative to the common metal femoral heads articulating against an acetabular cup of polyethylene, or metal-on-metal bearing devices. Ceramic materials are preferably suited for joint prostheses components owing to their superior wear resistance, which reduces metal ion release compared to metal components. Further, ceramics possess high hardness, good biocompatibility, and excellent corrosion-resistance properties. Abrasion can be reduced significantly when using ceramic femoral heads together with ceramic cup inserts.6
However, ceramic materials used for prosthetic components still do not address all of the demands of a durable functioning joint. Susceptibility to slow crack growth (alumina), hydrothermal instability (zirconia), squeaking noises, stripe wear, and head–neck taper mismatching are the major concerns in ceramic-on-ceramic articulating devices.7,8 Recently, ceramic coatings on implant materials using different surface modification techniques are being considered as alternative solutions to overcome the failure of ceramic materials, as they provide combined properties of both ceramic and substrate material. Titanium nitride, diamond-like carbon, and oxide coatings have been attempted using techniques such as ion implantation, physical vapor deposition, chemical vapor deposition, etc.9,10 However, the thinness of the layers formed using these techniques is a major setback, as they wear out quickly.
Among the different surface-modification techniques, plasma-sprayed ceramic coating is the best alternative to purely metal components, as it modifies their surface properties to prevent them from surface degradation in a harsh environment. Plasma-sprayed coatings are highly utilized, especially in the aerospace and naval fields, as they provide excellent wear resistance to the substrate material and provide a superior combination of mechanical properties like ductility and strength.11 Nonetheless, although plasma-sprayed ceramic coating provides the combined properties of both ceramic and metallic substrate, porosity is one of the factors by which the coating quality is assessed.12,13 Porosity level in the plasma-sprayed coating is critical for many engineering applications that have significant effect on hardness, wear and corrosion resistance, etc. Porosity is important for some applications, like lubrication, thermal barrier coatings, and for some prosthetic devices. However, plasma-sprayed ceramic coatings used for wear resistance in orthopedic load-bearing application demand the minimum level of porosity.
A number of reports reveal the influence of low porosity on increase in wear and corrosion resistance.14–17 Generally, porosity level in the plasma-sprayed coatings ranges from 1% to 10%.18 Hence, it is essential to fabricate the coating with a controlled level of porosity before it is implemented in the orthopedic load-bearing applications. Previous studies have clearly demonstrated that the porosity, size of pores, and their distribution in the coatings are strongly influenced by the plasma spraying parameters.13,19,20 The minimum level of porosity can be achieved only by employing appropriate plasma parameters. One approach to determining the appropriate plasma parameters to achieve coating with less porosity is the development of a theoretical response model and response plots and its optimization using an appropriate design of experiment approach and consistent statistical analysis. There are several research reports that demonstrate the usefulness of design of experiment techniques for the optimization of plasma parameters for various coating materials.21–25
The Al2O3-40wt%8YSZ composition was chosen as a coating material for two reasons. As alumina has low fracture toughness, the microhardness, toughness, and wear resistance of the Al2O3 coatings can be further improved by the addition of other oxides like ZrO2 or TiO2.26–32 Research on varying the composition of alumina and zirconia has been attempted to develop ceramic balls for orthopedic applications.32 Further, coatings with 40wt%ZrO2 on steel and stainless steel substrates developed using the plasma-spray process have led to better tribological results than have other compositions, which has led us to choose this composition for coating in the present study.28–31
This paper presents the fabrication of composite ceramic coatings on Ti-6Al-4V alloy using Al2O3-40wt%8YSZ composite powders and varying the most influencing parameters. Response surface methodology was used to develop a response model and response plots and for the optimization of plasma parameters. Wear tests were performed on both dense Al2O3-40wt%8YSZ coating and Ti-6Al-4V alloy, and a comparative study was made.
Experimental procedures
Commercially available Al2O3 with particle size 5–45 μm and 8mole% of yttrium-stabilized ZrO2 (8YSZ) with particle size 15–45 μm were used to obtain the composite feed-stock powders. Composite feed-stock powder was obtained by blending the 60wt% Al2O3 and 40wt% 8YSZ powders using a planetary ball mill at a speed of 250 rpm for 3 hours without addition of alumina balls, in order to prevent the breaking of particles. Figure 1 shows the scanning electron microscope (SEM) morphology of Al2O3-40wt%8YSZ composite powder after blending. It reveals uniform distribution of powders. The angular, irregularly shaped particles are Al2O3, whereas the 8YSZ powders are of spherical morphology. Figure 2 shows the X-ray diffraction pattern of the as-blended composite powders. It shows the presence of high-temperature tetragonal-ZrO2 phase and α-Al2O3 phase. All the coatings were deposited onto Ti-6Al-4V alloy (grade 5). Table 1 shows the chemical composition of Ti-6Al-4V alloy used for this study.
Figure 1.
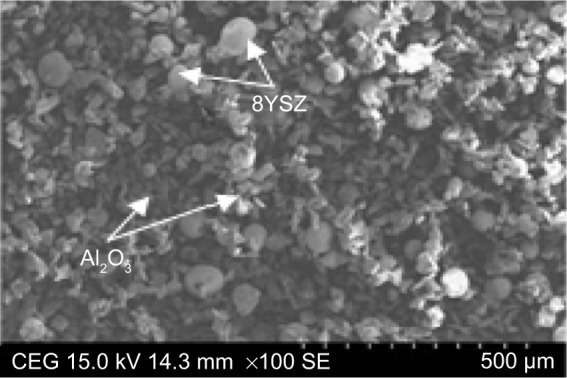
Scanning electron microscope morphology of as-blended composite powders.
Abbreviation: 8YSZ, 8 mole% of yttrium stabilized zirconia.
Figure 2.
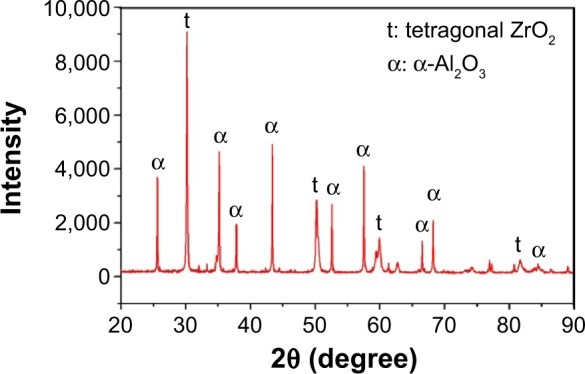
X-ray diffraction pattern of as-blended composite powders.
Table 1.
Chemical composition of the Ti-6Al-4V (grade 5) alloy
| Composition | C | Fe | V | N | Al | O | Ti |
| Weight % | 0.08 | 0.2 | 4.06 | 0.009 | 6.48 | 0.13 | Remaining |
A Metco 3MB plasma gun with a 40 Kw atmospheric plasma spray system was used to develop the coatings. Before the deposition, the substrate was sandblasted to obtain a rough surface that would promote adhesion of the coating. The plasma parameters, such as input power, primary gas flow rate, spraying distance, and powder feed rate, were found to have the most influence on hardness and porosity of the coatings.24–26 Hence, input power (P), spraying distance (S), and primary gas flow rate (A) were chosen as variables for the present study. Because the variables considered for the development of coatings are multilevel variables and their resulting effects are not linearly related, it was decided to test five levels for each variable. The ranges for the variables of input power, spraying distance, and primary gas flow rate were chosen on the basis of literature review27,28,33–37 and a large number of experimental trials. Plasma parameters for the experiment and their levels are shown in Table 2. Some parameters such as powder feed rate (9 g/min), carrier gas flow rate (5 L/min), secondary gas flow (6.5 L/min), and nozzle diameter (8 mm) were kept at constant levels throughout the experiments. Twenty experiments were conducted according to the central composite design, and three coatings were developed for each experiment.
Table 2.
Experimental factors and their levels
| Process parameters | Symbol | Levels of experimentc
|
||||
|---|---|---|---|---|---|---|
| −1.682 | −1 | 0 | 1 | 1.682 | ||
| Input power (Kw) | P | 28 | 30 | 33 | 35 | 37 |
| Spraying distance (mm) | S | 58 | 75 | 100 | 125 | 142 |
| Primary gas flow rate (L/min) | A | 32 | 36 | 42 | 48 | 52 |
Porosity measurements were performed on cross-sections of the coatings at seven different areas using an optical microscope (Carl Zeiss Meditec AG, Jena, Germany) with an attached clemex image analyzer. The porosity value measured is the fraction of an area of pores per unit area of coating. Surface morphology of all the feed-stock powders and as-sprayed coatings were investigated using a SEM (S-3400N; Hitachi Ltd., Tokyo, Japan). Before the microstructural investigation, the samples were mounted using bakelite powder and then polished using SiC papers with grit sizes ranging from 120 μm to 1,600 μm, followed by mirror polishing with diamond paste of size 1 μm. A Vickers micro hardness tester was used to find the microhardness of the coatings. Microhardness was measured across the polished cross-section of the coated samples using a load of 200 g for 15 seconds; hardness was measured at seven different points, and its average value was reported.
Design of experiments
The optimization of plasma spraying parameters is not an easy task, as the number of processing parameters involved is higher in the plasma spraying technique. Response surface methodology in the design of experiments approach is an effective tool for conducting the minimum number of experiments to get optimal plasma parameters for enhanced coating properties. This approach is beneficial from an economic point of view, as a large amount of information can be obtained from a minimal number of experimental trials. Once the experiment has been executed, the effect of each factor can be evaluated. Responses are then represented as a polynomial regression equation in the following form:
| (1) |
where i, j, and k vary from 1 to the number of variables; coefficient β0 is the mean of the responses of all the experiments; βi is the coefficient that represents the effect of the variable Xi, and βij and βijk are the coefficients of regression that represent the effects of interactions of the variables XiXj and XiXjXk, respectively. To establish the mathematical model and for optimization, the software package MiniTab version 15 was used.
Friction and wear test
Wear testing was carried out using ball-on-plate reciprocating wear tester (TR-285M; Ducom Instruments, Karnataka, India) in a Hank’s solution environment according to the American Society for Testing and Materials G133 standard. All wear tests were performed on the coating developed using optimized plasma parameters and on Ti-6Al-4V alloy. An Al2O3 ball of diameter 5.2 mm was used as a counterpart. Wear testing was conducted for the duration of 1,000,000 cycles at a constant load of 10 N at a frequency of 2 Hz with sliding stroke of 15 mm. Before the wear test, the coatings were ground using 1,600 grit SiC papers and then polished using diamond slurry of size 1 μm. The wear experiment was repeated thrice and the mean weight loss of the ball and the coating were noted. Volume loss method was used to calculate the wear rate of the ball and the coatings.
Results and discussion
Quadratic model for porosity
The coded values and actual setting values of plasma parameters and the average porosity value for each experiment are shown in Table 3. From Table 3, it can be observed that the porosity of the coatings varied substantially within the parameter space, which emphasizes the requirement for optimization of the process parameters. The average porosity value given in Table 3 was analyzed using MiniTab version 15. The second-order response surface model representing the relationship between the porosity (%) and plasma parameters was established. In this model, input power is termed as P, spraying distance is termed as S, and primary gas flow rate is termed as A. The empirical equation for predicting porosity in the form of nonreduced final equation in terms of coded factor is:
| (2) |
Table 3.
Experimental conditions and their results
| Test | Coded value
|
Actual value
|
Porosity (%) | ||||
|---|---|---|---|---|---|---|---|
| P | S | A | P | S | A | ||
| 1 | −1 | −1 | −1 | 30 | 75 | 36 | 4.51 |
| 2 | 1 | −1 | −1 | 35 | 75 | 36 | 2.25 |
| 3 | −1 | 1 | −1 | 30 | 125 | 36 | 7.23 |
| 4 | 1 | 1 | −1 | 35 | 125 | 36 | 2.21 |
| 5 | −1 | −1 | 1 | 30 | 75 | 48 | 4.00 |
| 6 | 1 | −1 | 1 | 35 | 75 | 48 | 2.76 |
| 7 | −1 | 1 | 1 | 30 | 125 | 48 | 5.13 |
| 8 | 1 | 1 | 1 | 35 | 125 | 48 | 2.38 |
| 9 | −1.682 | 0 | 0 | 28 | 100 | 42 | 6.47 |
| 10 | 1.682 | 0 | 0 | 37 | 100 | 42 | 1.54 |
| 11 | 0 | −1.682 | 0 | 33 | 58 | 42 | 3.40 |
| 12 | 0 | 1.682 | 0 | 33 | 142 | 42 | 4.50 |
| 13 | 0 | 0 | −1.682 | 33 | 100 | 32 | 3.32 |
| 14 | 0 | 0 | 1.682 | 33 | 100 | 52 | 2.21 |
| 15 | 0 | 0 | 0 | 33 | 100 | 42 | 1.70 |
| 16 | 0 | 0 | 0 | 33 | 100 | 42 | 1.82 |
| 17 | 0 | 0 | 0 | 33 | 100 | 42 | 2.10 |
| 18 | 0 | 0 | 0 | 33 | 100 | 42 | 1.70 |
| 19 | 0 | 0 | 0 | 33 | 100 | 42 | 1.70 |
| 20 | 0 | 0 | 0 | 33 | 100 | 42 | 2.41 |
Abbreviations: A, primary gas flow rate (L/min); P, input power (Kw); S, spraying distance (mm).
This model can be used to determine the porosity of composite coatings at particular design parameters within the experimental domain. The coded values of any intermediate value can be calculated using the relationship Xi =1.682 [2X−(Xmax + Xmin)]/(Xmax−Xmin), where, Xi is the required coded value between the given range, Xmax is the upper level of the variable, and Xmin is the lower level of the variable.
Statistical analysis
In order to evaluate the influential terms in the quadratic response surface model, an analysis of variance (ANOVA) table was established (Table 4). It shows that the P-value is <0.05 for all linear, square, and interactions terms. It indicates that first order, second order, and interactions of input power (P), spraying distance (S), and primary gas flow rate (A) influence porosity significantly. The order of factors that influence coating porosity more can also be established through analysis of the F-values. From Table 4 it can be seen that the parameters that influence coating porosity the most are in the order of input power, spraying distance, and primary gas flow rate. Further, adequacy of the regression model is verified by testing for lack of fit and calculation of R3.
Table 4.
ANOVA table for quadratic response surface design
| Source | Coefficient | Sum of squares | df | Mean of squares | F-value | P-value |
|---|---|---|---|---|---|---|
| Intercept | 182.761 | |||||
| P | −8.8733 | 27.00 | 1 | 27.00 | 406.0 | <0.0001 |
| S | 0.0934 | 1.77 | 1 | 1.77 | 26.66 | 0.0004 |
| A | −1.5232 | 1.00 | 1 | 1.00 | 15.05 | 0.0031 |
| P2 | 0.1227 | 8.48 | 1 | 8.48 | 127.49 | <0.0001 |
| S2 | 0.0012 | 8.05 | 1 | 8.05 | 121.11 | <0.0001 |
| A2 | 0.0091 | 1.56 | 1 | 1.56 | 23.40 | 0.0007 |
| P × S | −0.0078 | 1.91 | 1 | 1.91 | 28.74 | 0.0003 |
| P × A | 0.0265 | 1.27 | 1 | 1.27 | 19.13 | 0.0014 |
| S × A | −0.0015 | 0.42 | 1 | 0.42 | 6.30 | 0.0310 |
| Model | 48.95 | 9 | 5.44 | 81.80 | <0.0001 (significant) | |
| Residual | 0.66 | 10 | 0.07 | |||
| Lack of fit | 0.27 | 5 | 0.05 | 0.68 | 0.6585 (not significant) | |
| Pure error | 0.40 | 5 | 0.08 | |||
| Corrected total | 49.61 | 19 | ||||
| R3 | 0.986 | |||||
| Adjusted R3 | 0.972 | |||||
| Predicted R3 | 0.942 | |||||
| Adequate precision | 28.47 |
Abbreviations: A, primary gas flow rate (L/min); ANOVA, analysis of variance; df, degrees of freedom; P, input power (Kw); S, spraying distance (mm).
As shown in the ANOVA results in Table 4, the P-value for the overall model comes close to zero, which indicates that the model is significant. Further, calculation of the F-value for the lack of fit is used to test the adequacy of model. A larger F-value indicates that the model is inadequate to fit the data. The F-value for lack of fit for the porosity model is 0.68, which implies that the lack of fit is not significant relative to the pure error. There is a 65.8% chance that the lack of fit F-value could occur due to noise. The insignificant lack of fit indicates that the model is adequate. The calculated R3 value for the model is 0.986. Adjusted R3 for the model is 0.972, which indicates that the model is satisfactory to predict the porosity within 97.2% accuracy. Hence, from the above verification of model adequacy, it can be concluded that the developed mathematical model is adequate enough to describe the plasma-spraying process response model.
Contour plots: influence of plasma parameters
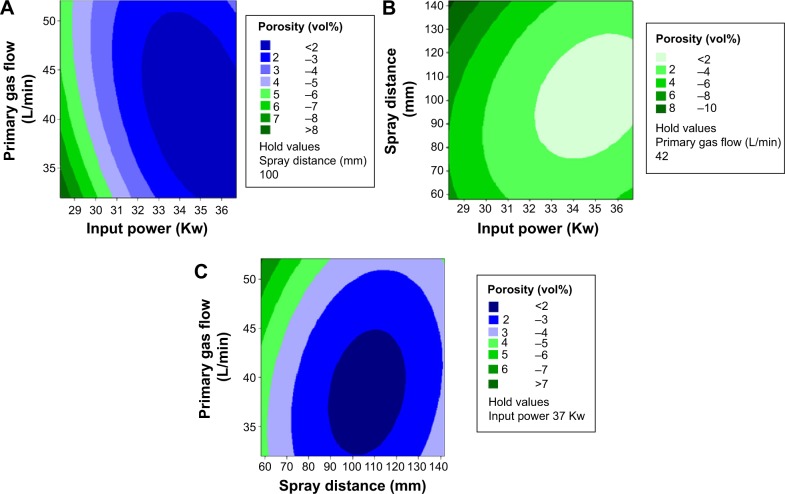
The established response model is plotted as contour plots at the constant level of input power (P), spraying distance (S), and primary gas flow rate (A), respectively (Figure 3). The contour plots based on the developed equation were generated as a function of a pair of significant parameters and keeping the third significant parameter as constant for each contour. These contour plots show the influences of power (P), spraying distance (S), and primary gas flow rate (A) on the coating porosity. Further, these plots help in the prediction of the coating porosity at any region of the experimental domain. The concentric ellipses or saddle responses in the response plot reflect a region of lower coating porosity at approximately the stationary points of each plot.
Figure 3.
Contour plots show the influence of plasma parameters on porosity.
Notes: (A) Spraying distance kept as constant; (B) primary gas flow rate kept as constant; (C) input power kept as constant.
Optimization of the plasma parameters
After constructing the regression model, a numerical optimization technique using a desirability function approach was used to optimize the plasma parameters, as this technique is widely used for the optimization of the multiple response process. The objective of the optimization is to find the best setting of parameters that minimize a particular response – ie, the objective is to maximize the desirability function. The weight can be assigned to a goal to adjust the shape of desirability function. The weight value has been varied from 0.1 to 10. The value of 1 creates a linear ramp function between the low value, the goal, and the high value. Increased weight moves the result toward the goal; otherwise, it creates negative effect. Hence, the factor setting with maximum desirability is considered to be the optimal parameter.
In the present work, MiniTab was used to optimize the response. The optimization plot for minimum porosity, shown in Figure 4, indicates that the parameter setting for achieving a minimum porosity of 1.23% has been predicted at an input power (P) of 34.9 Kw, a spraying distance (S) of 101 mm, and a primary gas flow rate (A) of 41 L/min. The desirability of optimization has been calculated as 1 – ie, all parameters are within their working range.
Figure 4.
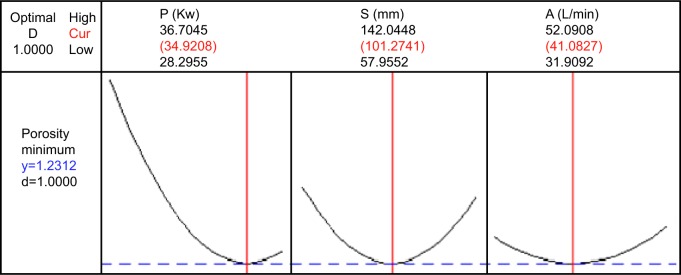
Optimizing graph shows the optimal value of plasma parameters for minimum porosity.
Abbreviations: A, primary gas flow rate (L/min); Cur, current; D, desirability; P, input power (Kw); S, spraying distance (mm).
Verification experiment
A confirmation experiment was conducted for optimal plasma parameters. Table 5 shows that the predicted value is very close to the experimental value. The experimental porosity is 1.31%, which is very close to the predicted value of 1.23%. The error percentage observed between experimental and predicted value at the optimal condition is 6.1%, which indicates that the model is significant to predict the coating porosity. The porosity value obtained for the optimal condition fairly agrees with the porosity value reported by Abdel-Samad et al28 for the same composition of feed-stock powders. The confirmation test clearly shows that the porosity model of the plasma-spraying process has been significantly improved by the optimal setting of plasma parameters.
Table 5.
Verification results
| Input power (Kw) | Spray distance (mm) | Primary gas (L/min) | Predicted porosity (%) | Experimental porosity (%) | Error (%) |
|---|---|---|---|---|---|
| 35 | 101 | 41 | 1.23 | 1.31 | 6.1 |
Microstructure of the coating
To support the confirmation of experimental results, optical and SEM micrographs of coatings developed in optimal conditions was taken (Figures 5 and 6). It can be seen that porosity is present in all the coatings. From the optical image one can easily understand the principle of determining the porosity level in the coating using optical microscopy with an image analyzer. In Figure 5B, the blue-colored portions of the image obtained by image analyzer on the cross-section of the coating represents the pores.
Figure 5.
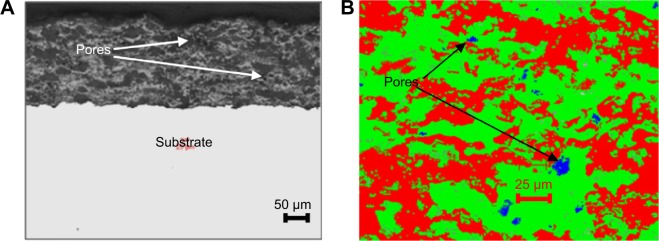
Optical micrographs of coating developed in optimal conditions.
Notes: (A) Magnification 100×; (B) magnification 200×.
Figure 6.
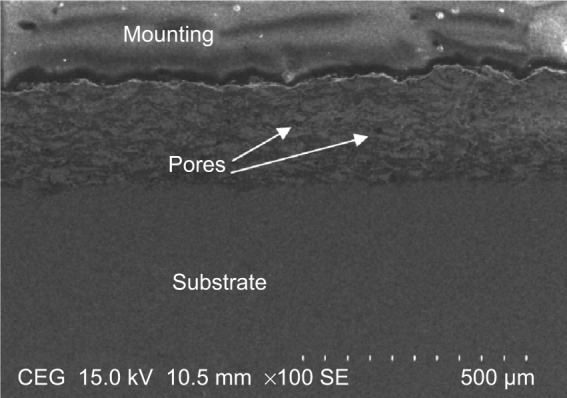
Scanning electron microscope micrograph of coating developed in optimal conditions.
Figure 6 shows the SEM micrograph of the coating developed using optimal conditions. Both optical imaging and SEM imaging clearly show that the coating developed using the optimal condition is apparently of dense structure. The porosity value observed from the microstructure also fairly agreed with the predicted value. It can also be seen that coatings are formed by layered structure with different colors. Energy dispersive X-ray analysis on different colors is shown in Figure 7. It shows that the dark lamina is for alumina splats (Figure 7A), while the bright layer corresponds to the zirconia splat (Figure 7B). From this result, one may conclude that the lower porosity of the coating is attributed to the process conditions used for the development of coatings. Further, SEM micrography shows that there were no microcracks between the coating and substrate. It indicates that coating developed with optimal conditions possesses superior adhesion strength and cohesion strength.
Figure 7.
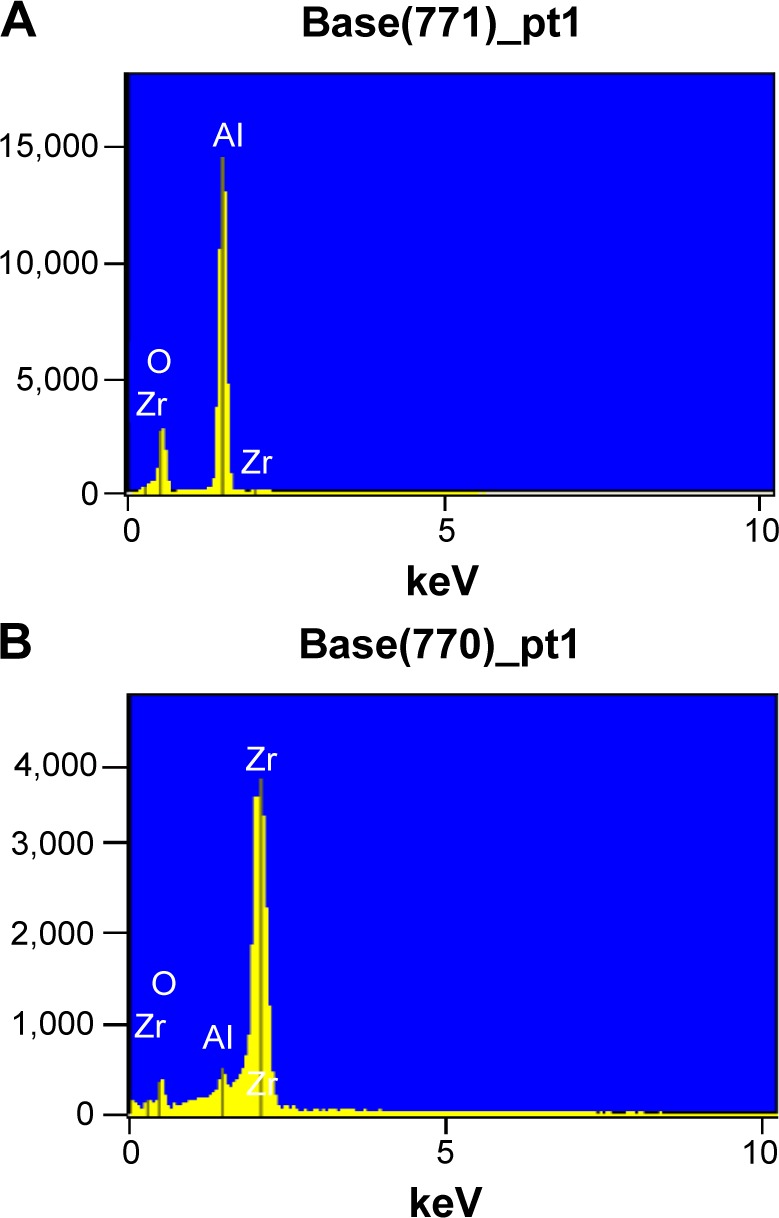
Energy dispersive X-ray analyses.
Notes: (A) Analysis taken on dark layer; (B) analysis taken on bright layer.
Microstructure of the Ti-6Al-4V alloy
Figure 8 shows the microstructure of Ti-6Al-4V alloy. It shows the typical rolled microstructure of mill-annealed α/β titanium alloy. The banding of the grains is seen along the direction of the rolling. The parallel lines of flow of grains show that the material is rolled. The grains show fine equiaxed grains of α. Some acicular α grains were also observed.
Figure 8.
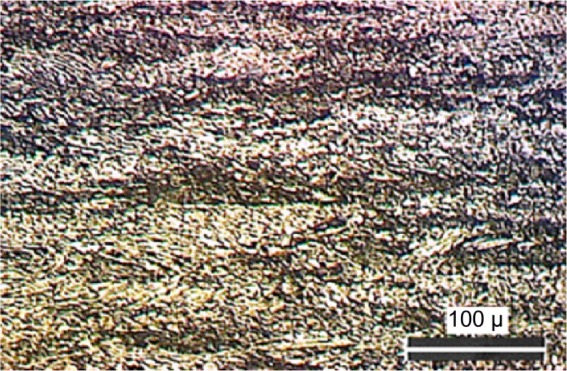
Optical micrograph of Ti-6Al-4V alloy.
Wear behavior of Ti-6Al-4V alloy and composite coating
Ti-6Al-4V alloy was subjected to wear testing for 30,000 cycles, while for Al2O3-40wt%8YSZ composite-coated specimens, the experiment was continued up to 1,000,000 cycles as the weight loss of the coating was obviously too low at the end of 30,000 cycles. Figure 9 shows the wear rate of the composite coating and Ti-6Al-4V alloy against an alumina ball in a Hank’s solution environment. Qu et al38 studied the wear behavior of Ti-6Al-4V alloy against an alumina ball under dry conditions. They found the coefficient of friction to be 0.49 and the wear rate to be 5.7×10⁻⁴ mm3/Nm. The coefficient of friction and wear rate of Ti-6Al-4V in the present work were found to be 0.454 and 3.75×10⁻⁴ mm3/Nm, respectively. It can be noted that the wear rate observed with Hank’s solution in the present work is lower than those observed in the dry condition, which is to be expected as the intermediate medium acts like a lubricant. It can also be observed in Figure 9 that the wear rate is substantially lower in the composite coating than in the bare substrate of the Ti-6Al-4V alloy.
Figure 9.
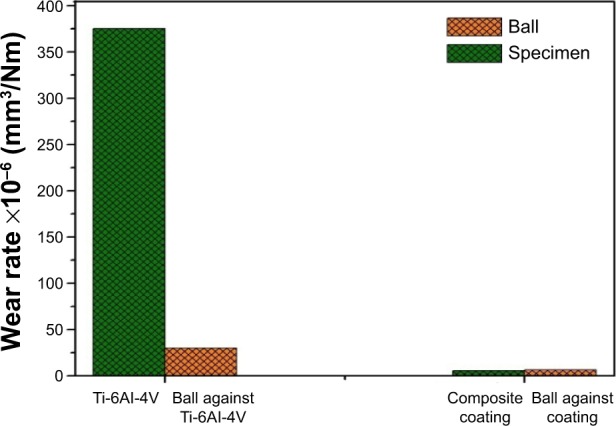
Wear rate of composite coating and Ti-6Al-4V alloy.
Further, the wear rates of the composite coatings varied from 1.48×10⁻⁶ to 375.00×10⁻⁶ mm3/Nm. The wear rate of the counterpart (alumina ball) is also shown in Figure 9. The wear rate of the counterpart against the composite coating was lower than against the bare substrate. The above study indicates that the wear resistance of the plasma-sprayed composite coating on Ti-6Al-4V alloy is superior to Ti6Al-4V alloy alone. Perumal et al39 who have studied the wear behavior of plasma-sprayed alumina and SiC coatings on Ti-6Al-4V alloy against alumina balls in the Hank’s solution environment, obtained wear rates of 7.33×10⁻⁵ mm3/Nm and 2.16×110−4 mm3/Nm, respectively. Thus, it is evident that the wear resistance observed with composite coating is superior to those that were observed in the alumina and SiC coatings. The superior wear resistance of the composite coating is attributed to its dense structure with enhanced hardness. In the present study, the hardness of the Al2O3-40wt%8YSZ composite coating (Table 6) was 2.5 times higher than the hardness of the Ti-6Al-4V alloy. Further, the adhesion strength and cohesion strength of the coating also contributed to its enhanced wear resistance.
Table 6.
Hardness of the composite coating and Ti-6Al-4V alloy
| Material | Microhardness (GPa) |
|---|---|
| Al2 O3 -40wt%8YSZ coating | 8.86±1.80 |
| Ti-6Al-4V (grade 5) | 3.59±0.71 |
The SEM micrographs presented in Figure 10 show the typical worn surface morphology of the Ti-6Al-4V alloy. Wear tracking shows the continuous sliding marks with plastically deformed grooves and ridges parallel to the sliding direction. SEM micrography of wear tracks at higher magnification shows the flakes of material removed by delamination and cracks. The existence of flakes removed from the contact surface by delamination of material strongly demonstrates the occurrence of adhesive wear in the Ti-6Al-4V alloy. This is because the contacting asperities experienced an incremental plastic deformation during sliding, which accumulated due to repeated contacts.40 When the critical value of plastic strain is achieved, cracks nucleate below the surface and propagate parallel to the surface; consequently, flakes of materials are removed from the surface by adhesion to the contact surface. It shows that the wear rate of Ti-6Al-4V alloy is appraised by the contribution of both adhesive wear and abrasive wear. This is the main cause for the higher wear rate of Ti-6Al-4V alloy against an alumina ball. The details of wear track examination and the wear mechanism for composite coating is presented elsewhere.41 The wear track morphology of the plasma-sprayed Al2O3-40wt%8YSZ coating tested against an alumina ball shows a network of fine cracks and chipping over the zirconia-rich splat. It indicates that the Al2O3-40-wt%8YSZ composite coating possesses higher intersplat cohesion strength, which enhances its wear resistance.
Figure 10.
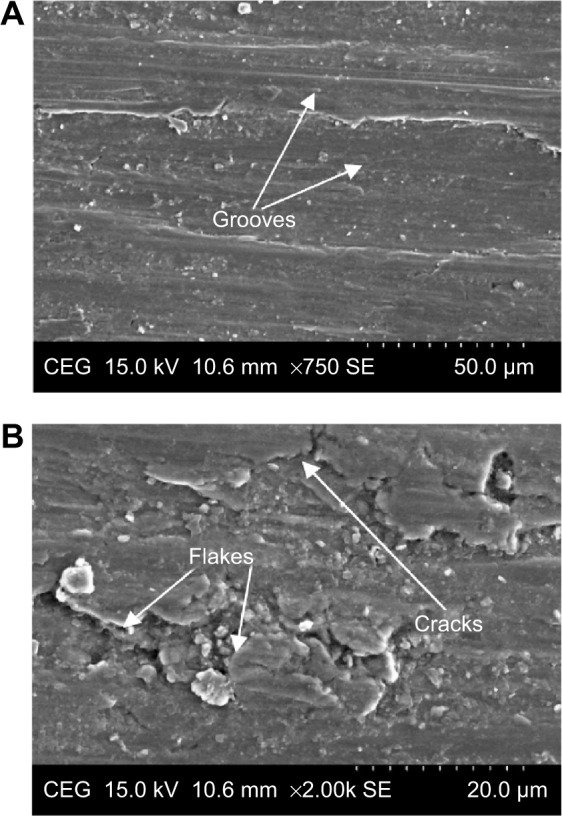
Scanning electron microscope image of wear track of the Ti-6Al-4V alloy. Notes: (A) Magnification 750×; (B) magnification 2,000×.
Conclusion
The porosity in the Al2O3-40wt%8YSZ composite coatings developed on Ti-6Al-4V alloy under different plasma parameters was measured. The measured porosity value was analyzed using a statistical software package. Wear testing was carried out on both coated specimen and bare substrate. On the basis of the experimental and analytical results, the following conclusions were drawn.
A second-order response surface model for coating porosity and contour plots were developed from the observed data. The developed response model and plots for coating porosity are effective in the prediction of relationships among the coating porosity and plasma parameters at any area of the experimental domain.
Optimal plasma parameters were identified for minimum coating porosity. The lowest porosity value was obtained at spray distance of 101 mm, input power of 35 Kw, and primary gas flow rate of 41 L/min.
Both confirmation testing and the microstructure of the coating developed in optimal conditions shows that the developed model is significant to fabricate dense coating.
Wear tests revealed that alumina–zirconia coating exhibits superior wear resistance compared to bare substrate. Dense structure with enhanced hardness and bonding strength among the splats were the main reasons for the superior wear resistance of the coating.
The wear rate of composite coating was 253 times lower than Ti-6Al-4V alloy.
Wear-track examination of the Ti-6Al-4V alloy showed that the contribution of wear of Ti-6Al-4V is evaluated by both abrasive and adhesive wear, whereas in the case of composite coating, microcracks and chipping contributed to its wear rate.
Footnotes
Disclosure
The authors report no conflicts of interest in this work.
References
- 1.Long M, Rack HJ. Titanium alloys in total joint replacement – a materials science perspective. Biomaterials. 1998;19(18):1621–1639. doi: 10.1016/s0142-9612(97)00146-4. [DOI] [PubMed] [Google Scholar]
- 2.Long M, Rack HJ. Friction and surface behavior of selected titanium alloys during reciprocating-sliding motion. Wear. 2001;249(1–2):158–168. [Google Scholar]
- 3.Geetha M, Singh AK, Asokamani R, Gogia AK. Ti based biomaterials, the ultimate choice for orthopaedic implants – A review. Progr Mater Sci. 2009;54(3):397–425. [Google Scholar]
- 4.Kustas FM, Misra B, Zhou Fabrication and characterization of TiB2/TiC and tungsten co-sputtered wear coatings. Surf Coat Technol. 2002;153(1):25–30. [Google Scholar]
- 5.Blau HM, Brazelton TR, Weimann JM. The evolving concept of a stem cell: entity or function. Cell. 2001;105(7):829–841. doi: 10.1016/s0092-8674(01)00409-3. [DOI] [PubMed] [Google Scholar]
- 6.Villermaux F. Zirconia alumina as the new generation of ceramic – ceramic THR: wear performance evaluation including extreme life conditions; Proceedings of the 6th World Biomaterials Congress, Workshop on Zirconia Femoral Heads for Total Hip Prostheses; May 15–20, 2000; Kamuela, HI: Society for Biomaterials; [Google Scholar]
- 7.Hohman DWH, Affonso J, Anders M. Ceramic-on-ceramic failure secondary to head-neck taper mismatch. Am J Orthop. 2011;40(11):571–573. [PubMed] [Google Scholar]
- 8.Khumrak S, Yakampor T. Ceramic on ceramic bearings. The Bangkok Medical Journal. 2014;4:93–103. [Google Scholar]
- 9.De Barros MI, Vandenbulcke L. Plasma assisted chemical vapor deposition process for depositing smooth diamond coatings on titanium alloys at moderate temperature. Diam Relat Mater. 2000;9(11):1862–1866. [Google Scholar]
- 10.Nolan D, Huang SW, Leskovsek V, Braun S. Sliding wear of titanium and thin films deposited on Ti-6Al-4V alloy by PVD and plasma nitriding process. Surf Coat Technol. 2006;200(20):5698–5705. [Google Scholar]
- 11.Wang D, Tian Z, Shen L, Liu Z, Huang Y. Microstructural characteristics and formation mechanism of Al2O3–13 wt.% TiO2 coatings plasma-sprayed with nanostructured agglomerated powders. Surf Coat Technol. 2009;203(10–11):1298–1303. [Google Scholar]
- 12.Li CJ, Ohmori A. Relationship between the microstructure and properties of thermally sprayed deposits. Journal of Thermal Spray Technology. 2002;11(3):365–374. [Google Scholar]
- 13.Hawthorne HM, Xie Y. An attempt to evaluate cohesion in WC/Co/Cr coatings by controlled scratching. Meccanica. 2001;36(6):675–682. [Google Scholar]
- 14.Sathish S, Geetha M, Aruna ST, Balaji N, Rajam KS, Asokamani R. Sliding wear behavior of plasma sprayed nanoceramic coatings for biomedical applications. Wear. 2011;271(5):934–941. [Google Scholar]
- 15.Morks MF, Kobayashi A. Influence of gas flow rate on the microstructure and mechanical properties of hydroxyapatite coatings fabricated by gas tunnel type plasma spraying. Surf Coat Technol. 2006;201(6):2560–2566. [Google Scholar]
- 16.Morks MF, Fahim NF, Kobayashi A. Structure, mechanical performance and electrochemical characterization of plasma sprayed SiO2/Ti-reinforced hydroxyapatite biomedical coatings. Appl Surf Sci. 2008;255(5 Part 2):3426–3433. [Google Scholar]
- 17.Sathish S, Geetha M, Aruna ST, Balaji N, Rajam KS, Asokamani R. Studies on plasma sprayed bi-layered ceramic coating on bio-medical Ti–13Nb–13Zr alloy. Ceram Int. 2011;37(4):1333–1339. [Google Scholar]
- 18.Ramachandiran CS. Thermal spray coatings and their real time industrial applications; Proceedings of the UGC Sponsored Second National Workshop on Surface Engineering; March 23–24, 2012; Tamil Nadu, India: Annamalai University, Chidambaram; [Google Scholar]
- 19.Guanhong S, Xiaodong H, Jiuxing J, Yue S. Parametric study of Al and Al2O3 ceramic coatings deposited by air plasma spray onto polymer substrate. Appl Surf Sci. 2011;257(17):7864–7870. [Google Scholar]
- 20.Sarikaya O. Effect of some parameters on microstructure and hardness of alumina coatings prepared by the air plasma spraying process. Surf Coat Technol. 2005;190(2):388–393. [Google Scholar]
- 21.Pierlot C, Pawlowski L, Bigan M, Chagnon P. Design of experiments in thermal spraying: A review. Surf Coat Technol. 2008;202(18):4483–4490. [Google Scholar]
- 22.Azarmi F, Coyle TW, Mostaghimi J. Optimization of atmospheric plasma spray process parameters using a design of experiment for alloy 625 coatings. Journal of Thermal Spray Technology. 2008;17(1):144–155. [Google Scholar]
- 23.Dyshlovenko S, Pierlot C, Pawlowski L, Tomaszek R, Chagnon P. Experimental design of plasma spraying and laser treatment of Hydroxyapatite coatings. Surf Coat Technol. 2006;201(5):2054–2060. [Google Scholar]
- 24.Hasan S, Stokes J. Design of experiment analysis of the Sulzer Metco DJ high velocity oxy-fuel coating of hydroxyapatite for orthopedic applications. Journal of Thermal Spray Technology. 2011;20(1–2):186–194. [Google Scholar]
- 25.Lin BT, Jean MD, Chou JH. Using response surface methodology for optimizing deposited partially stabilized zirconia in plasma spraying. Appl Surf Sci. 2007;253(6):3254–3262. [Google Scholar]
- 26.Luo H, Goberman D, Shaw L, Gell M. Indentation fracture behavior of plasma-sprayed nanostructured Al2O3–13wt% TiO2 coatings. Mater Sci Eng A Struct Mater. 2003;346(1):237–245. [Google Scholar]
- 27.Dejang N, Limpichaipanit A, Watcharapasorn A, Wirojanupatump S, Niranatlumpong P, Jiansirisomboon S. Fabrication and properties of plasma-sprayed Al2O3/ZrO2 composite coatings. Journal of Thermal Spray Technology. 2011;20(6):1259–1268. [Google Scholar]
- 28.Abdel-Samad AA, El-Bahloul AMM, Lugscheider E, Rassoul SA. A comparative study on thermally sprayed alumina based ceramic coatings. J Mater Sci. 2000;35(12):3127–3130. [Google Scholar]
- 29.Suffner J, Sieger H, Hahn H, et al. Microstructure and mechanical properties of near-eutectic ZrO2–60wt. % Al2O3 produced by quenched plasma spraying. Mater Sci Eng A Struct Mater. 2009;506(1–2):180–186. [Google Scholar]
- 30.Zhao X, An Y, Chen J, Zhou H, Yin B. Properties of Al2O3–40 wt%ZrO2 composite coatings from ultra-fine feed stocks by atmospheric plasma spraying. Wear. 2008;265(11):1642–1648. [Google Scholar]
- 31.Chen D, Jordan EH, Gell M. Microstructure of suspension plasma spray and air plasma spray Al2O3-ZrO2 composite coatings. Journal of Thermal Spray Technology. 2009;18(3):421–426. [Google Scholar]
- 32.Affatato S, Goldoni M, Testoni M, Toni A. Mixed oxides prosthetic ceramic ball heads. Part 3: effect of the ZrO2 fraction on the wear of ceramic on ceramic hip joint prostheses. A long-term in vitro wear study. Biomaterials. 2001;22(7):717–723. doi: 10.1016/s0142-9612(00)00235-0. [DOI] [PubMed] [Google Scholar]
- 33.Saravanan P, Selvarajan V, Srivastava MP, Rao DS, Joshi SV, Sundararajan G. Study of plasma- and detonation gun-sprayed alumina coatings using Taguchi experimental design. Journal of Thermal Spray Technology. 2000;9(4):505–512. [Google Scholar]
- 34.Nusair Khan A, Lu J. Manipulation of air plasma spraying parameters for the production of ceramic coatings. J Mater Process Technol. 2009;209(5):2508–2514. [Google Scholar]
- 35.Mawdsley JR, Su YJ, Faber KT, Bernecki TF. Optimization of small-particle plasma-sprayed alumina coatings using designed experiments. Mater Sci Eng A Struct Mater. 2001;308(1–2):189–199. [Google Scholar]
- 36.Krishnamurthy N, Prashanthareddy MS, Raju HP, Manohar HS. A study of parameters affecting wear resistance of alumina and yttria stabilized zirconia composite coatings on Al-6061 substrate. ISRN Ceramics. 2012;2012:1–13. [Google Scholar]
- 37.Heping LV, Zhao W, An Q, Nie P, Wang J, Chu PK. Nanomechanical properties and microstructure of ZrO2/Al2O3 plasma sprayed coatings. Mater Sci Eng A Struct Mater. 2009;518(1–2):185–189. [Google Scholar]
- 38.Qu J, Blau PJ, Watkins TR, Cavin OB, Kulkarni NS. Friction and wear of titanium alloys sliding against metal, polymer, and ceramic counter faces. Wear. 2005;258(2005):1348–1356. [Google Scholar]
- 39.Perumal G, Geetha M, Asokamani R, Alagumurthi N. A comparative study on the wear behavior of Al2O3 and SiC coated Ti-6Al-4V alloy developed using plasma spraying technique. Trans Indian Inst Met. 2013;66(2):109–115. [Google Scholar]
- 40.Cvijović-Alagić I, Cvijović Z, Mitrović S, Rakin M, Veljović D, Babić M. Tribological behaviour of orthopaedic Ti-13Nb-13Zr and Ti-6Al-4V alloys. Tribol Lett. 2010;40(1):59–70. [Google Scholar]
- 41.Perumal G, Geetha M, Asokamani R, Alagumurthi N. Wear studies on plasma sprayed Al2O3–40 wt%8YSZ composite ceramic coating on Ti–Al–4V alloy used for biomedical applications. Wear. 2014;311(1–2):101–113. [Google Scholar]


