Abstract
In virtually all tissues, disease progression is accompanied by changes in the mechanical properties. Laser speckle rheology (LSR) is a new technique we have developed to measure the mechanical properties of tissue. By illuminating the sample with coherent laser light and calculating the speckle intensity modulations from reflected laser speckle patterns, LSR calculates τ, the decay time constant of intensity decorrelation which is closely associated with tissue mechanical properties. In this paper we validate the use of LSR technology in measuring mechanical properties of tissue. LSR measurements of τ are performed on a variety of phantom and tissue samples and compared with the complex shear modulus G*, measured using a rheometer. In all cases, strong correlation is observed between τ and G* (r=0.95, p<0.002). These results demonstrate the efficacy of LSR as a non-invasive and non-contact technology for mechanical evaluation of biological samples.
I. Introduction
It is well known that disease progression in major killers such as cancer and atherosclerosis, and several other debilitating disorders including neurodegenerative disease and osteoarthritis, is accompanied by changes in tissue mechanical properties. Most available evidence on the significance of biomechanical properties in evaluation of disease is obtained using conventional mechanical testing, ex vivo, which involves straining, stretching, or manipulating the sample [1]. To address the need for mechanical characterization in situ, our laboratory has developed a new optical tool, Laser Speckle Rheology (LSR).
When a turbid sample, such as tissue, is illuminated by a coherent laser beam, rays interact with tissue particles and travel along paths of different lengths due to multiple scatterings. Self-interference of the returning light creates a pattern of dark and bright spots, known as laser speckle. Due to thermal Brownian motion of scattering particles, light paths constantly change and speckle pattern fluctuates with time scales corresponding to the mechanical properties of the medium surrounding the scattering centers.
LSR exploits this concept and analyses the intensity decorrelation of backscattered rays to produce an estimate of tissue biomechanics [2–5]. To this end, LSR calculates the intensity decorrelation function of speckle series, g2(t), and extracts its decay time constant, τ, as a measure of biomechanical properties. The goal of this paper is to investigate the relationship between LSR measurements of τ and conventional bulk mechanical testing measurements of the shear complex modulus G*.
II. Materials and Methods
A. Laser Speckle Rheology using a Bench-top Set-up
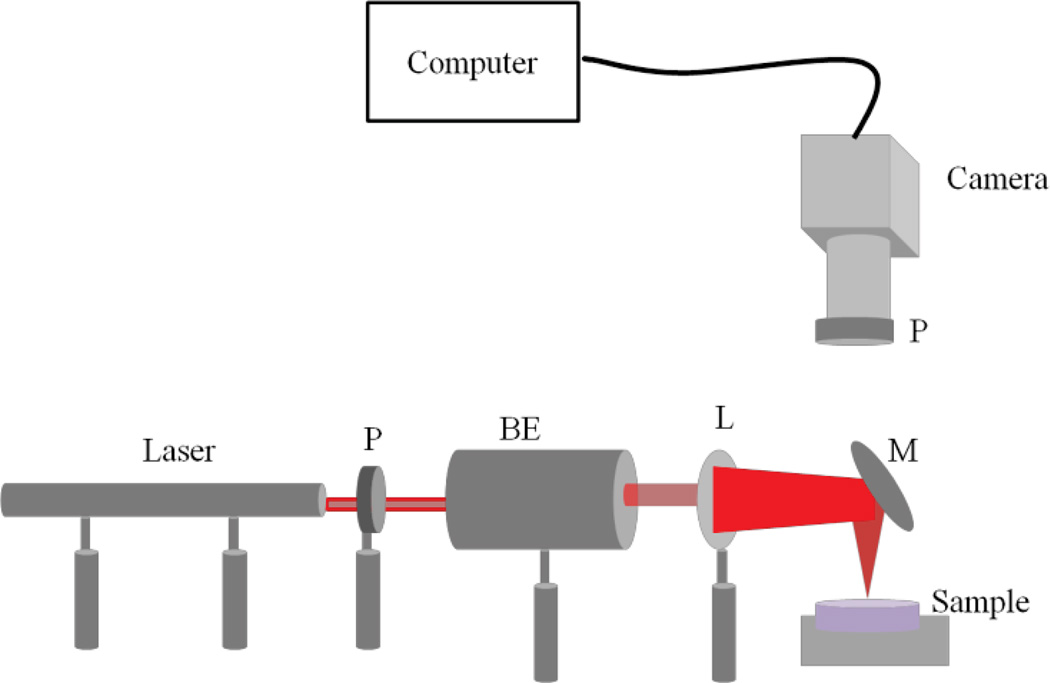
Bulk mechanical properties of tissue and Polydimethylsiloxane (PDMS) [6] substrates are measured using a bench-top LSR set-up shown in Fig. 1. This set-up includes a 632 nm Helium-Neon laser of 20 cm coherence length followed by a linear polarizer and a 1:5 beam expander. A 25 cm focal length lens and a plane mirror are used to focus the illumination spot at the sample site. Laser speckle patterns are imaged using a high speed CMOS camera. The image series are processed and the correlation between each two frames is calculated to determine the intensity decorrelation function, g2(t). Temporal and spatial averaging is applied over the image series pixels to reduce statistical errors. A single exponential is fitted to the resulting g2(t) curve to extract the time constant, τ.
Fig. 1.
Schematic of the LSR stystem, BE: Beam Expander, L: Lens, M: Mirror, P: Polarizer.
B. Conventional Mechanical Testing Using an AR-G2 Rheometer
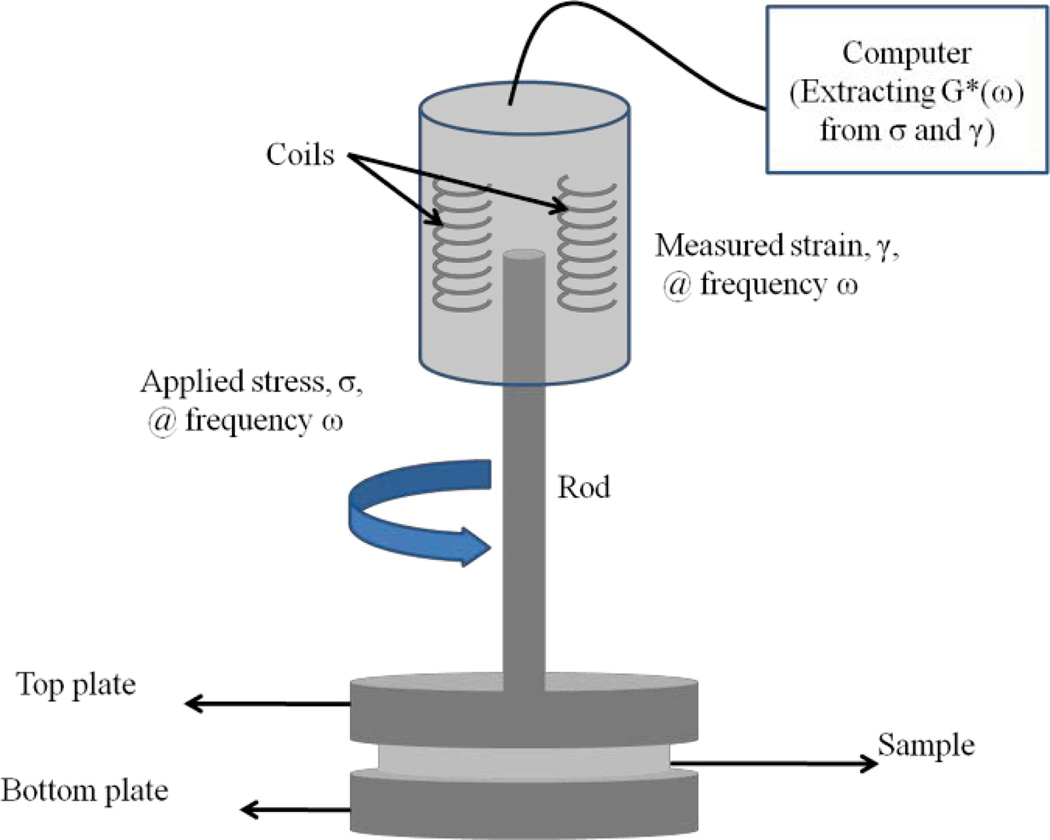
An AR-G2 Rheometer (TA Instruments) is used to perform conventional mechanical testing. To this end, samples are loaded between the top and bottom plates as shown in Fig. 2. With the strain percentage as a controlled variable (0.1%), a frequency sweep procedure is performed to measure G* over an appropriate frequency range. Measurements are performed at 24° C temperature.
Fig. 2.
A simplified schematic of the AR-G2 rheometer (TA Instruments). Stress (torque) is applied at the frequency of ω and the corresponding strain (rotation) is measured. The rheometer is interfaced with a computer equipped with the Rheology Advantage software (TA Instruments). This software extracts G* at the frequency of ω. In a frequency sweep step, G* is measured over the specified frequency range.
C. PDMS substrates preparation
PDMS is chosen for this study as it is a viscoelastic material and its complex shear modulus can be adjusted accurately by changing the ratio of base elastomer and curing agent. Moreover, measurement of mechanical properties during the course of curing process enables evaluation of LSR sensitivity to small gradual changes in mechanical properties.
PDMS substrates are prepared by mixing the curing agent (Sylgard ® 184 silicone elastomer curing agent) and base (Sylgard ® 184 silicone elastomer base) in 1 to 10 proportions, respectively. Since PDMS gels are transparent, TiO2 power is added to the curing agent prior to mixing in order to create scattering features. The final volume fraction of TiO2 particles is 1 %, to realize a sufficiently strong back-scattered signal. The batch is vortexed and sonicated to ensure proper mixing of the particles in the gel. A portion of the gel is placed in a petri plate for LSR measurements and the rest is loaded between top and bottom 40 mm rheometer plates. Next and every 30 minutes, LSR measurements are obtained followed by a conventional mechanical frequency sweep for duration of 12 hours. A final time point measurement is performed on fully cured PDMS gels using both LSR and AR-G2 instrument at 48hours.
D. Tissue preparation
Tissue samples are harvested from bone, cartilage, liver, muscle and myocardium using a biopsy punch of 6 mm diameter. LSR measurements are obtained at 24° C and the corresponding τ values are calculated as described above. Next, conventional rheology is performed to extract complex shear modulus.
III. Results
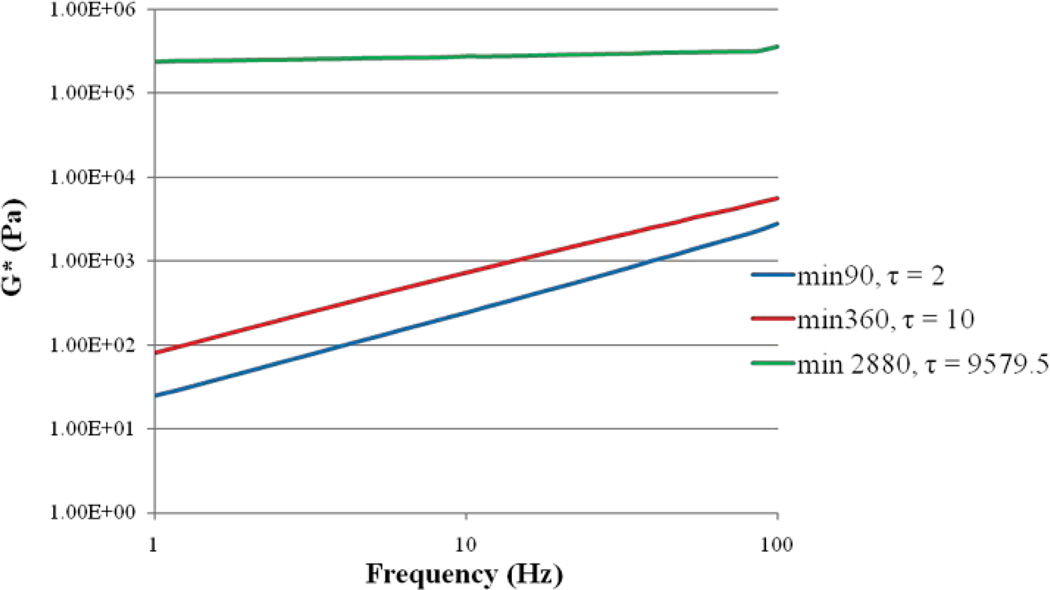
Fig. 3 displays the linear viscoelastic modulus, G*, curves labeled with the corresponding τ values for multiple PDMS gel substrates at different points during the course of curing process (0 to 12 hours). While at initial curing times both G* and τ are low, they increase as the gel cures over time. An excellent correlation is observed between G* and τ values (r=0.95, p<0.002).
Fig. 3.
Complex shear modulus vs. frequency resulted from mechanical rheology along with τ values extracted from laser speckle rheology. Both τ and G* increase as PDMS cures.
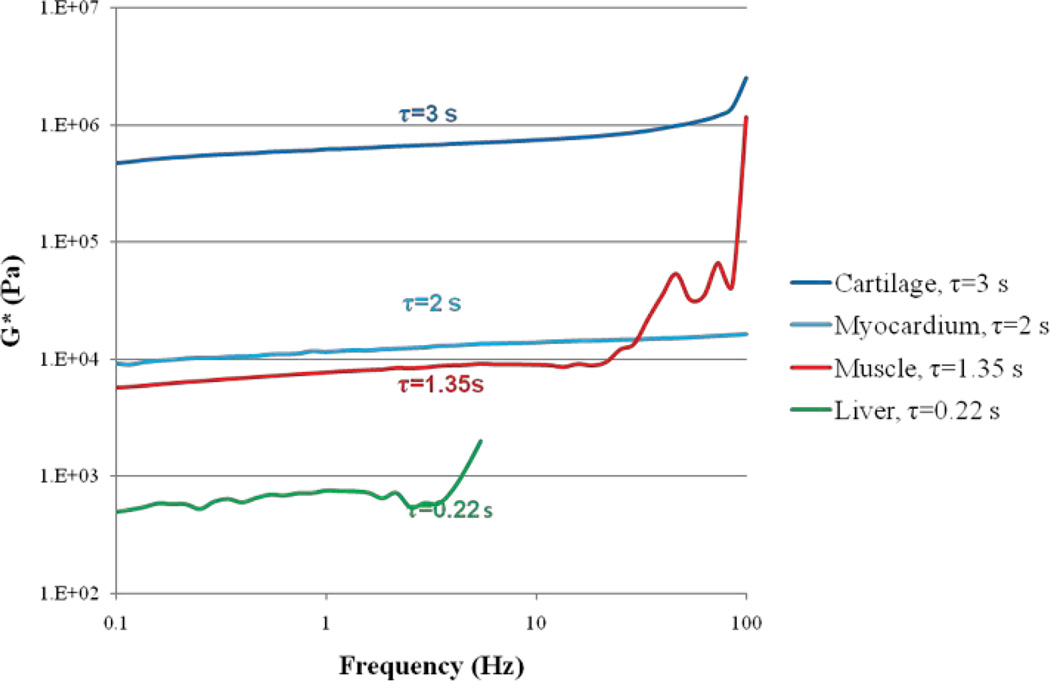
Fig. 4 demonstrates complex shear modules for 4 tissue samples, namely chicken cartilage, liver, skeletal muscle and myocardium. The corresponding τ values are provided. Mechanical testing measurements of G* shows high correspondence with LSR measurements of τ. As expected, cartilage shows both the highest G* and τ value, due to its high elasticity. On the other hand, chicken liver sample exhibit both the lowest G* and τ value, as it is the softest sample. Skeletal muscle and myocardium are in the middle and demonstrate similar mechanical attributes and τ values.
Fig. 4.
Complex shear modulus vs. frequency resulted from mechanical rheology along with τ values extracted from laser speckle rheology. For stiff tissue samples, such as cartilage, both τ and G* are high, whereas for soft samples, such as liver, both τ and G* are low.
IV. Discussion
The strong correlation between τ and G* in PDMS substrates demonstrates the ability of LSR in extracting mechanical properties. The time course measurement of PDMS mechanical properties reveals that LSR is exquisitely sensitive to small gradual changes in sample mechanics. While at initial curing times, PDMS is basically a fluid of moderate viscosity with modulus in the order of 30 Pa, the fully cured PDMS substrate is primarily elastic with shear modulus in the orders of 100 KPa. Nevertheless LSR is able to accurately track changes of mechanical properties in this wide range. Similar observations are made by examining the qualitative tissue samples’ results. More specifically, LSR is capable of characterizing mechanical properties in various types of tissue. These results demonstrate the invaluable potential of LSR to turn into a clinical diagnostic tool for evaluating tissue biomechanical properties. LSR is a non-contact approach and can be conducted via small diameters endoscopes [4, 5], which opens the powerful opportunity to measure tissue mechanical properties in situ for a number of clinical applications.
Acknowledgment
The authors thank Winnie W. Ong for her assistance with tissue samples preparation. This work was funded by the following NIH grants: 5R21HL089203-01 and the ARRA supplement 3R21HL089203-01A1S1.
Contributor Information
Zeinab Hajjarian, Wellman Center for Photomedicine, Harvard Medical School, 40 Blossom St., Boston, MA 02114, USA (zhajjarian@partners.org)..
Seemantini K. Nadkarni, Wellman Center for Photomedicine, Harvard Medical School, 40 Blossom St., Boston, MA 02114, USA (phone: 617-726-0183, snadkarni@partners.org)..
References
- 1.Suresh S. Biomechanics and biophysics of cancer cells. Acta Biomater. 2007 Jul;3:413–438. doi: 10.1016/j.actbio.2007.04.002. [DOI] [PMC free article] [PubMed] [Google Scholar]
- 2.Nadkarni SK, Bouma BE, Helg T, Chan R, Halpern E, Chau A, Minsky MS, Motz JT, Houser SL, Tearney GJ. Characterization of atherosclerotic plaques by laser speckle imaging. Circulation. 2005 Aug 9;112:885–892. doi: 10.1161/CIRCULATIONAHA.104.520098. [DOI] [PMC free article] [PubMed] [Google Scholar]
- 3.Nadkarni SK, Bilenca A, Bouma BE, Tearney GJ. Measurement of fibrous cap thickness in atherosclerotic plaques by spatiotemporal analysis of laser speckle images. J Biomed Opt. 2006 Mar-Apr;11:21006. doi: 10.1117/1.2186046. [DOI] [PMC free article] [PubMed] [Google Scholar]
- 4.Nadkarni SK, Bouma BE, D Y, Tearney J G. Laser Speckle Imaging of atherosclerotic plaques through optical fiber bundles. J Biomed Opt. 2008 Sep-Oct;13:054016. doi: 10.1117/1.2982529. [DOI] [PMC free article] [PubMed] [Google Scholar]
- 5.Hajjarian Z, Xi J, Jaffer FA, Tearney GJ, Nadkarni SK. Intravascular laser speckle imaging catheter for the mechanical evaluation of the arterial wall. J Biomed Opt. Mar-Apr;16:026005. doi: 10.1117/1.3533322. [DOI] [PMC free article] [PubMed] [Google Scholar]
- 6.Chang-Yen DA, Eich RK, K GB. A monolithic PDMS Waveguide system fabricated using sof-lithography techniques. Journal of Lightwave Technology. 2005;23:6. [Google Scholar]


