Abstract
Sodium nitrite is widely recognized to be a highly effective NO donor for the treatment of several ischemic tissue disorders. However, mechanisms by which nitrite confers cytoprotection during ischemic disorders remain largely unknown. In this study, we used genome expression profiling approaches to evaluate changes in gene expression in the hind-limb ischemia model using vehicle or sodium nitrite therapy. Sodium nitrite significantly restored ischemic tissue perfusion by day 3 post-ligation which returned to normal by day 7. Genesifter analysis of Affymetrix GeneChip data revealed a significant down-regulation of gene expression profiles at day 3, whereas gene expression profiles were predominantly up-regulated at day 7. Ingenuity network analysis of gene expression profiles at day 3 showed a strong decrease in gene expression from networks associated with immune functions such as acute inflammatory responses, antigen presentation, and humoral immune responses while networks containing increased gene expression profiles were associated with cardiovascular, skeletal, and muscle system development and function. Network analysis of day 7 gene array data revealed predominant up-regulation of genes associated with cell survival, tissue morphology, connective tissue function, skeletal and muscular system development, and lymphoid tissue structure and development. These data suggest that sodium nitrite elicits potent anti-inflammatory and pro-angiogenic gene responses at early time points which is later followed by up-regulation of genes associated with tissue repair and homeostasis.
Keywords: gene array, mRNA, angiogenesis, inflammation, vascular function
Introduction
Nitrite anion is now widely appreciated as a highly useful therapeutic agent for various ischemic disorders due to its one electron reduction to nitric oxide (NO) under such conditions. Nitrite reduction to NO during ischemia can occur in a host of various ways including but not limited to deoxyhemoglobin and deoxymyoglobin [1, 2], acidic diproportionation [3], mitochondrial electron transport molecules [4], xanthine oxidoreductase [5], eNOS [6], and other recently identified mechanisms described in this issue. This array of potential reduction mechanisms for nitrite makes it a useful source of nitric oxide during ischemic conditions which could be beneficial in a number of disease states encompassing a role for these responses.
Nitrite therapy has been successful in diverse experimental models of cardiovascular disease involving ischemic and inflammatory mediated tissue injury. Nitrite therapy plays a major cytoprotective role in murine models of myocardial, hepatic, and neurological ischemia/reperfusion injury [7–10]. Moreover, nitrite therapy confers significant protection in a canine model of acute coronary artery occlusion which was also associated with increased cytoprotection and improvement of microvascular perfusion [11]. Stokes et al has recently reported nitrite to have anti-inflammatory properties in a high cholesterol diet induced model of inflammation [12]. We have previously reported that nitrite therapy rapidly restores blood flow to chronically ischemic tissue by stimulating angiogenesis and endothelial cell proliferation as well as augmenting collateral vessel development [13]. Recent work from Isenberg et al also demonstrates that nitrite therapy enhances skin flap wound healing which is coupled with increased angiogenesis and attenuated thrombospondin-1 function [14]. Together, these studies demonstrate that nitrite therapy is a potent mediator of tissue cytoprotection during ischemia which implies a wide impact on several biological functions.
Despite the overwhelming beneficial data of nitrite therapy for ischemic cardiovascular system disorders, there is much less information regarding molecular mechanisms of nitrite mediated tissue protection. Moreover, very little specific information is available regarding what specific genes are affected by nitrite therapy in ischemic tissue pathologies. As nitrite therapy is becoming increasingly attractive for clinical uses, a clear understanding of the genes affected and how they work together is necessary to determine its mechanisms of action and ideal situations for the therapeutic use of nitrite anion. The purpose of this study was to perform genome wide expression profile analysis to identify unique molecular targets of nitrite therapy during chronic hind-limb ischemia. Data gleaned from this study reveals that nitrite anion potently down regulates gene expression of cell mediated and humoral immune responses while simultaneously increasing gene expression of cardiovascular and muscular system development and function at early time points which is followed by a later, more moderate induction of tissue repair related genes. These data provide the first insight into molecular pathways which are involved in the beneficial effects of nitrite therapy for chronic ischemia.
Experimental Procedures
Animals
14 week old male C57BL/6J mice were obtained from Jackson Labs and housed at the Association for Assessment and Accreditation of Laboratory Animal Care, internationally accredited Louisiana State University Health Sciences Center–Shreveport animal resource facility, and maintained according to the National Research Council’s Guide for Care and Use of Laboratory Animals. All experiments were performed with approval of the Institutional Animal Care and Use Committee.
Induction of chronic ischemia and measurement of hind limb blood flow
Induction of chronic hind limb ischemia was performed as we have previously reported [13, 15]. 165 μg/kg sodium nitrite therapy or PBS control treatments were began the afternoon after hind limb ligation via intraperitoneal injection. Two separate 165 μg/kg sodium nitrite doses were given as we have previously published the first in the morning and the second in the afternoon [13]. Gastrocnemius muscle tissue was harvested on the morning of the 4th and 8th days to give an entire 3 and 7 day period for study. Four separate experimental cohorts of animals were used for this study including: day 3 PBS treatment (n=4), day 7 PBS treatment (n=4), day 3 sodium nitrite treatment (n=4), and day 7 sodium nitrite treatment (n=4). Each individual ischemic gastrocnemius muscle specimen was harvested per animal, per cohort with each tissue specimen analyzed on a single gene array for a total of 16 individual arrays (n=4 per experimental cohort) being used to survey changes in genome expression profiles. Harvested tissue was immediately frozen in liquid nitrogen for subsequent total RNA isolation. Laser doppler blood flow measurements were taken from non-ischemic and ischemic hind limbs prior to tissue collection to determine the amount of ischemic tissue perfusion using a Vasamedics Laserflo BPM2 deep tissue penetrating doppler device as we have previously reported [13, 15]. Percent restoration of blood flow was determined by dividing the ischemic hind limb blood flow by the non-ischemic hind limb blood flow and multiplying by 100. Statistical analysis of changes in tissue blood flow between treatment groups at specific time points were performed with an unpaired students t-test using Prism software (Graphpad).
RNA isolation and microarray hybridization
Total RNA was isolated from either PBS or sodium nitrite treated gastrocnemius muscle tissues specimens at day 3 or day 7 post-ischemia using the RNeasy Midi Kit (Qiagen, Chatswort, CA). RNA integrity was checked using the Agilent 2100 Bioanalyzer (Agilent Technologies, Palo Alto, CA). The RNA integrity number (RIN) for all specimens used for gene array analysis was between 8–9. Double stranded cDNA was synthesized from 5ug total RNA using a Superscript cDNA synthesis Kit (Invitrogen, Carlsbad, CA) and purified using the Gene Chip Sample Cleanup Module (Affymetrix, Santa Vlara, CA). After biotin-labeling, the cDNA were fragmented at 94°C and hybridized to the Mouse Genome 430 2.0 Array (Affymetrix), which contains 39,000 fully annotated transcripts of the mouse genome. After washing and staining, the arrays were scanned using GeneChip Scanner 3000 (Affymetrix) and hybridization efficiency determined by housekeeping control and spike control probe sets. Analysis of all control probe sets received a pass call demonstrating consistent hybridization efficiency across all specimens.
Microarray data normalization and statistical analysis
Array data were globally scaled to a target intensity value of 500 to compare individual array experiments. To determine differentially expressed genes between PBS and nitrite treatment, data were log transformed and uploaded into Genesifter program (www.genesifter.net). Identification of changes in gene expression were determined using a pair-wise comparison of PBS versus nitrite therapy gene array data at from an individual tissue specimen hybridized to a single gene chip for each time point per treatment condition (i.e. day 3: PBS n=4 and sodium nitrite n=4, same for day 7). The following analysis criteria was used to identify significant changes in gene expression using Genesifter: a minimal 2-fold difference in expression with no maximal threshold limit, a hybridization quality cutoff of 1, and an unpaired student t-test between treatment groups followed by Benjamini and Hochberg post test to limit false discovery rates.
Ingenuity network analysis
Due to the complexity of reactions between molecules, changes in gene expression are often influenced by other genes, that is to say one gene may be regulated by many different molecules which itself then also regulates many other gene targets, thus classical hierarchical expression analysis cannot reveal complicated relationships between various changes in gene expression. Network analysis using Ingenuity Pathway analysis software can organize gene expression changes into groups of genes which highly influence one another governing specific biological functions. As such, network analysis of large data sets facilitates identification of novel gene expression associations advancing discovery of potential mechanistic pathways which have not been considered. Therefore, genes which were significantly altered as identified by Genesifter analysis were uploaded into Ingenuity software (www.ingenuity.com) to perform network analysis. The software scans the input gene expression data to provide networks by using the Ingenuity Pathway Knowledge Base, which is a data base created from data mining for expression and functional relationships between molecules extracted from previously published peer reviewed papers found in NCBI Pubmed, Medline, and several other databases. The resulting output of network analysis is broken down into genetic composition of networks, biological function of networks, the number of interrelated network relationships, as well as statistical analysis of individual networks.
Results
Relationship between sodium nitrite therapy and global gene expression
We and others have shown that nitrite therapeutic intervention elicits rapid and robust resolution of tissue dysfunction during ischemia [10, 16]. However, no data exists regarding genome expression profile changes at various stages of nitrite therapeutic intervention. Figure 1A illustrates that sodium nitrite therapy progressively restores ischemic hind limb perfusion over the course of seven days which is first observed at day 3 and maximal at day 7. Therefore, we performed genome expression profile analysis from either PBS vehicle or sodium nitrite (165 μg/kg) ischemic gastrocnemius muscle tissue at day 3 and day 7. Figure 1B shows heat map results between PBS control and sodium nitrite gene expression profiles at day 3. 457 distinct gene expression profiles were significantly altered with nitrite therapy eliciting a large down regulation of 346 genes compared to up-regulation of 111 genes. Conversely, figure 1C demonstrates that sodium nitrite therapy differentially impacts the expression profile of 274 genes at day 7 of ischemia but that the majority of these genes are up-regulated (219 genes) compared to fewer that were down-regulated (55 genes). Supplementary Table 1 and 2 list the genes, change ratio (± SEM) of expression levels compared to PBS control, and p-values which were identified at days 3 and 7, respectively. Together, these data reveal an unexpected yet interesting gene expression profile pattern whereby nitrite therapy mediates a large and preferential down-regulation of gene expression at day 3 which transitions to a smaller yet positively up-regulated group of genes at day 7.
Figure 1. Nitrite therapy restores ischemic hind limb blood flow and stimulates changes in gene expression.
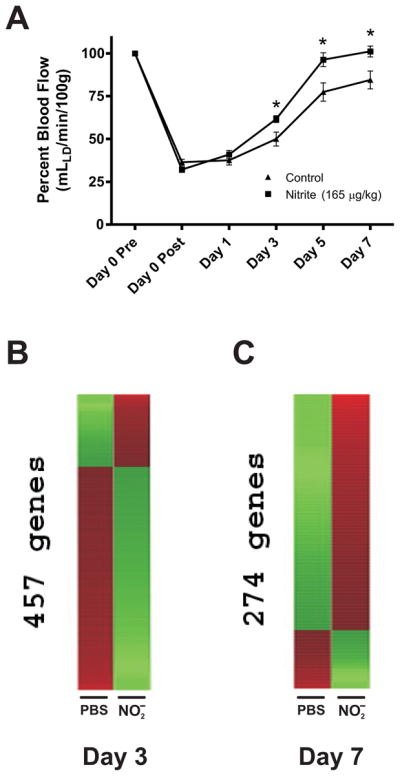
Panel A shows the effect of 165 μg/kg sodium nitrite therapy on ischemic hind limb blood flow compared to PBS control treatment. n=4 mice per cohort, *p<0.05 nitrite versus PBS per respective time point. Panel B shows nitrite dependent heat map changes in ischemic tissue gene expression compared to PBS control treatment at day 3 post ischemia. The expression of 457 genes was significantly altered with 111 genes up-regulated and 346 genes down-regulated. Panel C illustrates nitrite dependent heat map changes in ischemic tissue gene expression compared to PBS control at day 7 post ischemia. The expression of 274 genes was significantly changed with 219 up-regulated and 55 down-regulated. Red indicates up-regulation whereas green indicates down-regulation.
Nitrite therapy regulation of canonical Kyoto Encyclopedia of Genes and Genomes (KEGG) pathways
KEGG pathway analysis was performed to determine what biological pathways may be affected by sodium nitrite therapy. Table 1 reports the list of KEGG pathways involved at days 3 and 7. Interestingly, the dominant KEGG pathway identified at day 3 was the cytokine-cytokine receptor interaction pathway with 13 out of a possible 198 genes being significantly altered. Other KEGG pathways which were also identified at day 3 include metabolic and signaling regulatory pathways as well as adhesion molecule dependent responses such as extracellular matrix-receptor interactions, gap junction molecules, focal adhesions, and leukocyte transendothelial migration pathways. The top KEGG pathway identified at day 7 involved the PPAR signaling pathway as well as others involving sphingolipid metabolism and extracellular matrix-receptor interactions. Closer examination of all the KEGG pathways involved at day 7 revealed a wide yet smaller number of molecules associated with established KEGG pathways.
Table 1.
Identified KEGG Pathways
| Day 3 | List | Gene Set | z-score |
|---|---|---|---|
| Cytokine-cytokine receptor interaction | 13 | 198 | 4.42 |
| ECM-receptor interaction | 4 | 50 | 2.86 |
| Starch and sucrose metabolism | 3 | 35 | 2.62 |
| Porphyrin and chlorophyll metabolism | 2 | 20 | 2.42 |
| Calcium signaling pathway | 6 | 115 | 2.3 |
| Focal adhesion | 6 | 119 | 2.21 |
| Pentose and glucuronate interconversions | 1 | 7 | 2.21 |
| Bile acid biosynthesis | 2 | 24 | 2.09 |
| Metabolism of xenobiotics by cytochrome P450 | 3 | 49 | 1.92 |
| Leukocyte transendothelial migration | 4 | 79 | 1.8 |
| Gap junction | 3 | 55 | 1.7 |
| Glycosphingolipid biosynthesis - neo-lactoseries | 1 | 11 | 1.58 |
| Melanoma | 2 | 35 | 1.45 |
| Cysteine metabolism | 1 | 14 | 1.29 |
| Keratan sulfate biosynthesis | 1 | 14 | 1.29 |
| Parkinson’s disease | 1 | 14 | 1.29 |
| Cell Communication | 3 | 70 | 1.24 |
| B cell receptor signaling pathway | 2 | 41 | 1.21 |
| Glycan structures - biosynthesis 2 | 2 | 43 | 1.13 |
| Day 7 | |||
| PPAR signaling pathway | 5 | 50 | 4.21 |
| Sphingolipid metabolism | 3 | 23 | 3.91 |
| ECM-receptor interaction | 4 | 50 | 3.17 |
| Complement and coagulation cascades | 3 | 41 | 2.54 |
| Alanine and aspartate metabolism | 2 | 23 | 2.38 |
| Cell Communication | 4 | 70 | 2.35 |
| Wnt signaling pathway | 5 | 102 | 2.24 |
| Nicotinate and nicotinamide metabolism | 2 | 28 | 2.03 |
| Jak-STAT signaling pathway | 5 | 114 | 1.97 |
| Gap junction | 3 | 55 | 1.94 |
| GnRH signaling pathway | 3 | 57 | 1.87 |
| Focal adhesion | 5 | 119 | 1.86 |
| Glycine, serine and threonine metabolism | 2 | 33 | 1.75 |
| Chondroitin sulfate biosynthesis | 1 | 11 | 1.74 |
| Carbon fixation | 1 | 14 | 1.43 |
| Glioma | 2 | 44 | 1.28 |
| Insulin signaling pathway | 3 | 79 | 1.24 |
| Adipocytokine signaling pathway | 2 | 48 | 1.15 |
| Citrate cycle (TCA cycle) | 1 | 20 | 1.01 |
| Small cell lung cancer | 2 | 53 | 1 |
Ingenuity network analysis of nitrite therapy during chronic ischemia
With nitrite therapy exerting a significant change in global gene expression profiles yet showing a modest involvement with classically established KEGG pathways and molecules, we next examined our gene array data using Ingenuity analysis software to identify novel network relationships among differentially expressed genes which may not clearly segregate into classical KEGG pathways. Figure 2 illustrates the number of networks and relationships among them at days 3 and 7. Ingenuity analysis of global expression data from both days revealed 17 distinct networks. However, the number of interactive relationships (found in parentheses) among networks were much greater at day 3 versus 7 suggesting nitrite therapy mediates wide ranging effects intertwining several biological functions. Together, these data suggest that nitrite therapy has a significant impact on biological functions which do not fall under classically defined pathways suggesting novel mechanisms of cytoprotection, tissue preservation, and healing.
Figure 2. Internetwork relationships during nitrite therapy.
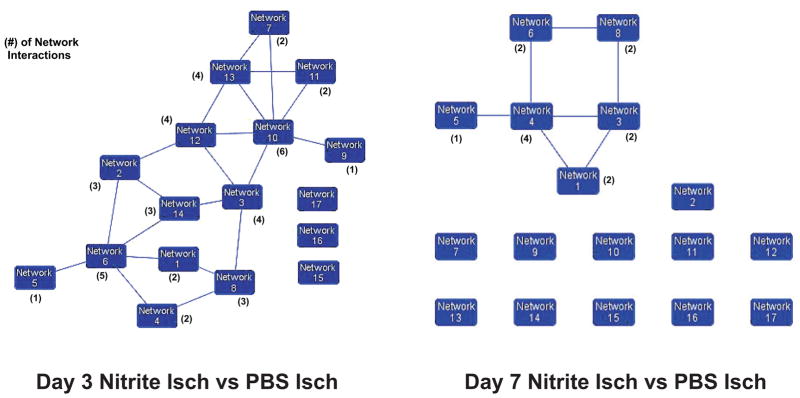
Ingenuity network analysis of day 3 and day 7 gene array data identified 17 discreet networks of genes which displayed various degrees of interrelationships (i.e. genes which influenced others in a network or that were found in more than one network). Network relationships for day 3 revealed that 14 out of 17 networks had some degree of interaction with another network with others showing a larger number of interactions. Network relationships for day 7 showed only 6 out of 17 networks had some degree of interaction with other networks. Moreover, the number of network interactions was much smaller compared to day 3.
Network functions during nitrite therapy
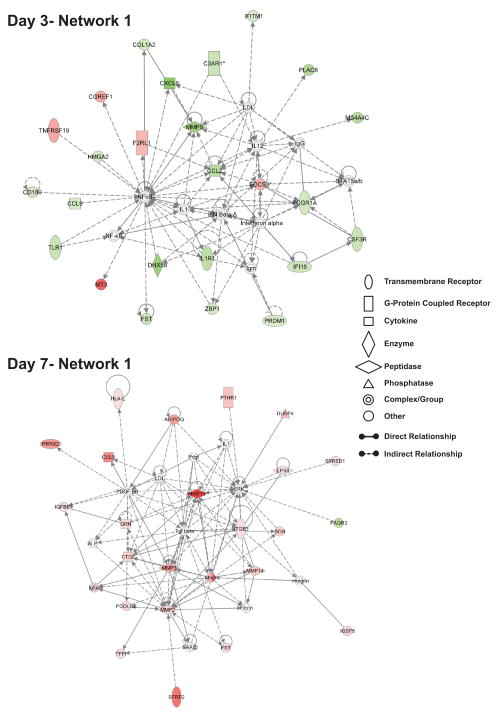
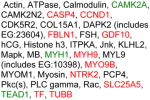
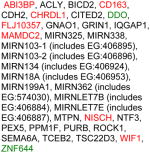
Tables 2 and 3 list all of the identified networks at day 3 and 7 which demonstrate a diversity of differential gene expression profiles. Network analysis of day 3 gene array data shows a general attenuation of early immune response related gene expression yet a significant increase in cardiovascular and skeletal muscle gene expression. Conversely, networks identified at day 7 show a predominant up-regulation of tissue remodeling and repair responses yet the number of affected genes per network is significantly reduced compared to day 3 data. Figure 3 illustrates the strongest network of gene relationships (i.e. network 1) at day 3 and 7 during sodium nitrite therapy. Panel A shows that day 3-network 1 is associated with genetic disorder, immunological disease, and organismal survival. A striking feature of this and other networks at day 3 is the number of genes which are significantly down regulated. The nature of the relationships within this network is largely indirect (i.e. the presence of hashed lines) reinforcing the notion that network analysis cannot completely reveal the effect of nitrite on ischemic tissue gene expression profiles but do identify key gene targets within a discrete biological function. This issue aside, it is clear that nitrite therapy blunts expression of numerous immunological associated genes including chemokine/cytokine ligands and receptors (e.g. CCL2, CXCL6, CCL9, IL1R1, and CSFR3), the innate immune receptor TLR-1 and the TLR homologue CD180, interferon-inducible proteins IFITM1 and IFI16, the innate immune DNA sensing protein ZBP-1, and the Fc receptor Fcgr1a. Similarly, nitrite therapy also attenuated expression of genes which influence extracellular matrix composition and function, namely MMP9 and collagen 1, alpha 2. Nitrite therapy differentially altered coagulation regulatory gene expression which contributes to both inflammation and angiogenesis responses as complement 3A receptor 1 was down-regulated while proteinase activated receptor 2 was up-regulated [17, 18]. Lastly, day 3 nitrite treated ischemic tissue showed a robust increase in metallothionine 3 gene expression.
Table 2.
Ingenuity network list of Day3
| ID | Molecules in Network | Score | Focus Molecules | U/D ratio | Top Functions |
|---|---|---|---|---|---|
| 1 |

|
44 | 25 |
|
Genetic Disorder, Immunological Disease, Organismal Survival |
| 2 |

|
41 | 24 |
|
Cellular Movement, Cellular Growth and Proliferation, Cell-To-Cell Signaling and Interaction |
| 3 |

|
36 | 22 |
|
Cardiovascular System Development and Function, Skeletal and Muscular System Development and Function, Tissue Development |
| 4 |

|
35 | 23 |
|
Cellular Development, Inflammatory Response, Lipid Metabolism |
| 5 |

|
34 | 21 |
|
Cancer, Cell Cycle, Reproductive System Disease |
| 6 |

|
32 | 20 |
|
Antigen Presentation, Cell-mediated Immune Response, Humoral Immune Response |
| 7 |

|
22 | 15 |
|
Endocrine System Disorders, Genetic Disorder, Metabolic Disease |
| 8 |

|
22 | 15 |
|
Amino Acid Metabolism, Post-Translational Modification, Small Molecule Biochemistry |
| 9 |

|
22 | 15 |
|
Drug Metabolism, Endocrine System Development and Function, Lipid Metabolism |
| 10 |

|
20 | 14 |
|
Cardiovascular System Development and Function, Tissue Morphology, Carbohydrate Metabolism |
| 11 |

|
19 | 14 |
|
Cell Cycle, DNA Replication, Recombination, and Repair, Cellular Assembly and Organization |
| 12 |

|
16 | 12 |
|
Cellular Assembly and Organization, Carbohydrate Metabolism, Molecular Transport |
| 13 |

|
14 | 11 |
|
Inflammatory Response, Neurological Disease, Cellular Development |
| 14 |

|
12 | 10 |
|
Antigen Presentation, Cell-mediated Immune Response, Humoral Immune Response |
| 15 |
|
2 | 1 |
|
|
| 16 |
|
2 | 1 |
|
Amino Acid Metabolism, Small Molecule Biochemistry |
| 17 |
|
1 | 1 |
|
Inflammatory Response, Neurological Disease, Lipid Metabolism |
Table 3.
Ingenuity network list of Day 7
| ID | Molecules in Network | Score | Focus Molecules | U/D Ratio | Top Functions |
|---|---|---|---|---|---|
| 1 |

|
44 | 23 |
|
Post-Translational Modification, Tissue Morphology, Connective Tissue Disorders |
| 2 |

|
36 | 20 |
|
Skeletal and Muscular System Development and Function, Cellular Development, Lymphoid Tissue Structure and Development |
| 3 |
|
32 | 18 |
|
Cancer, Cell Death, Endocrine System Disorders |
| 4 |

|
23 | 14 |
|
Cancer, Nervous System Development and Function, Tissue Morphology |
| 5 |

|
23 | 14 |
|
Connective Tissue Disorders, Cell Cycle, Connective Tissue Development and Function |
| 6 |
|
23 | 15 |
|
Post-Translational Modification, Infectious Disease, Cancer |
| 7 |
|
21 | 13 |
|
Cell Cycle, Endocrine System Development and Function, Cancer |
| 8 |
|
13 | 9 |
|
Genetic Disorder, Skeletal and Muscular Disorders, Cancer |
| 9 |
|
2 | 1 |
|
Nutritional Disease, Organismal Injury and Abnormalities, RNA Damage and Repair |
| 10 |
|
2 | 1 |
|
Antigen Presentation, Cancer, Carbohydrate Metabolism |
| 11 |
|
2 | 1 |
|
|
| 12 |
|
2 | 1 |
|
Cancer, Cell Morphology, Cell-To-Cell Signaling and Interaction |
| 13 |
|
2 | 1 |
|
|
| 14 |
|
2 | 1 |
|
|
| 15 |
|
2 | 1 |
|
Skeletal and Muscular System Development and Function, Hair and Skin Development and Function, Tissue Development |
| 16 |
|
2 | 1 |
|
|
| 17 |
|
2 | 1 |
|
Gene Expression, Endocrine System Development and Function, Lipid Metabolism |
Figure 3. Top ranking networks identified during nitrite therapy at day 3 and day 7.
The top network illustrates day 3 network 1 which has biological functions associated with genetic disorder, immunological disease, and organismal survival. The bottom network shows day 7 network 1 that has biological associations with post-translational modification, tissue morphology, and connective tissue disorders. Red shading indicates up-regulation whereas green shading shows down-regulation. A molecule classification legend is provided to clarify the classification of molecules involved and molecular relationships.
Network 1 result from day 7 of nitrite therapy shows that these genes are associated with regulation of post-translational modlificantion, tissue morphology, and connective tissue disorders. Both direct and indirect relationships (solid versus dashed lines) are observed by day 7 of nitrite therapy which implicates a diverse array of tissue restitution responses. Several growth factor related proteins are up-regulated including connective tissue growth factor (CTGF), granulin (GRN), integrin beta 3 (ITGB3), insulin growth factor binding protein 4 (IGFBP4), and adiponectin (ADIPOQ). Several extracellular matrix associated proteins are also up-regulated including biglycan (BGN), procollagen C-endopeptidase enhancer (PCOLCE), matrix metalloproteinases 2, 3, 13, and 14, and immunoglobulin superfamily member 8 (IGSF8). This combined expression profile suggests that nitrite therapy attenuates tissue injury and damage by altering immune responses while augmenting tissue healing programs over time.
Interrelated network relationships of nitrite therapy
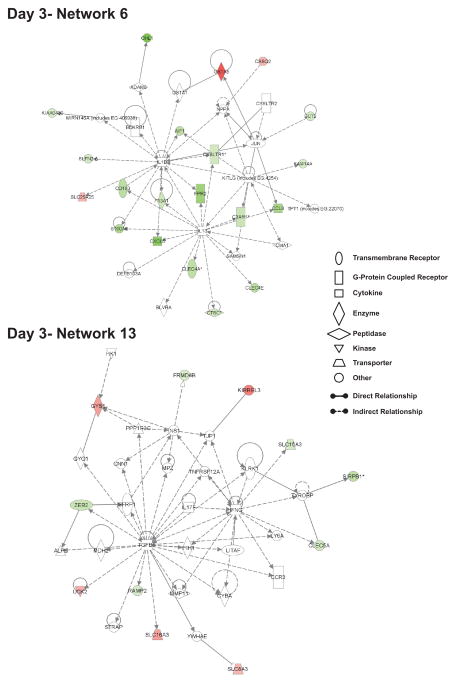
It is difficult to ascribe biological importance of one network over another for the effects of nitrite therapy; however, it is possible to infer potential significance of certain networks by the number of relationships or ‘connections’ between them. Figure 4 illustrates day 3- network 6 and 13 which have at least four connections with other networks. Network 6 functions involve antigen presentation and cell/humoral-mediated immune responses while network 13 functions encompass inflammatory responses and mediators of neurological disease. As mentioned earlier, figure 2 illustrates the number of interactions between individual networks; therefore we chose to examine networks with multiple connections which are indicative of a high degree of relationships. Figure 4 illustrates network 6 and 13 from day 3 nitrite therapy. Day 3 network 6 top functions relate to antigen presentation and cell mediated and humoral immune responses. Numerous immune regulatory genes are significantly down regulated including C-type lectin domain family 4, members A and E, allograft inflammatory factor 1, formyl peptide receptor 2, cysteinyl leukotriene receptor 1, the cysteine proteinase inhibitor Cathepsin C, and CD163 macrophage scavenger receptor. Similarly, genes associated with day 3 network 13 are involved in inflammatory responses as well as neurological diseases, and cellular development. Genes that influence immune function include C-type lectin domain family 5 member A which influences immune cell adhesion and signal regulatory protein beta 1 that modulates tyrosine kinase signaling involving immunotyrosine activating motifs. Interestingly, several solute carrier family members involved in cell development and homeostasis are differentially regulated as solute carrier family 16 member 3 and 8 member 3 are up-regulated versus solute carrier family 15 member 3 which is down-regulated. Lastly, uridine-cytidine kinase 2 is significantly up-regulated suggesting increased pyrimidine nucleoside triphosphate production which is necessary for DNA/RNA synthesis.
Figure 4. Highly interrelated networks affecting immune responses at day 3.
The top network illustrates day 3 network 6 which has 5 interactions with other networks and has biological functions associated with antigen presentation, cell-mediated immune response, and humoral mediated immune response. The bottom network shows day 3 network 13 that has 4 interactions with other networks and its biological functions are associated with inflammatory responses, neurological disease, and cellular development. Red shading indicates up-regulation whereas green shading illustrates down-regulation. A molecule classification legend is provided to clarify the classification of molecules involved and molecular relationships.
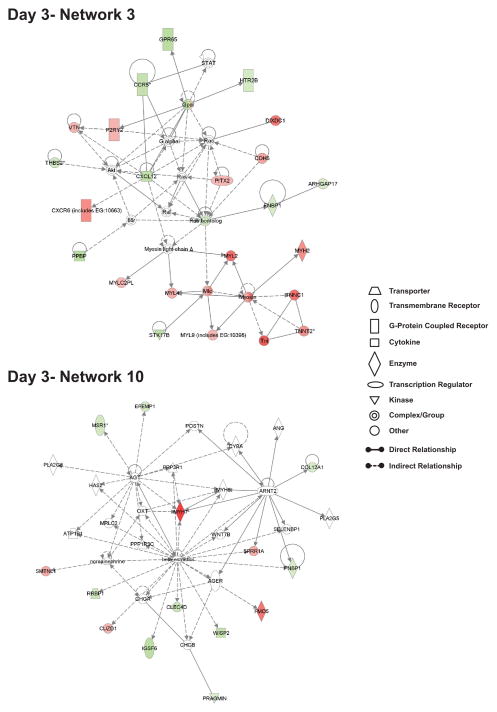
Figure 5 illustrates gene expression profiles of day 3 network 3 and day 3 network 10 which are associated with cardiovascular system development and function, skeletal muscle system development and function, and changes in tissue morphology, respectively. Suprisingly, day 3 network 3 is the only network in which there was a preferential up-regulation of gene expression versus other networks which showed predominant down-regulation of gene expression. Genes within day 3 network 3 are associated with cardiovascular system development and function which include up regulation of the potential pro-angiogenic mediators vascular endothelial cell cadherin (VE-cadherin), purinergic receptor P2Y, and vitronectin, as well as down regulation of anti-angiogenic and vasoregulatory molecules thrombospondin-2 and the serotonin receptor 2B [19–27]. Numerous myocyte specific genes are also significantly up-regulated including myosin heavy and light chain 2, myosin light chain 4 and 9, troponin I, and troponin T type 2 indicating alteration of muscle cell function and possibly development. Lastly, several dual purpose angiogenic and inflammatory mediators are also significantly down-regulated including CXCL7, CXCR6, and stromal derived factor-1/CXCL12 suggesting that nitrite therapy augments physiological versus pathological angiogenesis responses [28]. Genes contained within day 3 network 10 included several inflammatory associated genes which were down-regulated including macrophage scavenger receptor-1 (MSR-1), C-type lectin domain family 4 member D, immunoglobulin superfamily member 6, and Wnt inducible signaling protein 2 (WISP2) [29–33]. Conversely, genes associated with myocyte function were up-regulated including myosin heavy chain 7 and smoothelin-like 1 which modulates myosin phosphatase activity governing contractile responses [34, 35]. Together, these two networks illustrate that nitrite therapy distinctly augments gene expression profiles associated with vascular system development (i.e. angiogenesis) while decreasing inflammatory molecule gene expression.
Figure 5. Highly interrelated networks affecting cardiovascular and muscle system functions at day 3.
The top network shows day 3 network 3 which has 4 interactions with other networks and its biological functions are associated with cardiovascular system development and function, skeletal and muscular system development and function, and tissue development. The bottom network illustrates day 3 network 10 that has 6 interactions with other networks and has biological functions associated with cardiovascular system development and function, tissue morphology, and carbohydrate metabolism. Red shading indicates up-regulation whereas green shading illustrates down-regulation. A molecule classification legend is provided to clarify the classification of molecules involved and molecular relationships.
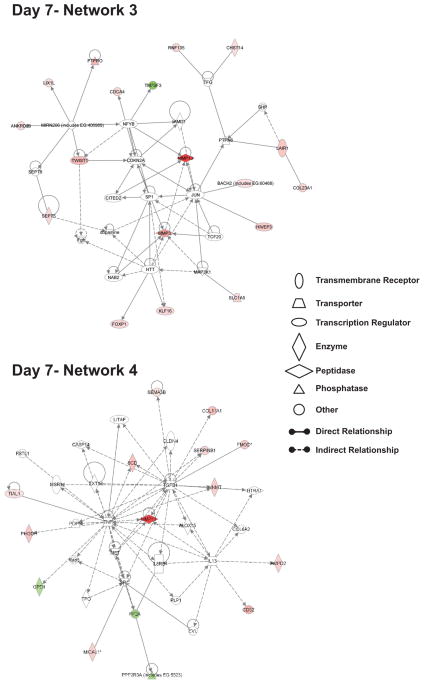
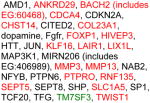
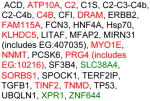
Figure 6 demonstrates network 3 and 4 associations of nitrite induced changes in gene expression at day 7. Top cellular functions of networks 3 and 4 relate to cancer, cell death, nervous system development, and endocrine system disorders representing a seemingly odd array of responses. However, closer examination of the identified genes reveals interesting and logical associations such as increased expression of transcription factors involved in cell fate determination and healing responses such as FoxP1, KLF16, and TWIST1 suggesting nitrite therapy could act to augment repair responses and possibly augment cell fate determination of resident stem cell populations [36–39]. Nitrite therapy also augments expression of proteins involved in attenuating cell activation responses such as protein tyrosine phosphatase receptor type O and leukocyte associated immunoglobulin-like receptor 1 (LAIR1) which both negatively regulate cellular activation responses [40–42]. Genes found in day 7 network 4 also influence tissue remodeling as regulators of proteolysis including MMP13 and SERPINB1 are elevated. The anti-angiogenic molecules semaphroin 3B (sema3B) and thrombospondin-1 are up-regulated at this time point suggesting induction of negative feedback loops governing vascular growth [43, 44]. Lastly, genes governing cellular metabolism are also significantly elevated including 3-phosphoglycerate dehydrogenase which is essential for de novo serine biosynthesis and stearoyl-CoA desaturase that catalyzes the formation of oleic acid via desaturation of stearic acid [45]. These molecules play important roles in modulating cellular metabolism of neurological and muscle function which could also influence the formation of other nitric oxide related species such as nitro-fatty acids [46].
Figure 6. Highly related networks affecting multiple cell responses and tissue morphology at day 7.
The top network illustrates day 7 network 3 which has 2 interactions with other networks and is associated with biological functions involving cancer, cell death, and endocrine system disorders. The bottom network shows day 7 network 4 that has 4 interactions with other networks and has biological functions associated with cancer, nervous system development and function, and tissue morphology. Red shading indicates up-regulation whereas green shading illustrates down-regulation. A molecule classification legend is provided to clarify the classification of molecules involved and molecular relationships.
Discussion
The utility of nitrite anion therapy for attenuating numerous ischemic tissue disorders is now well appreciated. However, molecular mechanisms mediating nitrite dependent effects on tissue preservation and restoration of homeostasis still remain largely unknown. Here we employed genome wide expression profiling techniques using the Affymetrrix 430 2.0 mouse GeneChip which contains a highly comprehensive and annotated representation of the whole mouse genome with slightly greater than 39,000 transcripts evaluated per array. With such comprehensive coverage of genome expression profiles, we were able to broadly survey for nitrite induced alterations of genome wide changes in expression patterns. To our knowledge, this is the first report of such wide scale genome analysis of nitrite therapy under chronic ischemic settings. A recent report by Raat et al used a similar approach with the same Affymetrix GeneChip 430 2.0 array to determine genome expression changes in response to dietary nitrite supplementation during acute liver ischemia-reperfusion injury [47]. Data generated from the Raat et al study identified 144 different genes which were significantly altered with 83 being up-regulated and 61 down-regulated using a fold change cut off value of 1.5 compared to 457 different genes at day 3 post-ischemia and 274 genes at day 7post-ischemia using a fold change cut off value of 2 in our current study. The differences between our current study and that of Raat et al likely involves altered delivery routes (i.e. intraperitoneal injection versus oral administration in the drinking water) as well as tissue specific differences (i.e. muscle versus liver).
There are a few interesting similarities as well as distinct differences between our current data and that of Raat et al [47]. Firstly, dietary nitrite therapy altered carbohydrate metabolism during liver acute I/R as did i.p. nitrite therapy at day 3 of chronic ischemia. Nitrite therapy also similarly affected solute carrier family proteins in acute I/R and day 3 chronic ischemia with different solute carrier family molecules involved in either response. Secondly, nitrite therapy appears to preferentially augment overall gene expression during acute I/R as Raat et al reported more up-regulated genes than down; whereas, our findings suggest that nitrite therapy during chronic ischemia results in an initial down-regulation of the majority of genes identified at day 3 followed by up-regulation of fewer genes at day 7. Differences between ours and the previous study could be due to the duration of ischemic event (acute with reperfusion versus permanent with no reperfusion). These discrepancies aside, our data are consistent with a previous report by Braam et al demonstrating that nitric oxide donor treatment of endothelial cells results in a temporal and dose-dependent decrease in gene expression which is consistent with our current observations and that of our previous work demonstrating that nitrite restores ischemic tissue perfusion in a NO dependent manner [13, 48]. Our data together with Raat et al suggest that nitrite therapy exerts significant effects on genome expression profiles which are undoubtedly influenced by the duration of ischemia and tissues examined.
The combined use of traditional heat map gene array analysis and KEGG pathway analysis coupled with Ingenuity network analysis provided a comprehensive and illuminating picture of what biological processes may be targeted by nitrite anion therapy during chronic hind limb ischemia. So what then can we conclude regarding the biological effects of nitrite therapy for restoration of chronically ischemic tissue perfusion? Our data unexpectedly revealed that nitrite therapy inhibits gene expression in a dominant fashion at day 3 of ischemia which involved several important biological networks such as immunological disease, cell and humoral mediated immunity, antigen presentation, cancer, cell signaling and cycle, lipid metabolism, and endocrine system disorders. However, of the minority of genes which were up-regulated, they centered squarely on cardiovascular and muscular system development and function with clear up-regulation of pro-angiogenic genes (e.g. VE-cadherin, vitronectin, purinergic receptor PY2) and down-regulation of anti-angiogenic and vasoregulatory genes (e.g. thrombospondin 2 and serotonin receptor 2B) along with induction of myocyte functional responses (e.g. myosin heavy and light chains and troponin T and I). While it is impossible to truly infer precise mechanisms of nitrite action from these data, it does appear that nitrite therapy may serve to blunt inflammatory responses while enhancing vascular and muscle growth or repair.
Consistent with the idea that nitrite could be facilitating tissue healing and repair, network data from day 7 revealed that a fewer number of genes were affected and they were all predominantly up-regulated. Restoration of tissue metabolism and homeostasis is likely the key goal at this time point as several anti-angiogenic mediators were significantly up-regulated (e.g. semaphorin 3B and thrombospondin-1) as well as transcriptional regulators of tissue differentiation (e.g. Twist-1 and FoxP1). These expression patterns and networks are consistent with the observation that ischemic tissue perfusion is restored back to pre-ischemic levels at that time and may represent a shift toward a more homeostatic form of gene expression. However, additional studies are needed to better understand the prolonged effects of nitrite therapy after resolution of tissue ischemia.
In summary, we have presented data showing that sodium nitrite therapy elicits a robust change in gene expression profiles at both early and later time points of chronic ischemia which appear to be directly related with restoring tissue reperfusion and stimulating repair responses. These data reveal novel and interesting networks of biological function which have not been previously considered for correcting chronic ischemic tissue dysfunction. Future studies directly probing the biological roles of these mediators during chronic ischemic injury will likely reveal unique molecular mechanisms necessary for establishing reperfusion of tissues experiencing permanent or intermittent ischemic stress.
Supplementary Material
Acknowledgments
This work was supported by NIH grants HL80482 and DK43785 to C.G.K and HL94021 to C.B.P.
Footnotes
Publisher's Disclaimer: This is a PDF file of an unedited manuscript that has been accepted for publication. As a service to our customers we are providing this early version of the manuscript. The manuscript will undergo copyediting, typesetting, and review of the resulting proof before it is published in its final citable form. Please note that during the production process errors may be discovered which could affect the content, and all legal disclaimers that apply to the journal pertain.
References
- 1.Gladwin MT, Kim-Shapiro DB. Blood. 2008;112:2636–47. doi: 10.1182/blood-2008-01-115261. [DOI] [PMC free article] [PubMed] [Google Scholar]
- 2.Hendgen-Cotta UB, Merx MW, Shiva S, Schmitz J, Becher S, Klare JP, Steinhoff HJ, Goedecke A, Schrader J, Gladwin MT, Kelm M, Rassaf T. Proc Natl Acad Sci U S A. 2008;105:10256–61. doi: 10.1073/pnas.0801336105. [DOI] [PMC free article] [PubMed] [Google Scholar]
- 3.Samouilov A, Kuppusamy P, Zweier JL. Arch Biochem Biophys. 1998;357:1–7. doi: 10.1006/abbi.1998.0785. [DOI] [PubMed] [Google Scholar]
- 4.Castello PR, David PS, McClure T, Crook Z, Poyton RO. Cell Metab. 2006;3:277–87. doi: 10.1016/j.cmet.2006.02.011. [DOI] [PubMed] [Google Scholar]
- 5.Millar TM, Stevens CR, Benjamin N, Eisenthal R, Harrison R, Blake DR. FEBS Lett. 1998;427:225–8. doi: 10.1016/s0014-5793(98)00430-x. [DOI] [PubMed] [Google Scholar]
- 6.Vanin AF, Bevers LM, Slama-Schwok A, van Faassen EE. Cell Mol Life Sci. 2007;64:96–103. doi: 10.1007/s00018-006-6374-2. [DOI] [PMC free article] [PubMed] [Google Scholar]
- 7.Duranski MR, Greer JJ, Dejam A, Jaganmohan S, Hogg N, Langston W, Patel RP, Yet SF, Wang X, Kevil CG, Gladwin MT, Lefer DJ. J Clin Invest. 2005;115:1232–40. doi: 10.1172/JCI22493. [DOI] [PMC free article] [PubMed] [Google Scholar]
- 8.Jung KH, Chu K, Ko SY, Lee ST, Sinn DI, Park DK, Kim JM, Song EC, Kim M, Roh JK. Stroke. 2006;37:2744–50. doi: 10.1161/01.STR.0000245116.40163.1c. [DOI] [PubMed] [Google Scholar]
- 9.Pluta RM, Oldfield EH. Surg Neurol. 2006;66:5–7. doi: 10.1016/j.surneu.2005.10.017. discussion 8–10. [DOI] [PubMed] [Google Scholar]
- 10.Calvert JW, Lefer DJ. Cardiovasc Res. 2009;83:195–203. doi: 10.1093/cvr/cvp079. [DOI] [PMC free article] [PubMed] [Google Scholar]
- 11.Gonzalez FM, Shiva S, Vincent PS, Ringwood LA, Hsu LY, Hon YY, Aletras AH, Cannon RO, 3rd, Gladwin MT, Arai AE. Circulation. 2008;117:2986–94. doi: 10.1161/CIRCULATIONAHA.107.748814. [DOI] [PMC free article] [PubMed] [Google Scholar]
- 12.Stokes KY, Dugas TR, Tang Y, Garg H, Guidry E, Bryan NS. Am J Physiol Heart Circ Physiol. 2009;296:H1281–8. doi: 10.1152/ajpheart.01291.2008. [DOI] [PubMed] [Google Scholar]
- 13.Kumar D, Branch BG, Pattillo CB, Hood J, Thoma S, Simpson S, Illum S, Arora N, Chidlow JH, Jr, Langston W, Teng X, Lefer DJ, Patel RP, Kevil CG. Proc Natl Acad Sci U S A. 2008;105:7540–5. doi: 10.1073/pnas.0711480105. [DOI] [PMC free article] [PubMed] [Google Scholar]
- 14.Isenberg JS, Shiva S, Gladwin M. Nitric Oxide. 2009;21:52–62. doi: 10.1016/j.niox.2009.05.005. [DOI] [PMC free article] [PubMed] [Google Scholar]
- 15.Senthilkumar A, Smith RD, Khitha J, Arora N, Veerareddy S, Langston W, Chidlow JH, Jr, Barlow SC, Teng X, Patel RP, Lefer DJ, Kevil CG. Arterioscler Thromb Vasc Biol. 2007;27:1947–54. doi: 10.1161/ATVBAHA.107.147421. [DOI] [PubMed] [Google Scholar]
- 16.Kevil CG, Patel RP. Expert Rev Cardiovasc Ther. 2008;6:1175–9. doi: 10.1586/14779072.6.9.1175. [DOI] [PMC free article] [PubMed] [Google Scholar]
- 17.Grond-Ginsbach C, Hummel M, Wiest T, Horstmann S, Pfleger K, Hergenhahn M, Hollstein M, Mansmann U, Grau AJ, Wagner S. J Neurol. 2008;255:723–31. doi: 10.1007/s00415-008-0784-z. [DOI] [PubMed] [Google Scholar]
- 18.Uusitalo-Jarvinen H, Kurokawa T, Mueller BM, Andrade-Gordon P, Friedlander M, Ruf W. Arterioscler Thromb Vasc Biol. 2007;27:1456–62. doi: 10.1161/ATVBAHA.107.142539. [DOI] [PubMed] [Google Scholar]
- 19.Vestweber D. Arterioscler Thromb Vasc Biol. 2008;28:223–32. doi: 10.1161/ATVBAHA.107.158014. [DOI] [PubMed] [Google Scholar]
- 20.Wallez Y, Huber P. Biochim Biophys Acta. 2008;1778:794–809. doi: 10.1016/j.bbamem.2007.09.003. [DOI] [PubMed] [Google Scholar]
- 21.Kaczmarek E, Erb L, Koziak K, Jarzyna R, Wink MR, Guckelberger O, Blusztajn JK, Trinkaus-Randall V, Weisman GA, Robson SC. Thromb Haemost. 2005;93:735–42. doi: 10.1267/THRO05040735. [DOI] [PMC free article] [PubMed] [Google Scholar]
- 22.Schvartz I, Seger D, Shaltiel S. Int J Biochem Cell Biol. 1999;31:539–44. doi: 10.1016/s1357-2725(99)00005-9. [DOI] [PubMed] [Google Scholar]
- 23.Silva R, D’Amico G, Hodivala-Dilke KM, Reynolds LE. Arterioscler Thromb Vasc Biol. 2008;28:1703–13. doi: 10.1161/ATVBAHA.108.172015. [DOI] [PubMed] [Google Scholar]
- 24.Daniel C, Amann K, Hohenstein B, Bornstein P, Hugo C. J Am Soc Nephrol. 2007;18:788–98. doi: 10.1681/ASN.2006080873. [DOI] [PubMed] [Google Scholar]
- 25.Krady MM, Zeng J, Yu J, MacLauchlan S, Skokos EA, Tian W, Bornstein P, Sessa WC, Kyriakides TR. Am J Pathol. 2008;173:879–91. doi: 10.2353/ajpath.2008.080128. [DOI] [PMC free article] [PubMed] [Google Scholar]
- 26.Maclauchlan S, Skokos EA, Agah A, Zeng J, Tian W, Davidson JM, Bornstein P, Kyriakides TR. J Histochem Cytochem. 2009;57:301–13. doi: 10.1369/jhc.2008.952689. [DOI] [PMC free article] [PubMed] [Google Scholar]
- 27.Asada M, Ebihara S, Yamanda S, Niu K, Okazaki T, Sora I, Arai H. Neoplasia. 2009;11:408–17. doi: 10.1593/neo.81630. [DOI] [PMC free article] [PubMed] [Google Scholar]
- 28.Chidlow JH, Jr, Shukla D, Grisham MB, Kevil CG. Am J Physiol Gastrointest Liver Physiol. 2007;293:G5–G18. doi: 10.1152/ajpgi.00107.2007. [DOI] [PubMed] [Google Scholar]
- 29.Beamer CA, Holian A. Am J Physiol Lung Cell Mol Physiol. 2005;289:L186–95. doi: 10.1152/ajplung.00474.2004. [DOI] [PubMed] [Google Scholar]
- 30.Fulton WB, Reeves RH, Takeya M, De Maio A. J Immunol. 2006;176:3767–73. doi: 10.4049/jimmunol.176.6.3767. [DOI] [PubMed] [Google Scholar]
- 31.Kitaya K, Yasuo T, Yamaguchi T, Fushiki S, Honjo H. Int J Mol Med. 2007;20:689–97. [PubMed] [Google Scholar]
- 32.Kobayashi Y, Miyaji C, Watanabe H, Umezu H, Hasegawa G, Abo T, Arakawa M, Kamata N, Suzuki H, Kodama T, Naito M. J Pathol. 2000;192:263–72. doi: 10.1002/1096-9896(2000)9999:9999<::AID-PATH692>3.0.CO;2-U. [DOI] [PubMed] [Google Scholar]
- 33.Tanaka I, Morikawa M, Okuse T, Shirakawa M, Imai K. Biochem Biophys Res Commun. 2005;334:973–8. doi: 10.1016/j.bbrc.2005.06.196. [DOI] [PubMed] [Google Scholar]
- 34.Borman MA, Freed TA, Haystead TA, Macdonald JA. Mol Cell Biochem. 2009;327:93–100. doi: 10.1007/s11010-009-0047-z. [DOI] [PMC free article] [PubMed] [Google Scholar]
- 35.Wooldridge AA, Fortner CN, Lontay B, Akimoto T, Neppl RL, Facemire C, Datto MB, Kwon A, McCook E, Li P, Wang S, Thresher RJ, Miller SE, Perriard JC, Gavin TP, Hickner RC, Coffman TM, Somlyo AV, Yan Z, Haystead TA. J Biol Chem. 2008;283:11850–9. doi: 10.1074/jbc.M708628200. [DOI] [PMC free article] [PubMed] [Google Scholar]
- 36.Katoh M, Katoh M. Int J Oncol. 2004;25:1495–500. [PubMed] [Google Scholar]
- 37.Wang B, Weidenfeld J, Lu M, Maika S, Kuziel W, Morrisey E, Tucker P. Development. 2004;131:4477–87. doi: 10.1242/dev.01287. [DOI] [PubMed] [Google Scholar]
- 38.Barvencik F, Gebauer M, Schinke T, Amling M. Clin Orthop Relat Res. 2008;466:990–6. doi: 10.1007/s11999-008-0123-9. [DOI] [PMC free article] [PubMed] [Google Scholar]
- 39.Firulli AB, Conway SJ. Curr Med Chem. 2008;15:2641–7. doi: 10.2174/092986708785908987. [DOI] [PMC free article] [PubMed] [Google Scholar]
- 40.Motiwala T, Majumder S, Ghoshal K, Kutay H, Datta J, Roy S, Lucas DM, Jacob ST. J Biol Chem. 2009;284:455–64. doi: 10.1074/jbc.M802840200. [DOI] [PMC free article] [PubMed] [Google Scholar] [Retracted]
- 41.Xu X, Hong Y, Kong C, Xu L, Tan J, Liang Q, Huang B, Lu J. FEBS Lett. 2008;582:2850–6. doi: 10.1016/j.febslet.2008.07.017. [DOI] [PubMed] [Google Scholar]
- 42.Meyaard L. J Leukoc Biol. 2008;83:799–803. doi: 10.1189/jlb.0907609. [DOI] [PubMed] [Google Scholar]
- 43.Isenberg JS, Martin-Manso G, Maxhimer JB, Roberts DD. Nat Rev Cancer. 2009;9:182–94. doi: 10.1038/nrc2561. [DOI] [PMC free article] [PubMed] [Google Scholar]
- 44.Varshavsky A, Kessler O, Abramovitch S, Kigel B, Zaffryar S, Akiri G, Neufeld G. Cancer Res. 2008;68:6922–31. doi: 10.1158/0008-5472.CAN-07-5408. [DOI] [PubMed] [Google Scholar]
- 45.Peter A, Weigert C, Staiger H, Machicao F, Schick F, Machann J, Stefan N, Thamer C, Haring HU, Schleicher E. Diabetes. 2009;58:1757–65. doi: 10.2337/db09-0188. [DOI] [PMC free article] [PubMed] [Google Scholar]
- 46.Baker PR, Schopfer FJ, O’Donnell VB, Freeman BA. Free Radic Biol Med. 2009;46:989–1003. doi: 10.1016/j.freeradbiomed.2008.11.021. [DOI] [PMC free article] [PubMed] [Google Scholar]
- 47.Raat NJ, Noguchi AC, Liu VB, Raghavachari N, Liu D, Xu X, Shiva S, Munson PJ, Gladwin MT. Free Radic Biol Med. 2009;47:510–7. doi: 10.1016/j.freeradbiomed.2009.05.015. [DOI] [PMC free article] [PubMed] [Google Scholar]
- 48.Braam B, de Roos R, Dijk A, Boer P, Post JA, Kemmeren PP, Holstege FC, Bluysen HA, Koomans HA. Am J Physiol Heart Circ Physiol. 2004;287:H1977–86. doi: 10.1152/ajpheart.00323.2004. [DOI] [PubMed] [Google Scholar]
Associated Data
This section collects any data citations, data availability statements, or supplementary materials included in this article.


