Abstract
Molecular dynamics (MD) simulation methods have seen significant improvement since their inception in the late 1950s. Constraints of simulation size and duration that once impeded the field have lessened with the advent of better algorithms, faster processors, and parallel computing. With newer techniques and hardware available, MD simulations of more biologically relevant timescales can now sample a broader range of conformational and dynamical changes including rare events. One concern in the literature has been under which circumstances it is sufficient to perform many shorter timescale simulations and under which circumstances fewer longer simulations are necessary. Herein, our simulations of the zinc finger NEMO (2JVX) using multiple simulations of length 15, 30, 1000, and 3000 ns are analyzed to provide clarity on this point.
Keywords: NEMO, zinc finger, molecular dynamics
1. Introduction
The ability to use computer models to build an atomistic picture of biomolecules helps tackle a variety of problems ranging from drug discovery to model development for protein folding mechanisms. The importance of these models was illustrated by the awarding of the 2013 Nobel Prize in Chemistry to three pioneers in the field. While great strides have been made in the viability of MD since their inception in the late 1950s (Alder & Wainwright, 1959), it is still essential to verify that the computer simulations are the best possible representation of the physical, in vivo, situation. Here, we highlight why, even for a small metal-binding protein, long-time-scale simulations are beneficial to understanding the zinc finger motif.
The protein of interest, the zinc finger domain of NEMO (nuclear factor-kappa B essential modulator) has three cysteines and a single histidine coordinating the zinc ion, and is significant in the canonical NF-κB signaling pathway. The crystal structure has a beta–beta– alpha motif determined by NMR with label 2JVX in the Protein Data Bank (Cordier, Vinolo, Véron, Delepierre, & Agou, 2008). NEMO has been shown relevant to immune responses, oncogenesis, and apoptosis (Cordier et al., 2009), and mutations of NEMO on the X chromosome have been linked to human diseases such as incontinentia pigmenti (Martinez-Pomar et al., 2005). Generally, the NF-κB signaling pathway has many implications for many human diseases, and the regulation mechanisms of NEMO are not well understood (Courtois & Gilmore, 2006; Courtois & Smahi, 2006; Pasparakis, 2008). As such, this model system has biomedical interest, in addition to being a small metal–protein system for our purposes.
Previous publications suggest that convergence of nanosecond-scale simulations point to statistically significant conformations (Amadei, Ceruso, & Di Nola, 1999). While these simulations converge nicely, the limited timescale may inhibit access to local minima aside from that directly accessible to the crystallo-graphic structure. Folding, assembly, and diffusion processes, for example, require longer timescales to probe protein behavior and subsequent novel conformations may provide insight to a variety of protein mechanisms (Negureanu & Salsbury, 2012a, 2012b). The data here suggest that convergence can still be attained when extending to microseconds and include a much larger sampling of conformation space.
The timescales sampled for even modest-sized protein and RNA/DNA structures via conventional serial CPU simulations are insufficient to probe many biologically significant processes (Rueda et al., 2007). For example, events such as folding and docking can take micro- and milliseconds to occur. Computing with GPUs, on the other hand, provides reasonable access to longer timescales – at least in the microsecond range. Even a small 423-atom (including the bound zinc ion) 28-residue protein indicates that there are significant conformational changes that appear in long simulations that are not present in shorter simulations of equal sampling. While this would not be surprising for a large protein complex, it is surprising for such a small system. Even a tiny monomer like this zinc finger samples unique conformational space when simulations are extended out to the microsecond range.
2. Methods
Computational improvements such as parallelization across the multiple GPU processors that are contained within a single GPU core have recently made microsecond-scale simulations more accessible. For comparison, the same protein was simulated on a Ethernet, quad-core CPU system running at 2.4 GHz (timing runs showed negligible time savings with more processors) and a single GPU core with explicit TIP3P waters (Jorgensen, Chandrasekhar, Madura, Impey, & Klein, 1983). Additional GPU speed up was provided by hydrogen mass repartitioning requiring increased time steps to 4 fs (Harvey, Giupponi, & Fabritiis, 2009).
All simulations were run at 300 K with the solvent ionized to .15 mol/L concentrations of Na+ and Cl−. The GPU system requires a cubic water box causing the significant increase in the number of waters. Despite having nearly twice the number of simulation atoms, the speed increase on the GPU is significant as shown in Table 1. All GPU computations were performed on Metrocubo workstations from Acellera on Titan GPUs; the 3 μs simulations were performed on newer, faster Metrocubo workstations. The CPU-based simulations were performed on the DEAC cluster at Wake Forest University.
Table 1.
Computation comparison.
| Trajectory | Number of atoms | Platform | Save rates (ps) | Wall time (d) | Average speed (ns/day) | Number of simulations |
|---|---|---|---|---|---|---|
| CPU (15 ns) | 6545 | NAMD | 1 | 3.8 | 3.95 | 20 |
| CPU (30 ns) | 6545 | NAMD | 1 | 7.22 | 4.15 | 10 |
| GPU (1 μs) | 11,479 | ACEMD | 10 | 5.71 | 175 | 5 |
| GPU (3 μs) | 11,479 | ACEMD | 10 | 13.4 | 224 | 5 |
Raw sampling in each simulation space was different between the CPU and GPU trajectories, but all simulations were trimmed so that sample size, not the sampling rate, is consistent between all data. For the nanosecond simulations, this means steps of 500 ps for the 15 and 30 ns simulations, 4 ns for the 1 μs simulation, and 12 ns for the 3 μs simulation.
All simulations assumed rigid bonds to hydrogen atoms employing the CHARMM 22 force field with a patch to deprotonate the cysteines that coordinate the bound zinc ion (Lee, Salsbury, & Brooks, 2004). The CPU NAMD simulations used Langevin damping for pressure and temperature control using NAMD defaults. The GPU ACEMD simulations used Langevin damping for temperature control and Berendsen pressure with default parameters. Long-range electrostatics was calculated using a particle mesh Ewald implementation (Harvey & De Fabritiis, 2009).
3. Results
Although nanosecond-scale simulations have shown great success in studying the conformational dynamics of proteins and protein complexes (Negureanu & Salsbury, 2012b, 2014), results of short timescales can be incomplete as the sampling may not address rare conformations that are simply inaccessible on the nanoscale. Findings presented here support that longer timescale simulations likely sample more of the available free energy landscape. Namely, on longer timescales, NEMO is not as rigid when compared to shorter simulations, suggesting that there are indeed regions about the global minima, and perhaps other excited wells, that are being sampled. Many shorter simulations give different results than a single or a few longer simulations. Short simulations readily give details about the main behavior of the protein, whereas long simulations additionally include more excited states. These less common but stable conformations available in microseconds could play be a mechanism significant to biological function such as molecular recognition (Boehr, Nussinov, & Wright, 2009).
We hypothesize that the rarer fluctuations offered in microseconds could be associated with binding events and that the conformational states available are regulated by the presence of zinc. The activation and deactivation of binding capacity of the zinc-binding domain may vary in the presence and absence of zinc, respectively. These rare fluctuations could allow for binding of zinc or protein–-protein interactions, with ubiquitin, for example Cordier et al. (2009).
3.1. RMSF indicates greater flexibility in longer time simulations
The change in protein backbone fluctuations (Figure 1) is consistent with the idea that microsecond simulations sample a greater region of conformational space evidenced by the larger RMS fluctuation. The standard error for the various trajectories is shown, indicating that these are not likely to be chance events.
Figure 1.
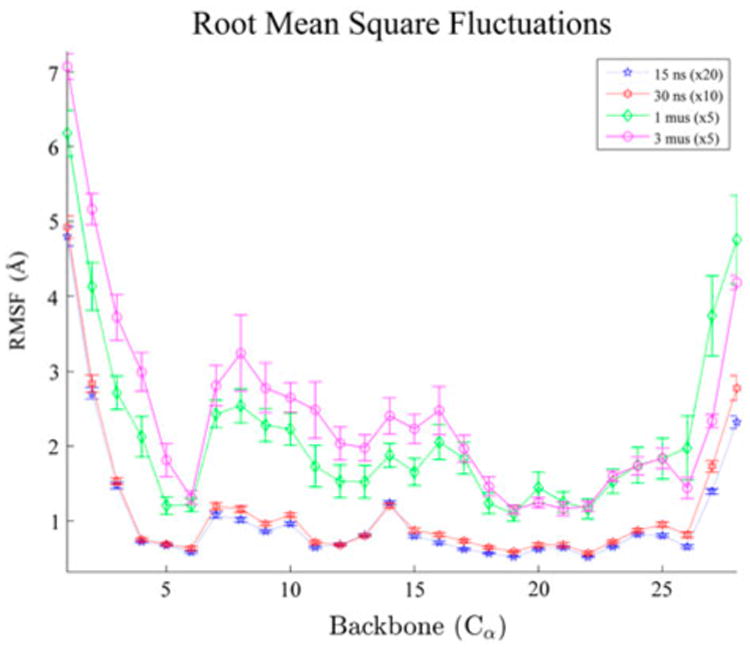
Alpha-carbon root-mean-square fluctuations (RMSF).
Notes: The RMSF in angstroms of the alpha carbons of NEMO. The nanosecond duration data show less fluctuations at all CA than the microsecond simulations. Large fluctuations show significant deviation near the beta sheet zinc-binding cysteines. The standard error of each simulation is shown and general agreement is shown between the two time regimes.
The most significant difference between the timescales occurs between residues 6 and 16, with the most pronounced area from 6 to 10. Residues 6 and 9 are zinc-binding cysteines on beta sheets separated by a turn. While the bound zinc may be accentuating these larger fluctuations as the binding site alpha carbons have higher fluctuations on average, it is clear that, in general, the protein fluctuations are larger in the long simulations. The RMS fluctuations of the simulations compared to one another show that, despite having the same initial conformation, the longer timescale simulations show greater fluctuations overall.
3.2. Clustering analysis distinguishes short from long timescales
Clustering results vary across the four different time-scales. A quality threshold implementation of clustering built-in to visual molecular dynamics (VMD's) measure command (Heyer, 1999) was used to complete the clustering analysis. An RMSF cut-off distance of 2.2 Å ring was chosen by examining all samples, both together and separate, to find where there was most often the fewest number of unclustered structures for alpha carbons, for example, the point that maximized the clustering of the structures. Structures are clustered based on alpha-carbon RMS distance as compared to the crystal structure, and limited to 50 clusters, with the 51st cluster containing all single-member clusters.
Clustering all of the trajectories concatenated (Figure 2) shows that the long timescales probe a configuration space not evident in the nanosecond regime. All 100,000 frames are included in the clustering analysis of the alpha carbons of NEMO, highlighting changes of the protein backbone. The red vertical lines differentiate time-scales, each 25,000 frames, and the green vertical lines differentiate individual trajectories. The trajectories are ordered by ascending simulation length. The effective step size of each frame varies for the sampled data. Namely, the 15 and 30 ns simulations have a clustering step size of 500 ps, the 1 μs simulations 4 ns, and the 3 μs simulations 12 ns . This clustering shows that there are low-order, novel clusters only appearing in longer simulations. The last 1 μs simulation and the last 3 μs simulation are responsible for the second most populated cluster.
Figure 2.
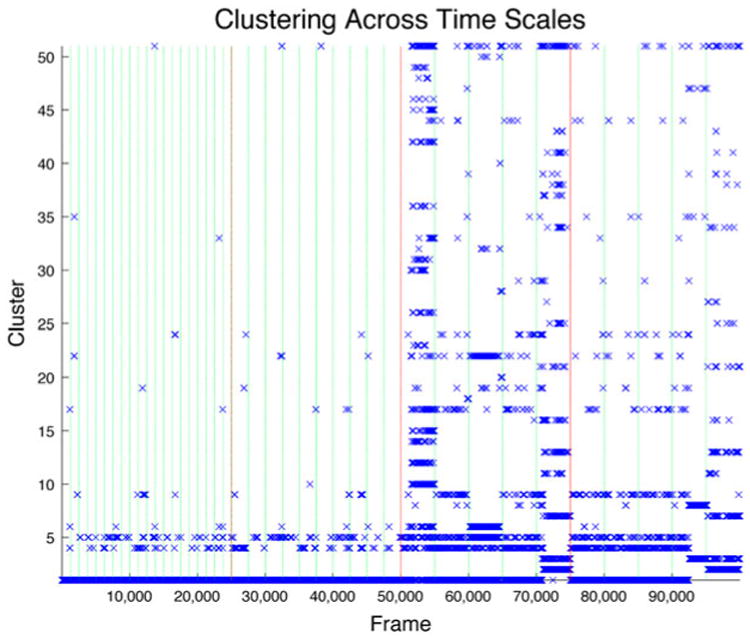
Clustering across trajectories.
Notes: Clustering of all timescales sampling 25,000 frames of each duration. A cut-off of 2.2 Å ring; applied to RMSD clustering with 50 clusters and the 51st representing unclustered populations. Red vertical lines differentiate timescales and green lines differentiate individual trajectories. Few unclustered structures appear in the short simulations, with many in the longer simulations. Unique, stable structures, clusters 2 and 3, appear only in the long-timescale simulations as well.
These structures, despite only occurring in two of the simulations, are responsible for 5% of the cluster populations. Similarly, the third cluster occurs in these two simulations and an additional 3 μs simulation and represents 3.4% of the populations. The lowest order state (first cluster) constitutes 79.4% of the total frames. Long-timescale simulations dominate higher order cluster populations with 83% of structures in clusters 4 and higher. Unique conformations are sampled more often in microsecond-length simulations according to the clustering analysis as shown in Figure 2. It is clear that if dominant conformations are of primary interest, shorter simulations are adequate (Vieira & Degrève, 2009). In fact, they are preferred as the appropriate region of phase space will be well covered with fewer computer resources.
Figure 3(a) highlights the structural changes that occur, with the primary representative of the three lowest order cluster structures that constitute 87.8% of all of the frames. The separation of secondary structure that results from the extension of the turn between the beta sheet and alpha helix is only seen in the microsecond regime. Figure 3(b) shows primary representatives of clusters 20 and 27, also only seen in the microsecond simulations that show destabilization of the alpha helix. This loss of secondary structure is a prime example of novel insight of conformational changes evidenced only with a larger simulation space. It is reasonable to hypothesize that significant conformational changes like the one shown here are more likely in long MD simulations.
Figure 3.
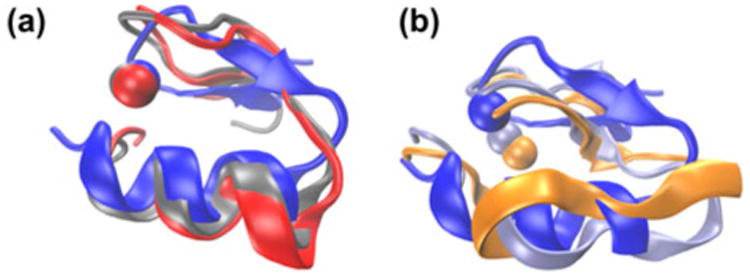
Structures of clusters.
Notes: Cluster structures of NEMO including the alpha helix, two beta sheets, and bound zinc ion. The high-order proteins show the destabilization of the alpha helix and displacement of the zinc ion from the dominant cluster. (a) Clusters 1 (blue), 2 (red), and 3 (silver) show the dominant clusters comparing all timescales. Clusters 2 and 3 only appear in microsecond simulations. (b) Clusters 1 (blue), 20 (orange), and 27 (ice blue) compare changes to the secondary structure of higher order, long-timescale conformations.
The relative populations of the individual trajectories overlaid on that of all the trajectories in Figure 4 indicate that the shortest simulations have clusters dominated by the lowest order cluster, but the microsecond simulations have a more diverse cluster representation.
Figure 4.
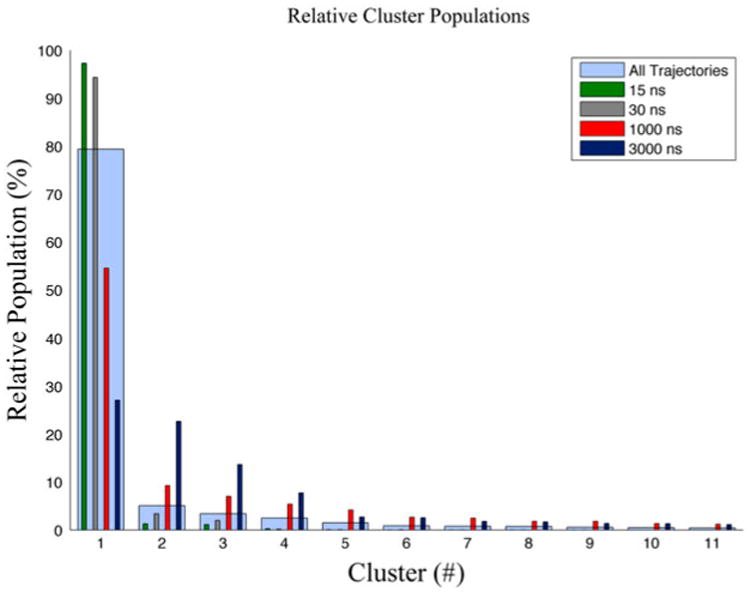
Relative cluster populations.
Notes: Relative cluster populations comparing clustering results of each trajectory clustered separately to that of all trajectories combined. The nanosecond simulations are both dominated by the lowest order cluster, where the microsecond clusters show a more diverse clustering population, and all clustering straddles the timescales.
3.2.1. Markov convergence shows ergodic simulations
A Markov chain of the cluster data from Figure 2 provides addition information for analysis. Where the Markov chain analysis assumes that each transition is only dependent on the current state, and independent of any previous state. In this case, we found that the nanosecond data all fit in nine clusters, where the microsecond simulations still required all 51 clusters.
Using the rate matrix determined from the Markov chain, we ascertain the number of steps required for convergence of each cluster to the distribution of the clusters for each timescale. We expect that if the system is ergodic, we will obtain the equilibrium cluster distribution regardless of the initial cluster state over long time periods. An initial pure-state cluster distribution is applied to the rate matrix iteratively to determine time to convergence to the equilibrium distribution. All pure states converge to the equilibrium distribution for all four timescales (Figure 5) albeit on different timescales.
Figure 5.
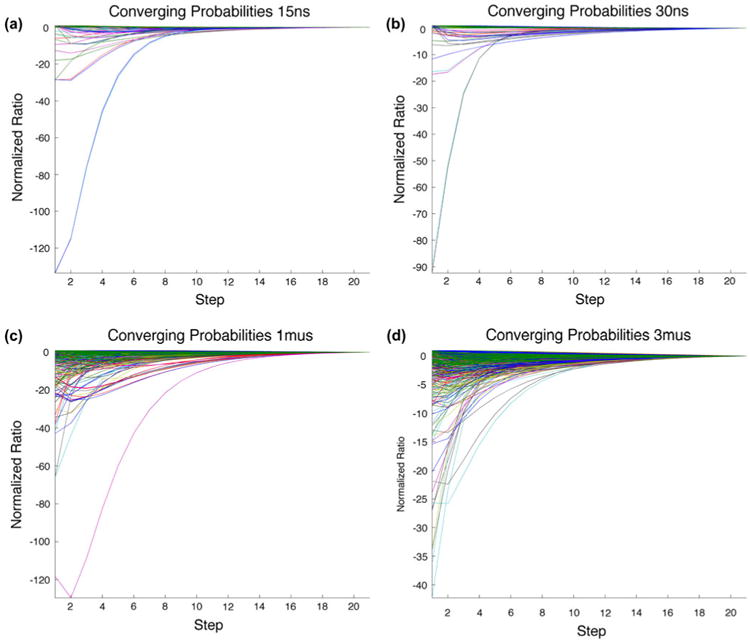
Markov convergence.
Notes: Pure-state convergence of the equilibrium distribution for each timescale shows that all data converge to the equilibrium distribution showing that each set is ergodic. The (a) 15, (b) 30, (c) 1000, and (d) 3000 ns simulations converge in approximately 8, 9, 72, and 210 ns, respectively.
3.3. Covariance differentiated by timescales
Covariance plots (Figure 6) show clear differences in correlation between the different durations, most notably between the nanosecond and microsecond simulations in that the nearly identical correlation between the beta sheets of the nanosecond regime changes in the microsecond scale. There are long-range correlations between the alpha helix and turn in the 1 μs that are not present in the 3 μs simulations.
Figure 6.
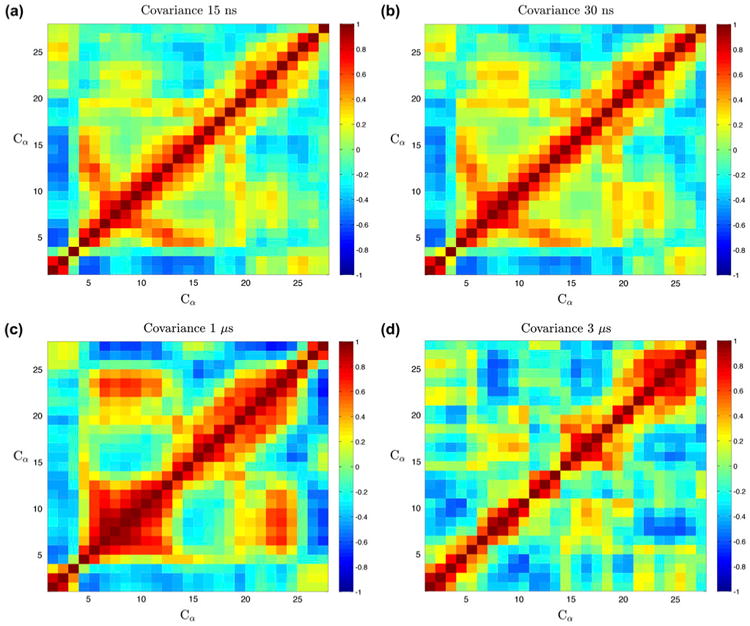
Covariance of each timescale.
Notes: Covariance plots of individual timescales [(a) 15, (b) 30, (c) 1000, and (d) 3000 ns] show that the nanosecond simulations are nearly identical, where the microsecond simulations show significant differences. There is a notable alpha helix–beta sheet, long-range interactions in the 1 μs data that are not present in the 3 μs simulations. The 3 μs simulation also shows very strong correlation from the alpha helix to the N-terminus.
Clearly, the 15 and 30 ns simulations are very similar visually and quantitatively, with a correlation coefficient of R = .981, whereas the differences between the microsecond simulations are much more drastic. To emphasize the differences, comparisons of all matrices are shown with the same scaling in Figure 7. Consistent with the clustering data, short-timescale simulations sufficiently probe dominant aspects of the covariance.
Figure 7.
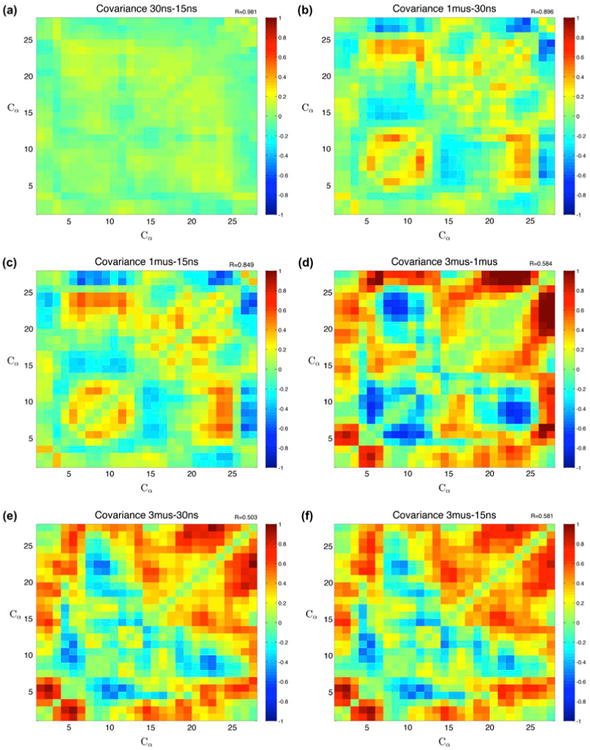
Covariance differences.
Notes: Subtracted covariances of different timescales along with corresponding correlation coefficients. The nanosecond simulations have the highest correlation, while the 3 μs simulations have the lowest correlations, and highlight correlation with the alpha helix region and the tail, and anti-correlation between two zinc-binding residues, a histidine (22) and a cysteine (9). (a) Comparing the two nanosecond timescales, shows very high correlation and little deviation. (b) The next longest interval difference shows differences in the secondary structures, mostly in the beta sheets. (c) Very similar to the other nanosecond comparison, the 1000–15 ns comparison also shows differences in the correlation near the beta sheet and zinc-binding location. (d) Comparing the two microsecond simulation sets, there is change between the tail and the beta sheet, as well as changes with the long-range beta sheet interactions. (e) The covariance between the 3000 and 30 ns simulations is the least correlated at R = .503. (f) The largest difference in timescales shows little correlation, and changes appear with the alpha-helix region as well as the tail regions.
The difference in the covariance matrices between all timescales further supports the difference in nanosecond and microsecond simulations. Correlation coefficients are displayed in the top corner of each plot. There is significant disagreement between the two microsecond duration trajectories, particularly in the alpha-helical region. They have a modest correlation coefficient of R = .584.
3.4. Covariance of clusters isolate interesting conformations
After concatenating all of the trajectories together and performing clustering analysis, as in Figure 2, we isolated the clusters and examined the covariance of each of the five most populated clusters separately (Figure 8). The covariance of the lowest order cluster is similar to that of the nanosecond simulations, with a correlation coefficient of R = .984 and .976 for the 15 and 30 ns simulations, respectively, which is expected if the nanosecond-scale simulations predominately sample a single state on the free energy landscape. To this end, primary conformations are most effectively studied with nanosecond-timescale simulations.
Figure 8.
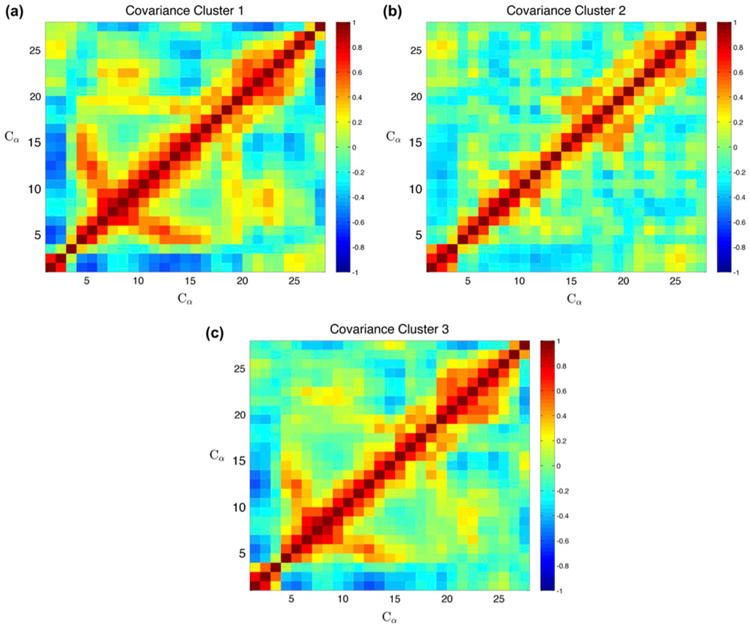
Covariance of clusters.
Notes: Covariance of the three most populated clusters across all timescales. (a) The lowest order (first) cluster shows covariance highly correlated with the 15 and 30 ns simulations (R = .985 and .976, respectively). (b) The second cluster loses the long-range interactions across the beta sheets, and is most correlated with the 3 μs simulation (R = .856). (c) The third recovers the beta sheet interaction and is most strongly correlated with the 15 ns simulations (R = .945).
The second-order cluster appears only in the microsecond regime is structurally different showing minimal long-range correlation and the beta sheet correlation signature. Similarly, the third-order cluster also only occurs in a subset of the long-time simulations, yet it has interactions between the beta sheets once again.
The microsecond-timescale simulations are responsible for clusters 2 and 3. These structures are kinetic traps and the protein stays in these configurations for the majority of the simulation after entering this state. This suggests that these less-populated, rarer clusters are indeed different conformational minima, which require longer scale simulations to reach.
4. Conclusion
Even longer simulations will afford larger fluctuations, and eventually folding processes will be examined in atomic detail. However, there is a wealth of information available in the microsecond scale. This time domain provides details primary behavior as well as ancillary behavior that we hypothesize supports biological function. Additionally, the accelerated hardware capabilities allow ample simulations for a good statistical basis. As such, we prefer microsecond simulations when resources are available.
Even a small 28-residue monomer shows significant conformational sampling in microsecond simulations. State sampling, as measured by clustering analysis, is very different between short and long simulations. Longer simulations sample a larger conformational space exposing larger fluctuations, stable structural configurations, and different covariance signatures. GPU parallelization makes long-timescale MD simulations practicable to examine slower, yet biologically important, processes.
Acknowledgments
Computations were, in part, performed on the Wake Forest University DEAC cluster. Thank you to Wake Forest Provost office and Information Systems Department for their support. Finally, thanks to Ryan Melvin for providing Matlab scripts for Markov analysis.
Funding: FRS was partially supported by NIH [R01CA129373]; WFU Comprehensive Cancer Center [5P30CA012197-39]; and RCG was supported by SCB training [grant T32GM095440-04].
Footnotes
Disclosure statement: No potential conflict of interest was reported by the authors.
References
- Alder BJ, Wainwright TE. Studies in molecular dynamics. I. General method. The Journal of Chemical Physics. 1959;31:459–466. [Google Scholar]
- Amadei A, Ceruso MA, Di Nola A. On the convergence of the conformational coordinates basis set obtained by the essential dynamics analysis of proteins' molecular dynamics simulations. Proteins: Structure, Function, and Genetics. 1999;36:419–424. [PubMed] [Google Scholar]
- Boehr DD, Nussinov R, Wright PE. The role of dynamic conformational ensembles in biomolecular recognition. Nature Chemical Biology. 2009;5:789–796. doi: 10.1038/nchembio.232. [DOI] [PMC free article] [PubMed] [Google Scholar]
- Cordier F, Grubisha O, Traincard F, Veron M, Delepierre M, Agou F. The zinc finger of NEMO is a functional ubiquitin-binding domain. Journal of Biological Chemistry. 2009;284:2902–2907. doi: 10.1074/jbc.M806655200. [DOI] [PubMed] [Google Scholar]
- Cordier F, Vinolo E, Véron M, Delepierre M, Agou F. Solution structure of NEMO zinc finger and impact of an anhidrotic ectodermal dysplasia with immunodeficiency-related point mutation. Journal of Molecular Biology. 2008;377:1419–1432. doi: 10.1016/j.jmb.2008.01.048. [DOI] [PubMed] [Google Scholar]
- Courtois G, Gilmore T. Mutations in the NF-κB signaling pathway: Implications for human disease. Oncogene. 2006;25:6831–6843. doi: 10.1038/sj.onc.1209939. [DOI] [PubMed] [Google Scholar]
- Courtois G, Smahi A. NF-κB-related genetic diseases. Cell Death & Differentiation. 2006;13:843–851. doi: 10.1038/sj.cdd.4401841. [DOI] [PubMed] [Google Scholar]
- Harvey MJ, De Fabritiis G. An implementation of the smooth particle mesh Ewald method on GPU hardware. Journal of Chemical Theory and Computation. 2009;5:2371–2377. doi: 10.1021/ct900275y. [DOI] [PubMed] [Google Scholar]
- Harvey MJ, Giupponi G, Fabritiis GD. ACEMD: Accelerating biomolecular dynamics in the microsecond time scale. Journal of Chemical Theory and Computation. 2009;5:1632–1639. doi: 10.1021/ct9000685. [DOI] [PubMed] [Google Scholar]
- Heyer LJ. Exploring expression data: Identification and analysis of coexpressed genes. Genome Research. 1999;9:1106–1115. doi: 10.1101/gr.9.11.1106. [DOI] [PMC free article] [PubMed] [Google Scholar]
- Jorgensen WL, Chandrasekhar J, Madura JD, Impey RW, Klein ML. Comparison of simple potential functions for simulating liquid water. The Journal of Chemical Physics. 1983;79:926–935. [Google Scholar]
- Lee MS, Salsbury FR, Brooks CL. Constant-pH molecular dynamics using continuous titration coordinates. Proteins: Structure, Function, and Bioinformatics. 2004;56:738–752. doi: 10.1002/prot.20128. [DOI] [PubMed] [Google Scholar]
- Martinez-Pomar N, Munoz-Saa I, Heine-Suner D, Martin A, Smahi A, Matamoros N. A new mutation in exon 7 of NEMO gene: Late skewed X-chromosome inactivation in an incontinentia pigmenti female patient with immunodeficiency. Human Genetics. 2005;118:458–465. doi: 10.1007/s00439-005-0068-y. [DOI] [PubMed] [Google Scholar]
- Negureanu L, Salsbury FR. The molecular origin of the MMR-dependent apoptosis pathway from dynamics analysis of MutSα-DNA complexes. Journal of Biomolecular Structure & Dynamics. 2012a;30:347–361. doi: 10.1080/07391102.2012.680034. [DOI] [PMC free article] [PubMed] [Google Scholar]
- Negureanu L, Salsbury FR. Insights into protein–DNA interactions, stability and allosteric communications: A computational study of mutSα-DNA recognition complexes. Journal of Biomolecular Structure & Dynamics. 2012b;29:757–776. doi: 10.1080/07391102.2012.10507412. [DOI] [PMC free article] [PubMed] [Google Scholar]
- Negureanu L, Salsbury FR. Non-specificity and synergy at the binding site of the carboplatin-induced DNA adduct via molecular dynamics simulations of the MutSα-DNA recognition complex. Journal of Biomolecular Structure & Dynamics. 2014;32:969–992. doi: 10.1080/07391102.2013.799437. [DOI] [PMC free article] [PubMed] [Google Scholar]
- Pasparakis M. IKK/NF-κB signaling in intestinal epithelial cells controls immune homeostasis in the gut. Mucosal Immunology. 2008 Nov;1(Suppl. 1):S54–S57. doi: 10.1038/mi.2008.53. [DOI] [PubMed] [Google Scholar]
- Rueda M, Ferrer-Costa C, Meyer T, Pérez A, Camps J, Hospital A, Gelpí JL. A consensus view of protein dynamics. Proceedings of the National Academy of Sciences. 2007;104:796–801. doi: 10.1073/pnas.0605534104. [DOI] [PMC free article] [PubMed] [Google Scholar]
- Vieira DS, Degrève L. An insight into the thermostability of a pair of xylanases: The role of hydrogen bonds. Molecular Physics. 2009;107:59–69. doi: 10.1080/00268970902717959. [DOI] [Google Scholar]


