Abstract
Vibrational sum-frequency generation (SFG) spectroscopy has become an established technique for in situ surface analysis. While spectral recording procedures and hardware have been optimized, unique data analysis routines have yet to be established. The SFG intensity is related to probing geometries and properties of the system under investigation such as the absolute square of the second-order susceptibility . A conventional SFG intensity measurement does not grant access to the complex parts of χ(2) unless further assumptions have been made. It is therefore difficult, sometimes impossible, to establish a unique fitting solution for SFG intensity spectra. Recently, interferometric phase-sensitive SFG or heterodyne detection methods have been introduced to measure real and imaginary parts of χ(2) experimentally. Here, we demonstrate that iterative phase-matching between complex spectra retrieved from maximum entropy method analysis and fitting of intensity SFG spectra (iMEMfit) leads to a unique solution for the complex parts of χ(2) and enables quantitative analysis of SFG intensity spectra. A comparison between complex parts retrieved by iMEMfit applied to intensity spectra and phase sensitive experimental data shows excellent agreement between the two methods.
I. INTRODUCTION
Analyzing molecules at interfaces in situ is important to a wide variety of scientific fields from catalysis to atmospheric research to biosciences. Among others, the technique of vibrational sum-frequency generation spectroscopy has made enormous contributions (and sometimes introduces confusion) as it allows vibrational spectra of molecules residing at solid/air, liquid/air, solid/liquid, and liquid/liquid interfaces to be measured.1–14 Its probing scheme is fairly simple: typically a visible and an IR beam are overlapped at the sample surface and the coherent sum-frequency signal of both incoming beams (ωSFG = ωIR + ωvis) is detected in the direction favored by conservation of momentum. The key-value of vibrational sum-frequency generation (SFG) spectroscopy for applications in surface science is its inherent surface specificity. Within the electric dipole approximation, bulk signals originating from media that are isotropic or centrosymmetric are forbidden and SFG signals are therefore dominated by surface contributions.15
The intensity measured in an SFG experiment is proportional to a material constant, namely, the absolute square of tensor elements from the effective second-order susceptibility . In the case of discrete resonances, χ(2) can be written as
| (1) |
with being the non-resonant contribution. Ak, ωk, and Γk are the effective strength, resonant frequency, and damping coefficient of the kth mode, respectively. Both the non-resonant contribution and the effective amplitudes Ak can be of complex nature with a certain phase relation between them. In case of non-absorbing media, the amplitude Ak is real and the imaginary part of the resonant contribution to χ(2) is given by
| (2) |
This expression is analogous to ℑ(ϵ) for linear spectroscopies, with ϵ being the optical dielectric constant. Without knowing either the real or the imaginary part, it is impossible to find a unique fitting solution to the SFG spectra using Equation (1) and thus interpretation and quantitative spectral analysis becomes difficult, if not impossible.
The imaginary part can be measured by interferometric phase-sensitive SFG or heterodyne detection methods.14,16–19 Some applications, however, require quite a large amount of sample passage, which is not feasible for more time-demanding phase sensitive measurements—or if such resources are simply not available. Also, non-coherent scattering processes cannot be measured in an interferometric setting and require analytical methods to retrieve complex parts of χ(2).20 In these cases, there is a need to obtain information on the imaginary part from intensity spectra.
Yang and Huang have applied the maximum entropy method (MEM) to retrieve the imaginary part from an intensity SFG spectrum.21,22 The MEM analysis yields a complex spectrum that is multiplied by a phase factor (exp(iϕ)), which is not known a priori. The error phase ϕ needs to be adjusted in order to match a physical meaningful trend of the real and imaginary parts.20 Therefore, the MEM analysis works well for isolated spectral contributions, but can be ambiguous for spectra with overlapping resonances and varying non-resonant contributions. However, the benefit of the MEM analysis is that, even if the error phase is not known, the relative spectral phases are contained within the complex MEM spectrum.
More recently, a Fourier filter was introduced by Roke et al.23 This filter locates central frequencies for resonances of defined width from a complex data set and is a valuable asset when it comes to estimating starting parameters for intensity fitting routines. Nevertheless, even with the correct set of starting peak positions, it is often impossible to find a unique solution to Equation (1) when fitting intensity SFG spectra.
In this paper, we introduce iterative phase-matching between complex spectra retrieved from maximum entropy method analysis and fitting of intensity SFG spectra (iMEMfit). The algorithm presented here utilizes the Fourier filter to identify peak positions to be used as input parameters for a feedback loop between an intensity fitting function based on Equation (1) and the MEM analysis by adapting the phases of complex fit and MEM spectrum. This is achieved by adjusting the error phase of the MEM analysis to find the best match to the imaginary part of the intensity fit. Afterwards, the phase of the intensity fit is adapted by varying the amplitudes Ak to find the best overlap between the phase of the fit and the MEM analysis. After several iteration cycles, the relative phases of the MEM analysis are aligned with the relative phases of the fit and a unique fit to Equation (1) can be established. We demonstrate the feasibility of our approach by a quantitative comparison between a simple intensity fit and an iMEMfit of a simulated SFG spectrum. Finally, we compare imaginary parts retrieved from iMEMfit to phase-sensitive measurements that we found in the literature.18,19
II. EXPERIMENTAL SECTION
A. Materials
Sodium dodecyl sulfate (SDS) (>98.5%) and cetyl trimethyl ammonium bromide (CTAB) (BioXtra, >99%) obtained from Sigma were used as received. Aqueous solutions of these ionic model surfactants at concentrations of 1 mmol l−1 and 0.05 mmol l−1 were prepared by dissolving the surfactant in Millipore water characterized by a resistivity of 18.2 MΩ cm. Samples were measured in cleaned glass Petri dishes having a diameter of ca. 10 cm. Cleaning of the glassware used for sample preparation and measurement was achieved by storing the dishes in a bath of nitric acid for 48 h, subsequent exhaustive rinsing with Millipore water and drying in nitrogen flow.
B. SFG-spectroscopy
SFG spectra in the characteristic CH- and OH-stretching region from 2800 to 3800 cm−1 (spectral resolution of 2 cm−1 and averaging over 400 laser pulses per probed wavenumber) were obtained from a commercially available SFG spectrometer (EKSPLA). In the setup, a visible laser pulse (λvis = 532 nm) and a tunable IR-laser pulse with a duration of 25 ps are overlapped both temporally and spatially on the interface between air and the investigated aqueous solution. Laser pulses were produced at a 50 Hz repetition rate and a range of characteristic energies from 90 to 200 μJ. Angles of incidence of 67° and 55° with respect to the surface normal were used for the visible and IR-pulse, respectively. The spectra were collected under ssp-polarization and normalized with respect to the intensities of the visible and IR-pulses. No additional data treatment was applied.
III. RESULTS AND DISCUSSION
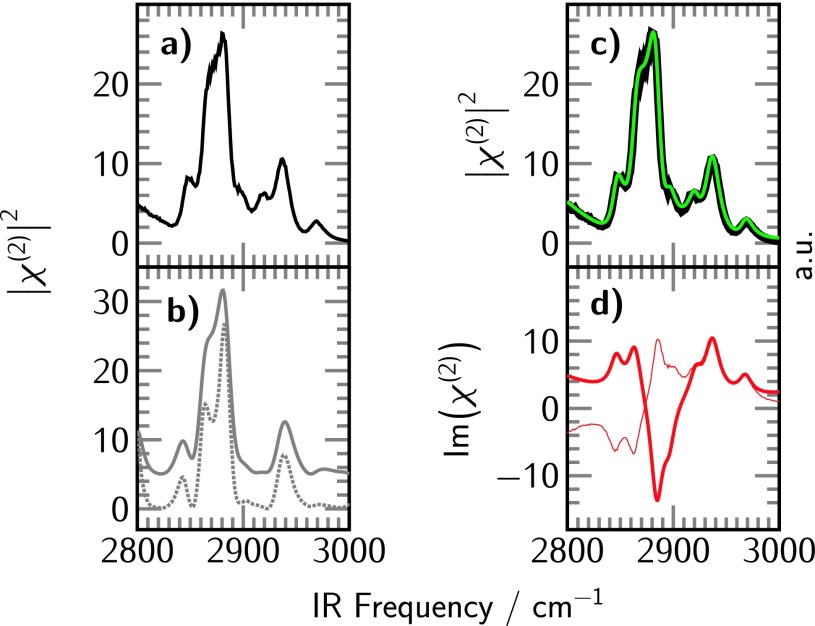
In order to check the validity of the iMEMfit, an intensity spectrum using the expression for χ(2) being defined by Equation (1) was simulated with known values of real amplitudes Ak, linewidths Γk, and peak positions ωk. A spectral resolution of 1 cm−1 and an intensity noise of 2% were chosen for the simulation. Figure 1(a) shows the resulting intensity plot of the simulated spectrum . Peak widths between 6 cm−1 and 12 cm−1 have been chosen for our simulation. In the first step, a Fourier filter was applied, which is shown Figure 1(b) with two representative linewidths as input parameters.
FIG. 1.
(a) Simulated intensity spectrum constituted by seven peaks in the alkyl region. (b) Peak positions obtained by applying a Fourier filter with widths of 6 cm−1 (gray dotted line) and 9 cm−1 (gray solid line). The filter intensities are displayed with an offset for clarity. (c) Intensity (black) and intensity fit (green) of the simulated spectrum. (d) Imaginary part of the fit of the simulated spectrum corresponding to the intensity fit in the inset above (thick red line) as compared to the simulated imaginary part (thin red line). The corresponding residuals can be found in the supplementary material.32
The Fourier filter utilizes the MEM analysis, which yields a complex function 1/g(ν) that is multiplied by an error phase factor of exp(iϕ),
| (3) |
where ν = (ωIR − ω1)/(ω2 − ω1) is defined as the dimensionless frequency with values between 0 and 1. Frequencies ω1 and ω2 represent the lowest and highest spectral frequency, respectively. Details on the theory of MEM analysis are described elsewhere.20–22,24–26 Most importantly, the uncorrected complex function 1/g(ν) contains all spectral relative phases, which is the difference between the phase at two spectral positions. This phase difference is not affected by the choice of the error phase factor exp(iϕ), which will become important at a later stage when the phases of the complex intensity fit and MEM function are compared.
The Fourier filter identifies peak positions in a complex spectrum and utilizes the uncorrected complex MEM function given by the following expression:23
| (4) |
in which the angle ψk is defined as ψk = 2arctan((ωIR − ωk)/Γk). Equation (4) defines the resulting function of the Fourier filtering. It scales with the strength of a resonant peak and will show a local maximum at a resonance. Figure 1(b) shows the Fourier filter of our simulated spectrum with two different linewidths Γk (6 cm−1 (gray dotted line) and 9 cm−1 (gray solid line)). The Fourier filter detects most peak positions very accurately (with an error less than 3 cm−1), but does have difficulties at the edges of the spectrum (lower frequency side in Figure 1(b)). Other than that, the Fourier filter is an excellent tool that allows us to identify starting parameters for the SFG intensity fitting function of according to Equation (1).
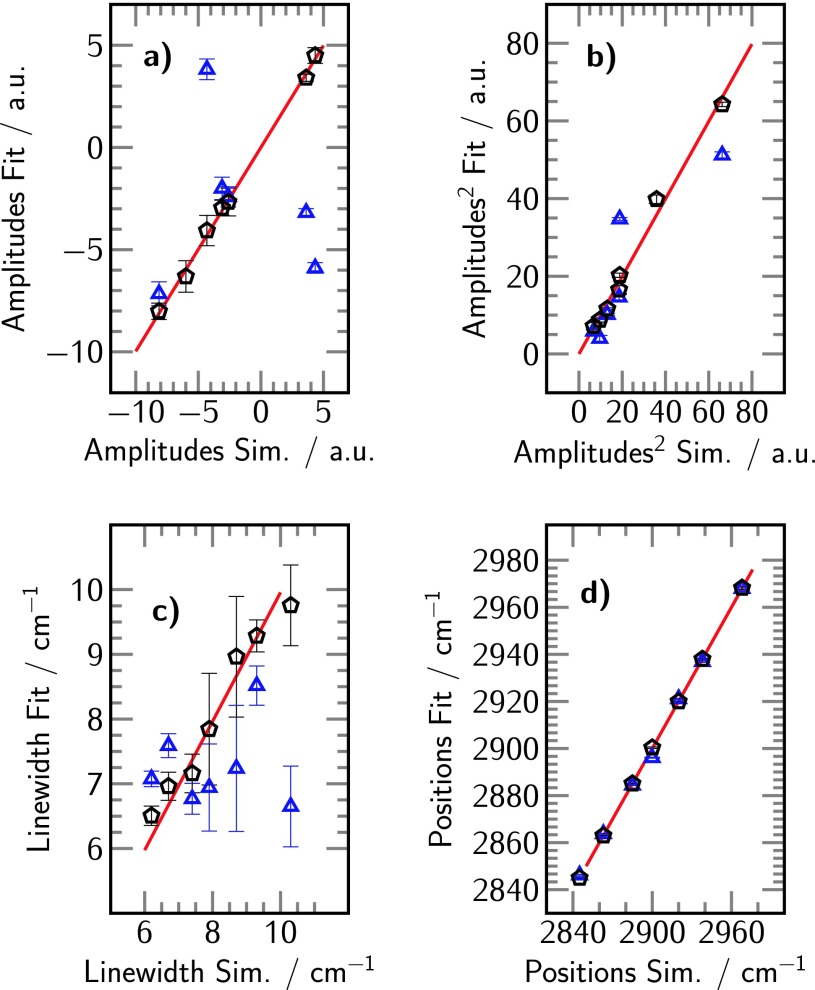
In Figure 1(c), the simulated spectrum (black) and one version of a corresponding intensity fit (green) are shown. Good agreement is reached in the intensity spectrum, however, the imaginary part of the fit (thick red solid line) and the imaginary part of the simulation (thin red solid line) are vastly different as shown in Figure 1(d). The corresponding fit is just one possible local solution to the minimization problem of the difference between measured and fitted intensity. Other solutions would fit the intensity spectrum perfectly, but would result in different imaginary (and real) parts. Each fitting variant leads to different values for the fitting parameters Ak, ωk, and Γk which will be discussed in the context of Figure 5. Note that a change in sign of the amplitudes (and imaginary part) will yield the same absolute values for the fitting parameters and does not alter the intensity spectrum. Therefore, the absolute sign cannot be determined from the fit unless other a priori assumptions have been made such as the reference to an oscillator with a known orientation and sign of the effective χ(2) element. Here the reference to a unique solution is related to the determination of fitting parameters , ωk and Γk as well as relative phase relations between the peaks.
FIG. 5.
Results of the classical intensity fit by means of a least squares algorithm (blue triangles) and iMEMfit (black pentagons). (a) Amplitudes. (b) Squared amplitudes. (c) Linewidths. (d) Peak positions. The red lines serve to illustrate the recovery of the parameters used for the simulated spectrum by means of a linear fit. The correlation for the black pentagons is >0.94 for all of the presented insets while the classical fit substantially deviates from the model parameters (see Table I.).
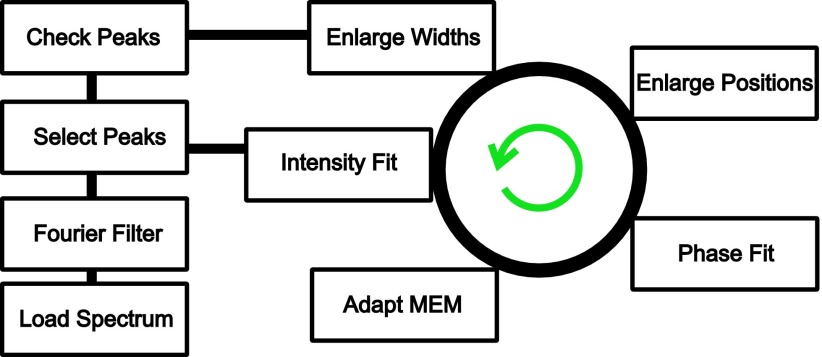
In order to find a unique solution for the fit using Equation (1), we need to know the phase at each spectral position. While the MEM analysis does not necessarily return the correct absolute phase at a certain position, it provides a complex function that includes relative spectral phases. Here, we suggest a novel fitting scheme that is shown in Figure 2. After applying the Fourier filter and selecting peaks, the intensity spectrum is fitted using Equation (1). Next, the best error phase ϕ is found so that the imaginary part of the fit and the imaginary part of the MEM analysis match. With this error phase, the phase of the complex MEM spectrum is determined. In the final step, the phase of the spectrum will be adapted by varying the amplitudes Ak so that the best match between the spectral phase and the corrected MEM phase can be found. These Ak values will be given as starting parameters for the next cycle. The boundary conditions for the positions and linewidths are predefined and, in case the fit determines ωk or Γk-values close to the boundary conditions, these boundary values will be expanded within physical meaningful limits (e.g., no negative values for the linewidth or peak positions outside the measured spectral range). This cycle is repeated until the imaginary part of the fit and the phase of the fit match the imaginary part of the MEM analysis and the phase of the corrected MEM spectrum, respectively.
FIG. 2.
Scheme of iMEMfit: After loading the intensity spectrum, a Fourier filter is applied in order to obtain a pre-selection of number, positions, and linewidths of peaks for the least squares intensity fit. In the following step, the error phase of the complex MEM spectrum is varied in order to achieve best agreement with the imaginary part of the intensity fit. The phase of the adapted complex MEM spectrum is then matched to the phase of the spectral fit by variation of the amplitudes. The resulting amplitudes will be given as input parameters for the next cycle. Finally, the limiting upper and lower boundary of peak positions and widths are enlarged in case the obtained fitting values are too close to the predefined edges. After each cycle, an assessment of the validity may be performed.
For non-absorbing media, Ak are real; for strongly absorbing media, the effective amplitude becomes complex due to the inclusion of local field corrections.6 In this case, an additional phase factor must be included. However, for the simulation used here, we assumed real amplitudes mimicking, e.g., organic molecules on a non-absorbing substrate measured in air.
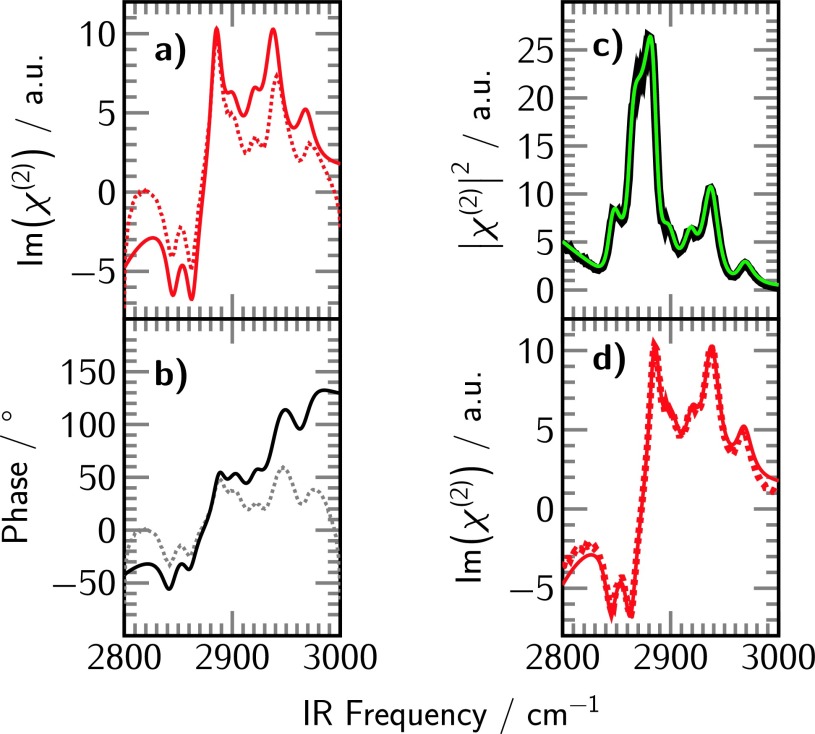
The imaginary part from the iMEMfit result of the simulated spectrum in Figure 1(a) is shown in Figure 3(a) together with the MEM result after optimization with iMEMfit. The fitted results are plotted as solid lines and the MEM results as dotted lines. The phase of the fit intensity and the result of the MEM analysis are shown in Figure 3(b) as black solid and gray dotted line, respectively. The corresponding iMEMfit (green) is shown in Figure 3(c). A comparison between the imaginary part of the simulation and imaginary part of the iMEMfit is shown in Figure 3(d). The intensity of the simulation (black) and the fit (green) as well as the imaginary spectrum (red dotted line) and the fit (red solid line) entirely overlap.
FIG. 3.
(a) Imaginary part of the fitting result for the presented simulated spectrum (red solid line) and imaginary part of MEM analysis after optimization with iMEMfit (red dotted line). (b) Phase of the discrete data points obtained from MEM analysis (gray dotted line) and phase of the fitting result (black) after optimization with iMEMfit. (c) Simulated intensity spectrum (black) and iMEMfit (green). (d) Imaginary part of the simulated spectrum (red dashed line) and imaginary part obtained by iMEMfit (red solid line). The corresponding residuals can be found in the supplementary material.32
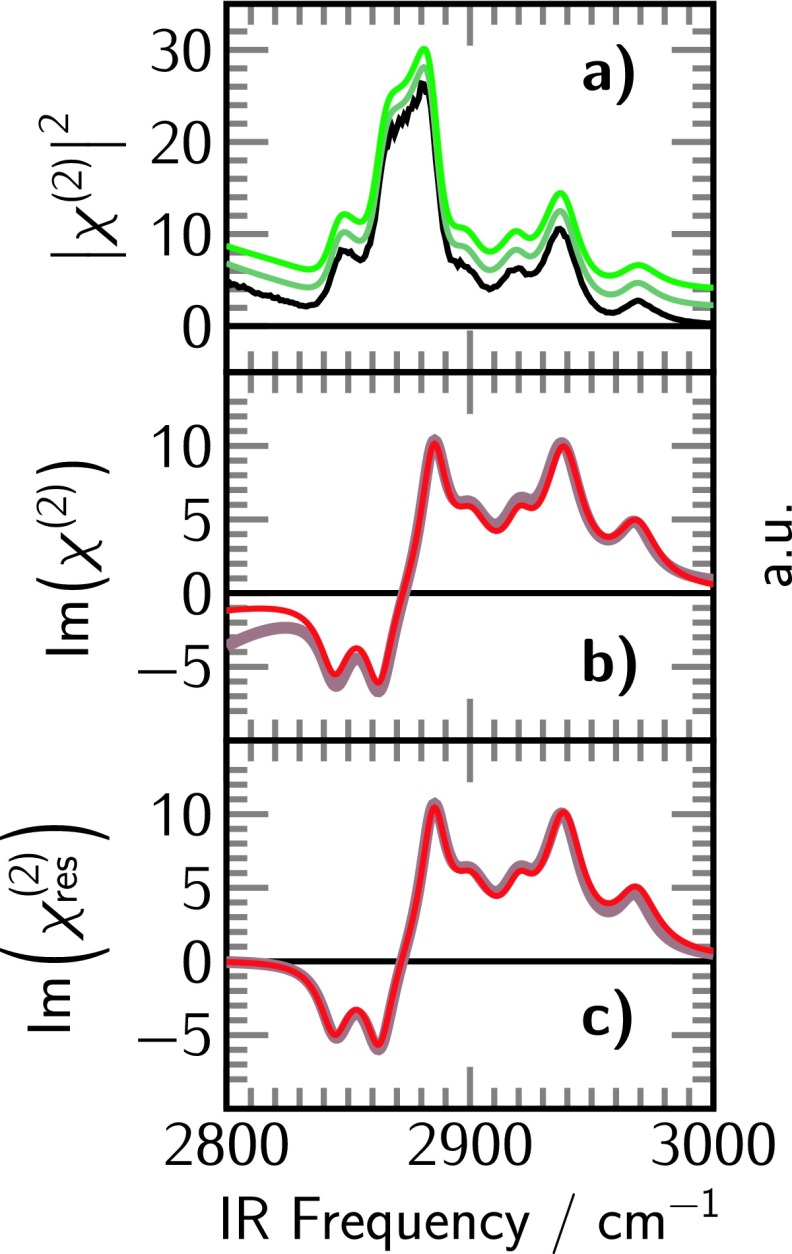
In the simulated spectrum, we intentionally chose the intensity to not return to noise level at one edge of the spectrum. To adapt the fit to such a scenario, we added the possibility of a non-resonant peak with the same form as a resonant contribution in Equation (1) having a position within 100 cm−1 from the lower and upper side of the spectrum and a Γ value that is greater than 50 cm−1. Two fits with different values for the starting parameters and boundary values of the non-resonant background are shown in Figure 4(a). The intensity fits do overlap and are stacked for clarity. The individual choice of these non-resonant contributions may affect the imaginary part of the spectrum, in particular at the edges (Figure 4(b)). However, the purely resonant part of the fit is not altered by the choice of the non-resonant contribution (Figure 4(c)). Therefore, in the following only the resonant contribution to the imaginary part of the fit is plotted. In fact, the iMEMfit has the advantage of separating resonant and non-resonant contributions, which is not accessible by the MEM analysis alone. In fact, the MEM analysis cannot take into account spectral contributions that are outside of the measured spectral range. This is also one of the reasons why the imaginary part of the iMEMfit and the simulated spectrum nearly overlap while the imaginary part of the MEM analysis after optimization and the imaginary part of the iMEMfit show residual differences.
FIG. 4.
(a) Simulated intensity spectrum (black) and iMEMfit results obtained by fixing the non-resonant background peaks to the edges of the spectrum (dark green) and allowing the background peaks to vary (light green). The spectra are offset for clarity. (b) Imaginary part of the fit with fixed background positions (red-gray) and the background peaks allowed to vary (red). (c) Resonant contribution to the imaginary part of the fit with fixed background positions (red-gray) and the background peaks allowed to vary (red).
The imaginary part of the spectrum is similar to linear spectroscopy methods in its shape, i.e., no interference effects occur between overlapping spectral contributions. Another important aspect is that the sign of the amplitudes Ak is related to the orientation of the respective oscillators.14,17,27–30 Figures 5(a)–5(d) show a comparison between the input values of the simulated spectrum and the fitted amplitudes Ak, squared amplitudes , linewidths Γk, and positions ωk, respectively. The black pentagons represent the parameters obtained from the suggested analytical scheme and agree within a 95% confidence interval with the model constants. Most importantly, in case of an unknown spectral phase, a good overlap between the intensity fit and the simulated intensity does not necessarily mean that its model parameters are correct. This is shown, for example, in the fit of the simulated spectrum in Figure 1. The resulting values for the amplitudes Ak, squared amplitudes , and linewidths Γk deviate quite substantially from the input parameters (blue triangles in Figures 5(a)–5(d)). The coefficients of determination for the intensity fit () and the iMEMfit () are shown in Table I. For the intensity fit, only the spectral position has an , which further illustrates the usefulness of the Fourier filter. The amplitude, as well as the linewidth, has an close to zero. In comparison, the parameters from the iMEMfit have for amplitude, squared amplitude, position, and linewidth. Therefore, when it comes to quantitative spectral analysis, it is indispensable to either measure the imaginary part experimentally14,16–19 or to analyze the data in a post-processing algorithm such as the iMEMfit that allows retrieval of the real and imaginary parts of the intensity spectrum.
TABLE I.
Coefficients of determination for the relation between the parameters of the simulation and the parameters of the intensity fit () as well as the iMEMfit (). The linear fits are shown as red lines in Figure 5 for the amplitudes Ak, squared amplitudes , positions ωk, and linewidths Γk.
| Parameter | ||
|---|---|---|
| Ak | 0.04 | >0.99 |
| 0.32 | 0.99 | |
| ωk | >0.99 | >0.99 |
| Γk | 0.01 | 0.94 |
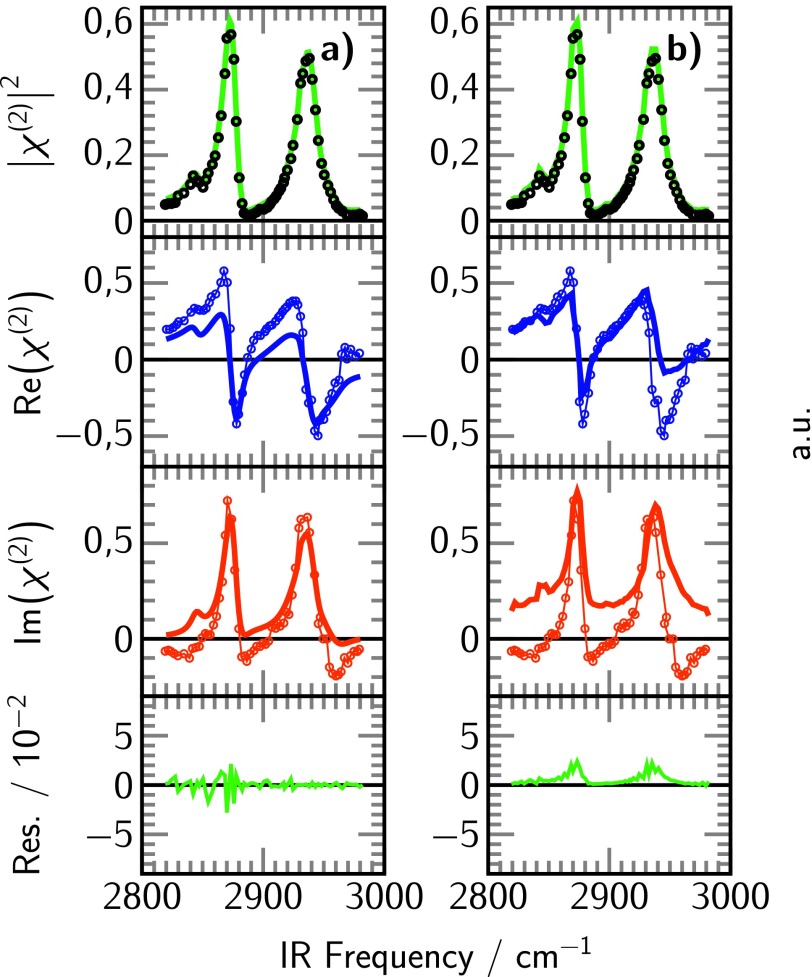
The iMEMfit routine was applied to a phase sensitive SFG spectrum previously recorded by Shen et al. from an octadecyltrichlorosilane (OTS) monolayer on fused silica.18 The corresponding intensity spectrum and fit using our data analysis routine (green) are shown in the top part of Figure 6(a). The middle parts of this figure represent the measured real and imaginary parts compared to the resonant real and imaginary parts from the iMEMfit. Excellent agreement can be seen in the trend. Additionally, spectral features can be readily identified in the imaginary part such as the asymmetric stretch of the terminal methyl group around 2968 cm−1.
FIG. 6.
Application of iMEMfit to phase sensitive SFG data from Shen and coworkers.18 (a) From top to bottom: spectral intensity (black circles) and fit intensity (green line); real part from the experimental data (thin blue line with circle markers) and iMEMfit (thick blue line); imaginary part from the experimental data (thin red line with circle markers) and iMEMfit (thick red line); residuals from the iMEMfit (green line). (b) The same as (a), only that the iMEMfit is exchanged with the adapted MEM analysis after application of iMEMfit.
In Figure 6(b), the measured real and imaginary parts are compared to the real and imaginary parts of the MEM spectrum obtained by iMEMfit. Again, good agreement can be found in the trends of the imaginary and real parts between measured and MEM analysis.
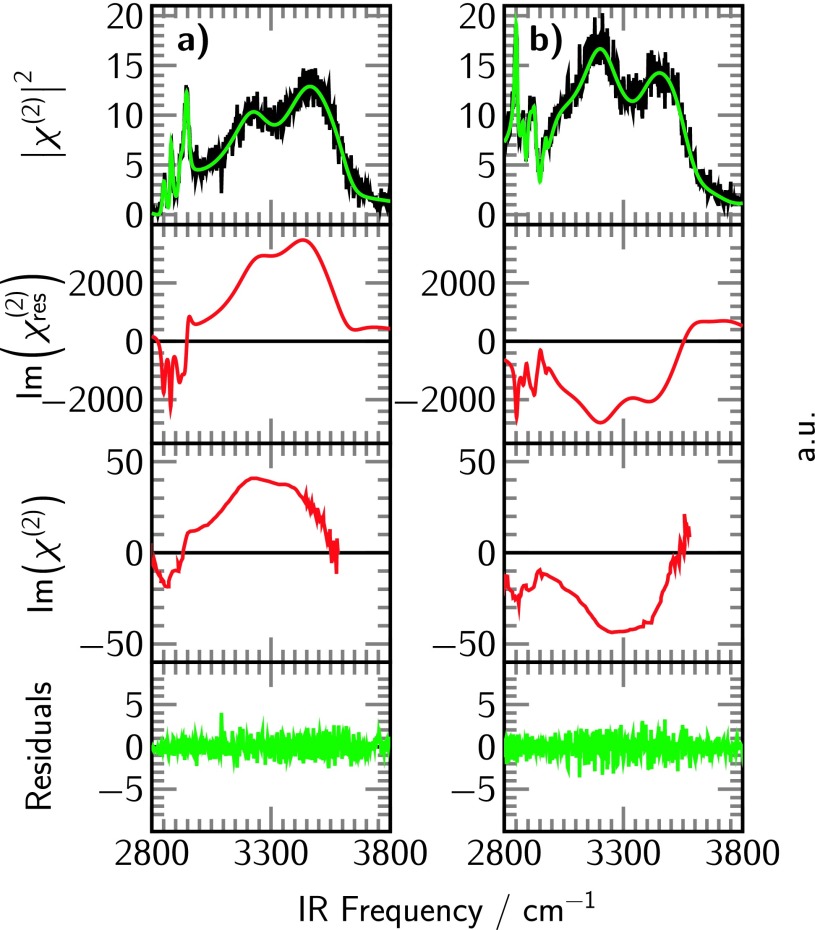
In the next example of our iterative fitting routine, we recorded SFG intensity spectra at the liquid/air interface from SDS and CTAB. The corresponding intensity spectra in the CH- and OH-stretching regions from 2800 to 3800 cm−1 are shown in the top parts of Figures 7(a) and 7(b), respectively. The middle parts of this figure show the resonant imaginary parts for the two spectra after applying iMEMfit. The head groups of SDS (anionic surfactant) and CTAB (cationic surfactant) are oppositely charged. Therefore, on average, the water orientation adjacent monolayer with respect to the hydrogen atoms is preferably directed towards the headgroup for SDS and away from the surfactant monolayer for CTAB. This flip in orientation is expressed in terms of a different sign for the corresponding amplitudes Ak and, hence, the imaginary part is positive for SDS (see Equation (2)) and negative for CTAB. A reprint of the imaginary parts measured by phase sensitive SFG from Tahara et al. is also shown in Figures 7(a) and 7(b).19 Excellent agreement is found between the measured and iMEMfit imaginary parts. This is remarkable given that these spectra are fairly complex in nature and recorded once with a phase sensitive fs-measurement scheme by the Tahara group and once with a ps-laser that records intensity spectra. These examples underpin the benefit from retrieving the real and imaginary parts of SFG intensity spectra using iMEMfit.
FIG. 7.
SFG spectra of (a) SDS and (b) CTAB. From top to bottom: measured intensity spectra (black) and fitted intensities (green); resonant imaginary parts obtained by iMEMfit of the intensity spectra; imaginary part from phase sensitive SFG experiments in ssp-polarization;19 and residuals from the iMEMfit (green line).
IV. CONCLUSION
Retrieving the imaginary part of an intensity spectrum that is proportional to is a requirement to find a unique solution for χ(2). Having the imaginary part available holds great potential not only for qualitative analysis, but is also imperative for quantitative spectral analysis. Here, we introduce iMEMfit, a new fitting scheme based on iterative phase-matching between complex spectra retrieved from MEM analysis and fitting of intensity SFG spectra. Good overlap between the input parameters of a simulated spectrum and the model constants obtained from iMEMfit is demonstrated (R2 > 0.94 for amplitudes, squared amplitudes, positions, and linewidths). The Fourier filter helps finding the correct positions for both the intensity and the iMEMfit, but only the iMEMfit establishes a unique solution for the absolute amplitudes and widths. Several examples are presented that exhibit excellent agreement between complex experimental spectra and imaginary parts obtained from iMEMfit showcasing the applicability of the routine. Once the lineshape function is known, such as the case for low noise and high-resolution broadband SFG spectra,31 the fitting of intensity spectra may result in a unique solution without further assumptions. Also, the MEM analysis can be affected by strong changes in the nonresonant amplitude or phase, and care needs to be taken in such a scenario.21 The iMEMfit algorithm will be particularly advantageous for fitting intensity spectra obtained from picosecond lasers. Its applicability to broadband SFG spectra still needs to be investigated as the spectral shape of those spectra is distorted due to the low resolution of the visible beam. Though qualitative trends may be recovered correctly, a quantitative analysis for this type of spectra has yet to be established.
Acknowledgments
This research was supported by NIH Grant No. EB-002027 to the National ESCA and Surface Analysis Center for Biomedical Problems.
REFERENCES
- 1.Shen Y. R., “Surface properties probed by second-harmonic and sum-frequencyr generation,” Nature 337, 519–525 (1989). 10.1038/337519a0 [DOI] [Google Scholar]
- 2.Bain C. D., “Sum-frequency vibrational spectroscopy of the solid/liquid interface,” J. Chem. Soc., Faraday Trans. 91, 1281–1296 (1995). 10.1039/ft9959101281 [DOI] [Google Scholar]
- 3.Richmond G. L., “Molecular bonding and interactions at aqueous surfaces as probed by vibrational sum frequency spectroscopy,” Chem. Rev. 102, 2693–2724 (2002). 10.1021/cr0006876 [DOI] [PubMed] [Google Scholar]
- 4.Chen X., Clarke M. L., Wang J., and Chen Z., “Sum frequency generation vibrational spectroscopy studies on molecular conformation and orientation of biological molecules at interfaces,” Int. J. Mod. Phys. B 19, 691–713 (2005). 10.1142/S0217979205029341 [DOI] [Google Scholar]
- 5.Vidal F. and Tadjeddine A., “Sum-frequency generation spectroscopy of interfaces,” Rep. Prog. Phys. 68, 1095–1127 (2005). 10.1088/0034-4885/68/5/R03 [DOI] [Google Scholar]
- 6.Wang H.-F., Gan W., Lu R., Rao Y., and Wu B.-H., “Quantitative spectral and orientational analysis in surface sum frequency generation vibrational spectroscopy (SFG-VS),” Int. Rev. Phys. Chem. 24, 191–256 (2005). 10.1080/01442350500225894 [DOI] [Google Scholar]
- 7.Roke S., “Nonlinear optical spectroscopy of soft matter interfaces,” ChemPhysChem 10, 1380–1388 (2009). 10.1002/cphc.200900138 [DOI] [PubMed] [Google Scholar]
- 8.Chen Z., Shen Y. R., and Somorjai G. A., “Studies of polymer surfaces by sum frequency generation vibrational spectroscopy,” Annu. Rev. Phys. Chem. 53, 437–465 (2002). 10.1146/annurev.physchem.53.091801.115126 [DOI] [PubMed] [Google Scholar]
- 9.Raschke M. B. and Shen Y. R., “Nonlinear optical spectroscopy of solid interfaces,” Curr. Opin. Solid State Mater. Sci. 8, 343–352 (2005). 10.1016/j.cossms.2005.01.002 [DOI] [Google Scholar]
- 10.Geiger F. M., “Second harmonic generation, sum frequency generation, and χ(3): Dissecting environmental interfaces with a nonlinear optical swiss army knife,” Annu. Rev. Phys. Chem. 60, 61–83 (2009). 10.1146/annurev.physchem.59.032607.093651 [DOI] [PubMed] [Google Scholar]
- 11.Verreault D., Kurz V., Howell C., and Koelsch P., “Sample cells for probing solid/liquid interfaces with broadband sum-frequencyr-generation spectroscopy,” Rev. Sci. Instrum. 81, 063111-1–063111-10 (2010). 10.1063/1.3443096 [DOI] [PubMed] [Google Scholar]
- 12.Arnolds H. and Bonn M., “Ultrafast surface vibrational dynamics,” Surf. Sci. Rep. 65, 45–66 (2010). 10.1016/j.surfrep.2009.12.001 [DOI] [Google Scholar]
- 13.Roy S., Covert P. A., FitzGerald W. R., and Hore D. K., “Biomolecular structure at solid–liquid interfaces as revealed by nonlinear optical spectroscopy,” Chem. Rev. 114, 8388–8415 (2014). 10.1021/cr400418b [DOI] [PubMed] [Google Scholar]
- 14.Shen Y. R., “Phase-sensitive sum-frequency spectroscopy,” Annu. Rev. Phys. Chem. 64, 129–150 (2013). 10.1146/annurev-physchem-040412-110110 [DOI] [PubMed] [Google Scholar]
- 15.Shen Y. R. and Ostroverkhov V., “Sum-frequency vibrational spectroscopy on water interfaces: Polar orientation of water molecules at interfaces,” Chem. Rev. 106, 1140–1154 (2006). 10.1021/cr040377d [DOI] [PubMed] [Google Scholar]
- 16.Chang R. K., Ducuing J., and Bloembergen N., “Relative phase measurement between fundamental and second-harmonic light,” Phys. Rev. Lett. 15, 6–8 (1965). 10.1103/PhysRevLett.15.6 [DOI] [Google Scholar]
- 17.Superfine R., Huang J. Y., and Shen Y. R., “Experimental determination of the sign of molecular dipole moment derivatives: An infrared-visible sum frequency generation absolute phase measurement study,” Chem. Phys. Lett. 172, 303–306 (1990). 10.1016/0009-2614(90)85408-5 [DOI] [Google Scholar]
- 18.Ji N., Ostroverkhov V., Chen C.-Y., and Shen Y.-R., “Phase-sensitive sum-frequency vibrational spectroscopy and its application to studies of interfacial alkyl chains,” J. Am. Chem. Soc. 129, 10056–10057 (2007). 10.1021/ja071989t [DOI] [PubMed] [Google Scholar]
- 19.Nihonyanagi S., Yamaguchi S., and Tahara T., “Direct evidence for orientational flip-flop of water molecules at charged interfaces: A heterodyne-detected vibrational sum frequency generation study,” J. Chem. Phys. 130, 204704-1–204704-5 (2009). 10.1063/1.3135147 [DOI] [PubMed] [Google Scholar]
- 20.de Beer A. G. F., Samson J.-S., Hua W., Huang Z., Chen X., Allen H. C., and Roke S., “Direct comparison of phase-sensitive vibrational sum frequency generation with maximum entropy method: Case study of water,” J. Chem. Phys. 135, 224701-1–224701-9 (2011). 10.1063/1.3662469 [DOI] [PubMed] [Google Scholar]
- 21.Yang P.-K. and Huang J. Y., “Phase-retrieval problems in infrared-visible sum-frequency generation spectroscopy by the maximum-entropy method,” J. Opt. Soc. Am. B 14, 2443–2448 (1997). 10.1364/JOSAB.14.002443 [DOI] [Google Scholar]
- 22.Yang P.-K. and Huang J. Y., “Model-independent maximum-entropy method for the analysis of sum-frequency vibrational spectroscopy,” J. Opt. Soc. Am. B 17, 1216–1222 (2000). 10.1364/JOSAB.17.001216 [DOI] [Google Scholar]
- 23.de Beer A. G. F., Chen Y., Scheu R., Conboy J. C., and Roke S., “Analysis of complex spectra using Fourier filtering,” J. Phys. Chem. C 117, 26582–26587 (2013). 10.1021/jp406161n [DOI] [Google Scholar]
- 24.Sovago M., Vartiainen E., and Bonn M., “Erratum: Observation of buried water molecules in phospholipid membranes by surface sum-frequency generation spectroscopy.,” J. Chem. Phys. 133, 229901-1–229901-2 (2010). 10.1063/1.3511705 [DOI] [PubMed] [Google Scholar]
- 25.Sovago M., Vartiainen E., and Bonn M., “Determining absolute molecular orientation at interfaces: A phase retrieval approach for sum frequency generation spectroscopy,” J. Phys. Chem. C 113, 6100–6106 (2009). 10.1021/jp810123g [DOI] [Google Scholar]
- 26.Sovago M., Vartiainen E., and Bonn M., “Observation of buried water molecules in phospholipid membranes by surface sum-frequency generation spectroscopy,” J. Chem. Phys. 131, 161107-1–161107-4 (2009). 10.1063/1.3257600 [DOI] [PubMed] [Google Scholar]
- 27.Ostroverkhov V., Waychunas G. A., and Shen Y. R., “New information on water interfacial structure revealed by phase-sensitive surface spectroscopy,” Phys. Rev. Lett. 94, 046102-1–046102-4 (2005). 10.1103/PhysRevLett.94.046102 [DOI] [PubMed] [Google Scholar]
- 28.Nowakowski P. J., Woods D. A., Bain C. D., and Verlet J. R. R., “Time-rsolved phase-sensitive second harmonic generation spectroscopy,” J. Chem. Phys. 142, 084201-1–084201-8 (2015). 10.1063/1.4909522 [DOI] [PubMed] [Google Scholar]
- 29.Pool R. E., Versluis J., Backus E. H. G., and Bonn M., “Comparative study of direct and phase-specific vibrational sum-frequency generation spectroscopy: Advantages and limitations,” J. Phys. Chem. B 115, 15362–15369 (2011). 10.1021/jp2079023 [DOI] [PubMed] [Google Scholar]
- 30.Tian C. S. and Shen Y. R., “Sum-frequency vibrational spectroscopic studies of water/vapor interfaces,” Chem. Phys. Lett. 470, 1–6 (2009). 10.1016/j.cplett.2009.01.016 [DOI] [Google Scholar]
- 31.Velarde L. and Wang H.-F., “Unified treatment and measurement of the spectral resolution and temporal effects in frequency-resolved sum-frequency generation vibrational spectroscopy (SFG-VS),” Phys. Chem. Chem. Phys. 15, 19970–19984 (2013). 10.1039/c3cp52577e [DOI] [PubMed] [Google Scholar]
- 32.See supplementary material at http://dx.doi.org/10.1063/1.4932180 E-JCPSA6-143-024538 for details about the iMEMfit graphic user interface as well as for the residuals from fitting the simulated spectrum.
Associated Data
This section collects any data citations, data availability statements, or supplementary materials included in this article.
Data Citations
- See supplementary material at http://dx.doi.org/10.1063/1.4932180 E-JCPSA6-143-024538 for details about the iMEMfit graphic user interface as well as for the residuals from fitting the simulated spectrum.


