Abstract
Purpose:
Current dosimetry methods in mammography assume that the breast is comprised of a homogeneous mixture of glandular and adipose tissues. Three-dimensional (3D) dedicated breast CT (bCT) data sets were used previously to assess the complex anatomical structure within the breast, characterizing the statistical distribution of glandular tissue in the breast. The purpose of this work was to investigate the effect of bCT-derived heterogeneous glandular distributions on dosimetry in mammography.
Methods:
bCT-derived breast diameters, volumes, and 3D fibroglandular distributions were used to design realistic compressed breast models comprised of heterogeneous distributions of glandular tissue. The bCT-derived glandular distributions were fit to biGaussian functions and used as probability density maps to assign the density distributions within compressed breast models. The MCNPX 2.6.0 Monte Carlo code was used to estimate monoenergetic normalized mean glandular dose “DgN(E)” values in mammography geometry. The DgN(E) values were then weighted by typical mammography x-ray spectra to determine polyenergetic DgN (pDgN) coefficients for heterogeneous (pDgNhetero) and homogeneous (pDgNhomo) cases. The dependence of estimated pDgN values on phantom size, volumetric glandular fraction (VGF), x-ray technique factors, and location of the heterogeneous glandular distributions was investigated.
Results:
The pDgNhetero coefficients were on average 35.3% (SD, 4.1) and 24.2% (SD, 3.0) lower than the pDgNhomo coefficients for the Mo–Mo and W–Rh x-ray spectra, respectively, across all phantom sizes and VGFs when the glandular distributions were centered within the breast phantom in the coronal plane. At constant breast size, increasing VGF from 7.3% to 19.1% lead to a reduction in pDgNhetero relative to pDgNhomo of 23.6%–27.4% for a W–Rh spectrum. Displacement of the glandular distribution, at a distance equal to 10% of the compressed breast width in the superior and inferior directions, resulted in a 37.3% and a −26.6% change in the pDgNhetero coefficient, respectively, relative to the centered distribution for the Mo–Mo spectrum. Lateral displacement of the glandular distribution, at a distance equal to 10% of the compressed breast width, resulted in a 1.5% change in the pDgNhetero coefficient relative to the centered distribution for the W–Rh spectrum.
Conclusions:
Introducing bCT-derived heterogeneous glandular distributions into mammography phantom design resulted in decreased glandular dose relative to the widely used homogeneous assumption. A homogeneous distribution overestimates the amount of glandular tissue near the entrant surface of the breast, where dose deposition is exponentially higher. While these findings are based on clinically measured distributions of glandular tissue using a large cohort of women, future work is required to improve the classification of glandular distributions based on breast size and overall glandular fraction.
Keywords: Monte Carlo, mammography, glandular dose, dosimetry, breast CT
1. INTRODUCTION
Radiation dosimetry for mammography has developed considerably since the 1970s.1 The currently accepted metric for breast dose is the mean glandular dose; this metric acknowledges that it is the fibroglandular component of the breast that is the tissue at radiation risk. Skin and adipose tissues are also present, but these tissues have much lower radiosensitivity, and cancers that arise from them are not breast cancers per se. To compute mean glandular dose (MGD or Dg), it is standard practice to use normalized Dg coefficients, routinely known as DgN coefficients.
Over the years, a number of authors have published comprehensive DgN values for clinically relevant x-ray beam spectra, which have evolved slightly as the x-ray spectra used for breast imaging have changed with the introduction of digital mammography and more recently, breast tomosynthesis. For example, the transition from molybdenum and rhodium anode (and filter) materials to tungsten anodes with a number of new filter materials (e.g., silver and aluminum) has required new tables of DgN coefficients.2–4 Most (if not all) historical tabulations of DgN coefficients have assumed a completely homogeneous distribution of glandular tissue throughout the breast parenchyma. This homogeneous distribution assumes that glandular tissue is perfectly mixed with adipose tissue, forming a uniform medium of breast tissue ranging from 0% glandular/100% adipose to 100% glandular/0% adipose (and everything in between). The models used for Monte Carlo evaluation of DgN values also assume that the homogeneous breast medium is surrounded by a layer of skin, with an assumed thickness of 4–5 mm.
Through the development of breast CT (bCT), which allows for a true three-dimensional (3D) depiction of breast anatomy, the skin of the breast was found to be thinner than what was assumed in the past,5 and the range of breast glandular fractions is far smaller than the 0%/50%/100% “breast density” that was assumed for several decades.6,7 The availability of comprehensive bCT image data sets has also allowed a relatively comprehensive assessment of the 3D distribution of glandular tissue in the breast.6 Recent work by Dance,8 Sechopoulos,9 and others have alluded to the heterogeneous distribution of glandular tissue in the breast. Dance used simulations of computer-generated textured phantoms and found the glandular dose was overestimated by 10%–43% using the homogeneous approximation. Although that study alluded to the importance of investigating the effect of assuming a simple homogeneous phantom on glandular breast dose in mammography, no comparison was made to clinically measured glandular distributions and they used a single mammographic x-ray spectrum for the simulations. Sechopoulos used simulated mechanical compression of twenty bCT data sets and found that, on average, the homogeneous assumption overestimates the normalized glandular dose by 27%. While that study provided concrete evidence of the overestimation using the homogeneous assumption, the small data set (N = 20) used might not be representative of the general population, motivating this work.
In this investigation, we mathematically model the previously reported 3D distribution of glandular tissue in bCT geometry using a large cohort of bCT data sets and use this spatial distribution information to compute DgN values using Monte Carlo techniques based upon the heterogeneous distribution of glandular tissue. Monte Carlo techniques are also used to compute dose based upon the historical homogeneous distributions of glandular tissue, allowing for comparisons to be made between the homogeneous and heterogeneous models, across a range of other parameters such as x-ray technique, breast size, 3D shifts in the glandular distribution, and overall glandular fraction.
2. METHODS AND MATERIALS
2.A. Compressed breast phantom design: Geometry and composition
Previous work in our laboratory characterized several breast anatomical metrics using a large cohort (N = 219) of bCT data sets.6 Of the 219 bCT data sets, ten were healthy women volunteers, and the remaining were women who were at a high degree of suspicion for breast cancer after their conventional imaging (BIRADS 4 and 5). The age of the women in this study ranged between 35 and 82 yr with a median age of 54. The BIRADS breast densities were also known: 9.0% were fatty, 28.5% were scattered, 39.0% were heterogeneous, and 23.5% were extremely dense. In this previous study, 219 single bCT data sets from 210 women (bilateral bCT data sets from nine women) were used to analyze breast shape and composition.
The breast diameter, volume, and volumetric glandular fraction (VGF) data reported from this study were used to design several compressed breast phantoms representing the breast parenchyma population. The VGF is defined as the ratio of glandular breast tissue volume to total breast tissue volume (excluding skin). The breast diameters of all 219 bCT data sets were grouped into 0–20th, 40–60th, and 80–100th percentiles corresponding to small, medium, and large breast phantom sizes, respectively. This choice of percentiles was used for the purpose of representing the average and extrema of breast sizes.
Several assumptions were made in order to convert the pendant breast geometry of bCT to the compressed breast geometry typical of mammography. At our institution, a clinical trial was performed from 2009 to 2010 to image patients on a bCT system, a mammography system, and a tomosynthesis system on the same day. Using these patient data sets, the bCT-derived breast diameter at the chest wall was measured using previously developed methods for 38 of these patients.6 These data were plotted against the compressed thicknesses reported on the mammography system and fit using linear regression in order to interpolate the compressed breast thickness for the three breast diameter percentile groups.
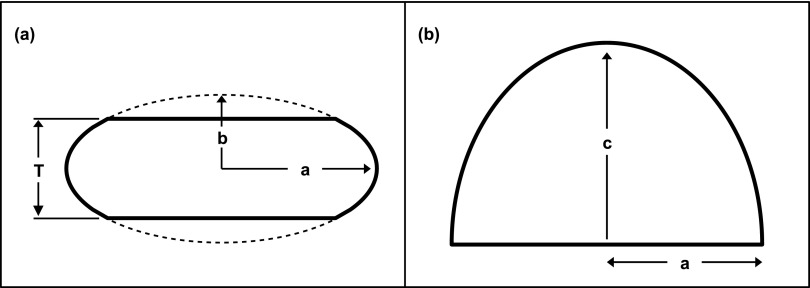
Earlier work that was conducted with much less sophisticated simulation tools used a semielliptical cylindrical shape to represent the mathematical breast phantom used for simulating glandular dose.10 However, this model is not a realistic shape found clinically; thus, truncated half-ellipsoids were used in the simulations as depicted in Fig. 1. To preserve the phantom shape for all phantom sizes, the minor radius b was defined to be proportional to the compressed thickness T as shown in Fig. 1(a). In consultation with an experienced breast radiologist, the simulations used a proportionality factor of 0.65 to describe the truncated ellipsoid curvature representing a realistic compressed breast.
FIG. 1.
Diagrams show the (a) coronal and (b) cranial–caudal views of the truncated-half ellipsoids used to represent a compressed breast.
Forty five cranial–caudal mammograms were used to estimate the half elliptical shapes as shown in Fig. 1(b). The mammograms were manually outlined and grouped into the largest 10% (five outlines) and the smallest 10% (five outlines), with the remaining outlines defining the average breast shape. The aspect ratio, equal to c/a [see Fig. 1(b)], was calculated for all 45 mammograms, with values of 1.30, 1.25, and 1.39 for the small, medium, and large breast shapes, respectively, and a mean aspect ratio of 1.31. For simplicity, an aspect ratio of 1.31 was used for all simulations.
Finally, the bCT-derived phantom volumes were used to scale the phantom to the correct dimensions in order to preserve the previously described geometrical considerations. A skin layer of 1.5 mm (not shown in Fig. 1) was assumed to enclose each breast phantom within the surfaces defined by the three elliptic radii a, b, and c. The 1.5 mm skin thickness was based on previously published results using 100 bCT volume data sets.5 High-resolution voxelized phantoms were employed in the simulations to model these truncated half ellipsoids with a 0.5 mm isotropic voxel size.
2.B. Heterogeneous phantom design using bCT-derived glandular distributions
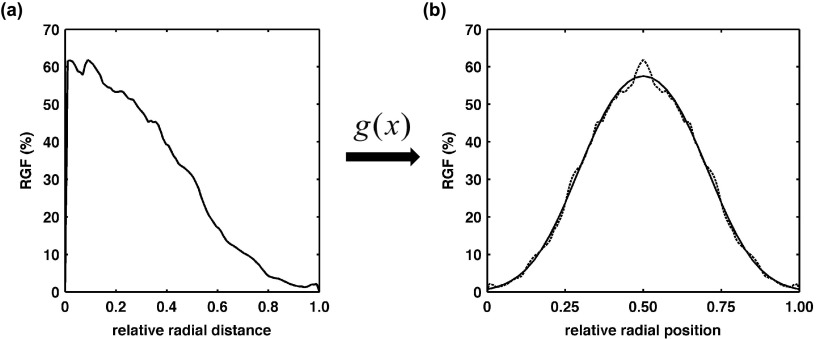
Heterogeneous glandular distributions were quantified in a large cohort study (N = 219) using segmented bCT volume data sets.6 Only relevant details are mentioned here. The radial glandular fraction, RGF, of a coronal bCT image was computed as the fraction of pixels marked as glandular around a circle with a radius r (relative radial distance), originating from the center of mass in the image. Detailed glandular distributions were obtained from each bCT volume data set by evenly dividing into the posterior (R1), middle (R2), and anterior (R3) breast regions. The RGF of a breast region was defined as the average RGF over five coronal images centered in each of the three breast regions. For a detailed diagram of this methodology, refer to Figs. 1 and 2 in the published work of Huang et al.6 This process was repeated for all 219 bCT data sets, categorized by bra cup sizes (A, B, C, and D) and breast regions (R1, R2, and R3). The RGF for each cup size resulted in half-Gaussian shaped distributions within each of the three breast regions. Given this, Gaussian functions were fitted to these previously published RGFs. A biGaussian function g(x) was used in the fitting routine because it minimized the root mean squared error when compared with a single Gaussian function for all cup sizes and regions. Equation (1) describes the biGaussian function used to fit all bCT-derived RGFs,
| (1) |
where A1,2 are the amplitudes, B1,2 are the positions of the centers, and σ1,2 are the standard deviations of the first and second Gaussian terms. The full width at half maximum (FWHM) and relative spacing between the two Gaussian terms (Δ) were defined as
| (2) |
| (3) |
and used as metrics to describe g(x) for each RGF distribution previously reported.6 The fitting routine was implemented in matlab and constrained so that g(x) was symmetric which in turn provided equivalent values for the FWHM.
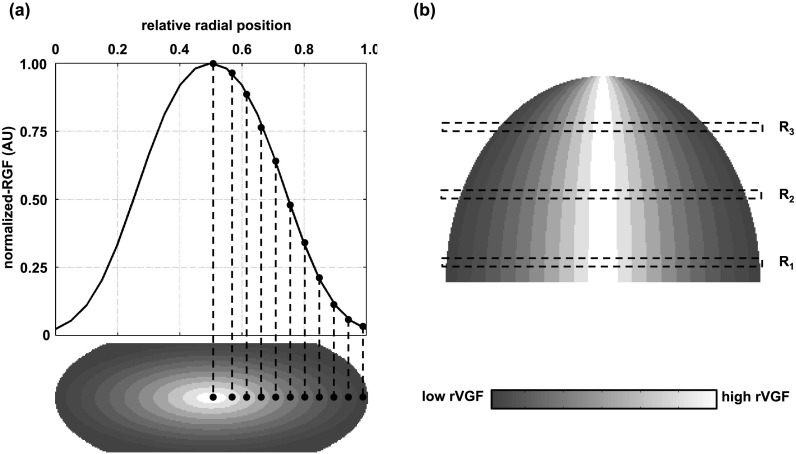
Figure 2 is a diagram depicting how a fitted RGF distribution was incorporated into the compressed breast phantoms used in this study to characterize the probabilistic distribution of glandular tissue in the breast. To facilitate ease in discussion, let us define the volumetric glandular fraction for a given contoured region as the regional volumetric glandular fraction (rVGF). Concentric half ellipsoids were used to create contoured regions each of a constant rVGF within the breast tissue, as shown in Fig. 2. The rVGF vector is not the VGF which is a scalar descriptor for the entire breast volume. In the coronal view [Fig. 2(a), bottom], the largest contoured elliptical region was defined with a major radius equal to the major radius of the truncated ellipse [i.e., “a,” as defined in Fig. 1(a)] and a minor radius equal to half the compressed thickness. The remaining contoured regions were defined by decreasing the elliptical radii in the coronal plane by equal intervals until reaching the centermost region of the compressed phantom. In the axial plane (i.e., cranial–caudal projection), the major radius of all contoured regions was fixed at the anterior edge of the breast phantom as shown in Fig. 2(b). An example of a fitted RGF distribution is shown on the top row of Fig. 2(a) which was interpolated at equal intervals and used to assign rVGF values to each contoured region. For ease in visualization, 11 contoured regions are shown in Fig. 2, but for the present work, 21 contoured regions were used.
FIG. 2.
(a) Schematic showing incorporation of a Gaussian-shaped radial glandular distribution (top) into contoured regions of the compressed breast phantom (bottom). (b) Cranial–caudal view of contoured breast phantom showing shape of ellipsoidal contoured regions and three coronal regions for reference with the work of Huang et al. (Ref. 6). R1 is the posterior region, R2 is the middle region, and R3 is the anterior region.
Using the fitted RGF distributions as a map for assigning rVGF values to each contoured region, the following methodology was employed to allocate which voxels were composed of glandular breast tissue and which were composed of adipose breast tissue: A uniform probability distribution of N discrete values on the interval 0 to 1 (produced by a random number generator) was scaled such that the mean value corresponded to a specific rVGF, where N is the number of voxels within the specified region. A single value was then sampled from the uniform probability distributions for each voxel within that region. If the sampled value was greater than the rVGF assigned to that region, then the voxel was assigned as adipose tissue and if the sampled value was less than or equal to the rVGF, then the voxel was assigned as glandular tissue. This process was repeated for all 21 contoured regions in the phantom model resulting in a complete description of the breast tissue composition incorporating the bCT-derived RGF distributions. All fitted RGF distributions were normalized to the maximum (i.e., centroid) value. The centroid rVGF value was therefore used to scale each phantom volume to a specific VGF.
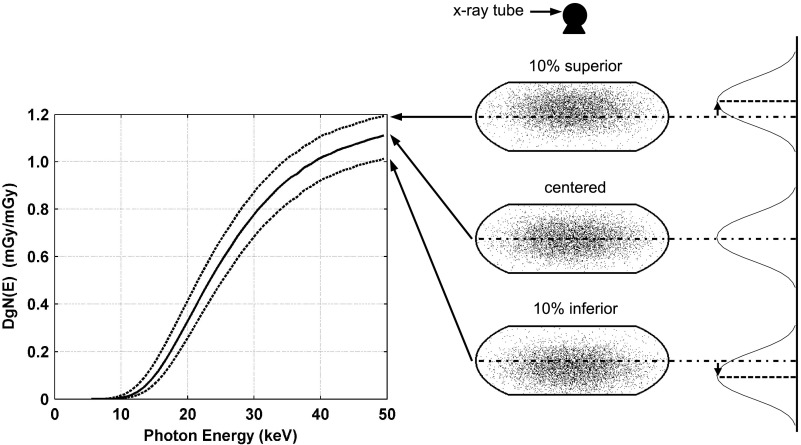
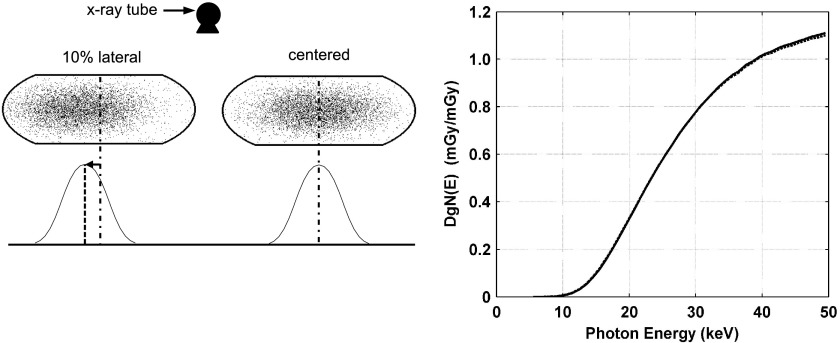
The aforementioned introduction of bCT-derived glandular distributions into the compressed breast phantoms assumes that the distributions are centered in the coronal plane as shown in the bottom row of Fig. 2(a). However, Huang et al. reported that there is a slight offset (∼10%) in the inferior direction.6 To address the robustness of the resulting glandular dose on the position of the center of the distribution, the centroid was shifted in the superior, inferior, and lateral directions for the medium-sized phantom. Specifically, the centroid was shifted in both the superior and inferior directions a distance of 10% of the compressed breast thickness. The distribution was also shifted in the lateral direction a distance of 10% of the compressed breast width “2a” [Fig. 1(a)]. The Monte Carlo phantom model explicitly assumed a skin thickness of 1.5 mm.
2.C. Monte Carlo modeling of mammography geometry
The Monte Carlo N-particle eXtended radiation transport code (MCNPX 2.6.0) was used to simulate x-ray energy deposition in compressed breast phantoms using a conventional mammography system geometry. An isotropic point source of monoenergetic x-rays was simulated to be incident upon a 30 × 20 cm detection plane located at a source-to-detector distance (SID) of 70 cm. This small field-of-view (FOV), relative to the conventional 29 × 24 cm FOV, was used in the present simulations to achieve efficient photon transport since even the largest phantom was well within this area. No compression paddle or support plate was included in the simulation model and an air gap of 2.5 cm was defined between the bottom of the breast volume and the detection plane. Each voxelized breast phantom was centered about the long dimension of the detection plane with the chest wall edge coincident with the central ray. This phantom placement is used routinely in mammography practice. A large cubical volume of water was defined posterior to the breast phantom and outside the primary beam path to include the effects of backscatter from the patient’s body.
2.D. Monte Carlo simulation of glandular dose
For the homogeneous breast phantoms, each voxel within the breast tissue represented a homogeneous mixture of adipose and glandular tissues. The elemental composition of the skin, glandular tissue, and adipose tissue was taken from the American Association of Physicists in Medicine (AAPM) Task Group 195.11 The elemental mass fractions and density for each tissue composition was determined using the weight fraction of glandular tissue (fg), which is equivalent to the VGF since the density of 100% glandular breast tissue is constant.
To estimate the dose deposited to the glandular tissue in voxels composed of a homogeneous mixture of glandular and adipose tissues, the energy deposition was weighted by the ratio of mass energy absorption coefficients “μen/ρ,” known as the “G” factor in previously published work2 and shown here,
| (4) |
where μen(e)/ρ is the energy-dependent mass energy absorption coefficient for that particular material. The dose deposited to the glandular tissue in these homogeneous voxels was accomplished in MCNPX by tallying the total energy deposition in 1 keV energy bins and multiplying by the energy-dependent G(fg, e) factor for each energy bin. The 1 keV energy binning corresponds to the energy of the incident photon causing the energy deposition. The μen(e)/ρ values for glandular and adipose tissues were taken from the NIST XCOM database. After determining the total energy deposited to the glandular tissue, the mean glandular dose was computed and normalized to the entrance skin air kerma with no breast present. The following equation was used to determine the monoenergetic normalized mean glandular dose coefficient “DgN(E)” for the homogeneous breast phantom simulations:
| (5) |
where E is the monoenergetic photon energy, Etdeposit(e) is the total energy deposited in the breast tissue “t” within a 1 keV energy bin denoted by “e,” Mt is the total mass of the breast tissue excluding skin, the “fgMt” term is the total mass of glandular tissue within the breast, and K(E) is the entrance skin air kerma at photon energy E which was determined by first simulating the x-ray fluence within a 1 cm2 surface located 4 cm anterior from the central ray and 70 cm from the monoenergetic x-ray source. The x-ray fluence tally was then converted to air kerma using the conversion factor derived by Johns12 relating fluence to air kerma. Finally, the air kerma value was scaled by the inverse square law to the distance of the entrance skin surface for a given compressed breast thickness. The remaining terms in Eq. (5) are described above. The summation in Eq. (5) is over all 1 keV energy bins spanning from 1 keV to the maximum source photon energy E. Therefore, the numerator of Eq. (5) is essentially the total energy deposited only in the glandular tissue.
For the heterogeneous breast phantoms, the voxelized breast tissue contained voxels of either glandular tissue or adipose tissue, but were not mixed. This heterogeneous composition provided a much simpler simulation approach since only the energy deposition that occurred in the glandular voxels need be recorded. The DgN(E) values for the heterogeneous phantom simulations were computed using the following equation:
| (6) |
where Egdeposit is the total energy deposited in all glandular voxels (including scatter), ng is the total number of glandular voxels within the breast volume, mg is the mass of a single glandular voxel, and K(E) is again the entrance skin kerma at photon energy E.
Monoenergetic x-ray photons at 1 keV intervals were simulated to be incident upon both the heterogeneous and homogeneous compressed breast phantom models. The lowest simulated energy was 5 keV and the highest was held at 50 keV to cover the range of energies used in modern mammography systems. All heterogeneous phantom simulations were run with 5 × 10⁷ source photons at each monoenergetic source energy in order to obtain a relative error of <1.0% for the total energy deposition tallies. The number of source photons was increased to 4 × 10⁸ for the homogeneous phantom simulations because the total energy deposition tally was binned into 1 keV energy bins and therefore, more source photons were needed to obtain a relative error of <1.0% for each energy deposition tally. MCNPX normalizes all tallies to the number of source photons; however, only photons traveling toward the breast phantom are of interest. Accordingly, the solid angle subtended by the breast phantom was used to renormalize all energy deposition and x-ray fluence tallies to be per incident photon.
2.E. Glandular dose comparisons between the heterogeneous and homogeneous phantom models
The mean difference in the DgN(E) values between the heterogeneous and homogeneous breast phantom models was computed. Only DgN(E) values above 0.1 mGy ⋅ mGy−1 were used in the analysis in order to reduce the potential impact of large differences at very low glandular dose levels. In addition, the reported DgN(E) values were weighted by x-ray spectra used clinically at our institution to produce polyenergetic DgN (pDgN) coefficients as commonly found in the literature2,3,10,13 and reported on modern mammography systems. The x-ray spectra parameters used in this work were taken from a medical physicist’s recent mammography QC test for the Hologic Selenia and Hologic Selenia Dimensions systems (Hologic, Inc., Bedford, MA) used routinely at the UC Davis Medical Center. These units utilize molybdenum and tungsten targets, respectively. The technique charts in the QC reports provided the kV, filtration material, and measured HVL used in each system for a given compressed thickness. The Mo and W x-ray spectra were generated using the TASMICS (Ref. 14) and MASMICS (in preparation) mathematical spectral models, respectively. The difference in DgN was computed in pDgN coefficients between the heterogeneous and homogeneous phantom models.
2.F. Validation of heterogeneous phantom design
In order to validate the heterogeneous simulation methodology outlined in Sec. 2.D, the process of assigning glandular voxels based on sampling from a uniform probability distribution required validation. This was accomplished by comparing the homogeneous glandular dose within a breast phantom using homogeneous voxels composed of a mixture of glandular/adipose breast tissue or heterogeneous voxels composed of either glandular or adipose tissue, but not mixed. The later approach is identical to the methods used for the heterogeneous breast model, outlined in Sec. 2.D, but without any spatial dependence (i.e., no contoured regions). In addition, to assess the reproducibility of the heterogeneous simulation methodology, two separate uniform probability distributions were used to create two separate heterogeneous phantom models with identical VGFs.
2.G. Comparison of glandular dose simulations in MCNPX with previous studies
The methods reported here for estimating glandular dose in MCNPX were compared with the previous results of Boone2,3 and Wu et al.10,13 These studies used regular shaped breast phantoms of various compressed thicknesses and homogeneous glandular densities. Accordingly, a breast phantom shape identical to the work of Wu et al. was simulated in MCNPX and used for comparison. The analysis was performed for 0% and 50% glandular breasts with a skin thickness of 4 mm and compressed thicknesses of 3, 5, and 7 cm.
Boone reported DgN(E) values for photon energies from 5 to 50 keV, and these were compared with the present simulation methodology.3 DgN(E) values for the 0% glandular breasts were computed by linear extrapolation of 2% and 5% glandular breast simulation results. Wu et al. reported pDgN coefficients which were weighted by mammographic Mo x-ray spectra used routinely in the early 1990s.10 The MASMICS (in preparation) spectral model was used to generate Mo x-ray spectra from 23 to 31 kV, in 2 kV intervals, with half-value layers identical to those of Wu et al. This set of x-ray spectra was then used to spectrally weight the DgN(E) values for the present MCNPX simulations and compared directly with the results of Wu et al.
3. RESULTS
3.A. Phantom design
Table I shows the resulting mean diameter and volume for the small, medium, and large size phantoms, along with the mean VGF. In order to address the effect of differences in breast density, three different VGFs were used for the medium-sized phantom corresponding to the 25th, 50th, and 75th percentiles as outlined in Table I. The interpolated compressed breast thicknesses for each breast diameter along with the compressed elliptical radii (see Fig. 1) are also reported in Table I.
TABLE I.
Geometry and composition specifications for compressed breast phantoms based on bCT-derived anatomical metrics. The skin thickness was 1.5 mm for all phantom sizes and compositions.
| Pendant (bCT) geometry | Compressed (ellipsoid) | ||||||||
|---|---|---|---|---|---|---|---|---|---|
| VGF (%) | |||||||||
| Phantom | Percentile | Mean diameter (cm) | Mean volume (cm3) | 25th | 50th | 75th | T: thickness (cm) | a (cm) | c (cm) |
| Small | 0–20th | 9.5 | 323.4 | 17.0 | 4.7 | 12.9 | 8.4 | ||
| Medium | 40–60th | 12.7 | 744.7 | 7.3 | 12.6 | 19.1 | 6.2 | 17.1 | 11.1 |
| Large | 80–100th | 15.4 | 1301.4 | 7.0 | 7.4 | 20.6 | 13.4 | ||
3.B. Comparison of homogeneous glandular dose simulations in MCNPX with previous studies
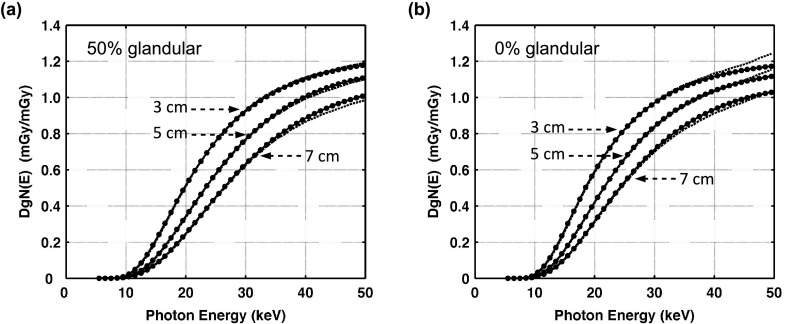
Figure 3 shows the results of comparing the monoenergetic normalized mean glandular dose DgN(E) estimations to previously reported work by Boone. Qualitative agreement was assessed by calculating the mean difference for DgN(E) values greater than 0.1 mGy ⋅ mGy−1 in order to alleviate any potential impact of relatively large differences at low dose values. For the 50% glandular breast, the mean differences (and SDs) averaged over photon energies from 5 to 50 keV, were −0.2% (1.6), −1.3% (0.8), and −2.1% (0.7) for the 3, 5, and 7 cm compressed breast thicknesses. For the 0% glandular breast, the mean differences (and SDs) averaged over photon energies from 5 to 50 keV were −0.2% (2.5), −0.5% (1.3), and −2.0% (0.8) for the 3, 5, and 7 cm compressed breast thicknesses. Considering the different radiation transport codes used by Boone2 (TART 97, LLNL 1997), the DgN(E) values observed in this work were in excellent agreement for 0% and 50% glandular breasts.
FIG. 3.
Graphs show DgN(E) values reported by Boone (Ref. 3) (solid line) in comparison with the DgN(E) values from the present simulations using MCNPX (dashed lines) for breast compositions of (a) 50% glandular and (b) 0% glandular. No data points are shown for the present DgN(E) values for ease in visual comparison. The DgN values reported in this figure, averaged over all breast thicknesses and photon energies, differed from Boone by −1.2% for the 50% glandular breast and −0.7% for the 0% glandular breast.
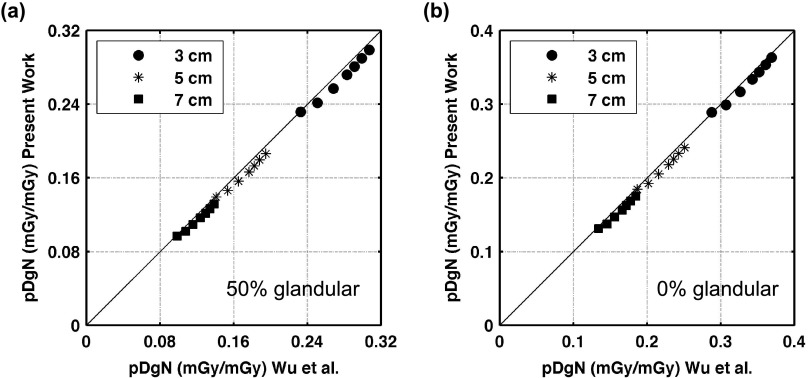
Figure 4 shows the results of comparing the polyenergetic normalized mean glandular dose “pDgN” estimations to previously reported work by Wu et al. For the 50% glandular breast, the mean differences (and SDs) averaged over tube potentials from 23 to 35 kV (in 2 kV increments) were −3.2% (1.3), −4.6% (1.5), and −5.3% (1.5) for the 3, 5, and 7 cm compressed breast thicknesses. For the 0% glandular breast, the mean differences (and SDs) averaged over tube potentials from 23 to 35 kV (in 2 kV increments) were −2.0% (1.2), −4.1% (1.3), and −5.2% (1.3) for the 3, 5, and 7 cm compressed breast thicknesses. All pDgN coefficients reported in this comparison are slightly lower than, but consistent with those of Wu et al. The slight differences can likely be attributed to the different spectral models used in this study than that used by Wu et al.10,13 The present simulations exhibit excellent correlation with the work of Wu et al.; for the 0% glandular breast, the linear regression coefficient of determination, r2 = 0.999 and for the 50% glandular breast, the r2 = 0.999.
FIG. 4.
Graphs showing comparison of pDgN results from the present MCNPX simulations against the work of Wu et al. for a breast composition of (a) 50% glandular and (b) 0% glandular. Individual data points represent DgN values obtained for various breast thicknesses and tube potentials from 23 to 35 kV (in 2 kV increments). The DgN values reported in this figure, averaged over all breast thicknesses and tube potentials, differed from Wu et al. by −4.3% for the 50% glandular breast and −3.8% for the 0% glandular breast. The lines indicate y = x, absolute agreement between the DgN values reported in the present work and those of Wu et al.
3.C. Heterogeneous phantom design using bCT-derived glandular distributions
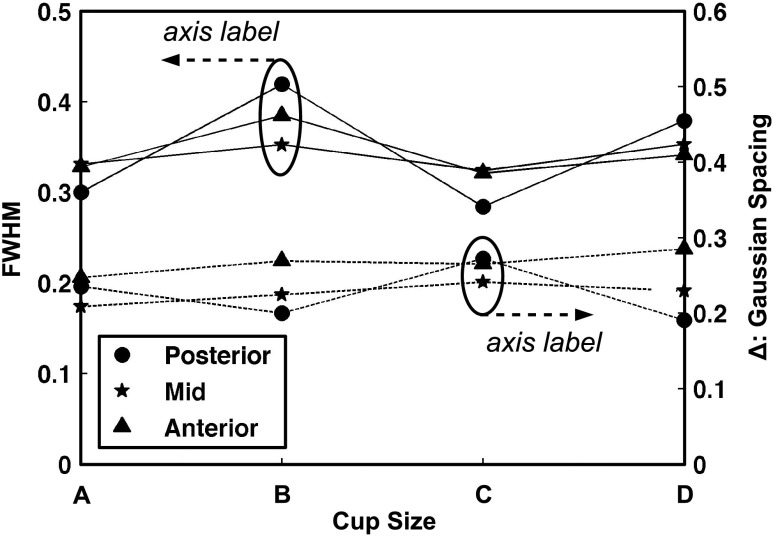
Figure 5(a) is an example distribution of the mean RGF taken directly from the published results of Huang et al.6 The maximum value of the RGF distribution was used as the centroid location in order to create a symmetric Gaussian-shaped distribution as shown by the dotted line in Fig. 5(b). The solid line in Fig. 5(b) is an example of the fitting results using “g(x)” [Eq. (1)] described in Sec. 2.B. Figure 6 displays the FWHM results (solid lines) on the left axis and Gaussian spacing “Δ” results (dashed lines) on the right axis using the published RGF distributions for each cup size and coronal region (see legend). In general, Fig. 6 demonstrates no prominent trend in FWHM or Δ with cup size or coronal region. Therefore, the median FWHM and Δ across all cup sizes and regions (0.34 and 0.25, respectively) were used to create a single heterogeneous glandular distribution for all three phantom sizes using the methodology outlined in Sec. 2.B.
FIG. 5.
Graphs showing (a) a radial glandular fraction distribution example previously published (Huang et al.), and (b) the corresponding biGaussian fit results (solid line) for the symmetric RGF distribution (dashed line).
FIG. 6.
Graph showing the biGaussian fitting results for all cup sizes (A, B, C, and D) and coronal regions (posterior, mid, and anterior). The solid lines represent the FWHM with labels on the left axis and the dashed lines represent the spacing between each Gaussian term (Δ) with labels on the right axis.
3.D. Validation of heterogeneous phantom design
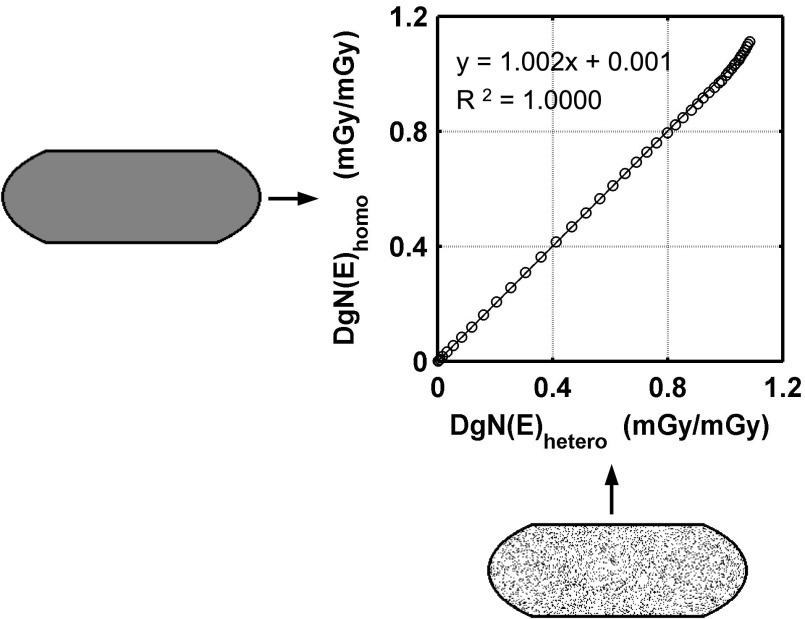
Figure 7 is an example of the correlation of DgN(E) coefficients between the homogeneous and heterogeneous voxel compositions for the small-sized phantom. The regression fit of the DgN(E) coefficients for the small, medium, and large-sized phantoms demonstrates satisfactory correlation (R2 = 1.000, 0.9998, and 0.9999, respectively) with the slope not significantly different from unity (1.001, 1.002, and 0.996, respectively) and an intercept approaching zero (0.001, 0.001, and 0.002, respectively). Two coronal slices through each phantom are also shown in Fig. 7 to further illustrate how each breast tissue composition is defined in the simulations. These coronal slices are drawn to scale representing relative sizes and the 1.5 mm skin boundary (solid black line). In addition, there is no statistically significant difference (p > 0.05, using paired t-test) between the trials when testing the reproducibility of heterogeneous DgN(E) values within the small, medium, and large-sized phantoms.
FIG. 7.
Graph showing comparison of DgN(E) results within the small phantom (V GF = 17.0%) for a homogeneous tissue composition using the homogeneous voxels (y-axis) and heterogeneous voxels (x-axis). Individual data points represent DgN(E) values for photon energies from 5 to 50 keV. No statistically significant difference was seen in the data (p = 0.117, using paired t-test).
3.E. Glandular dose comparisons between the heterogeneous and homogeneous phantom models
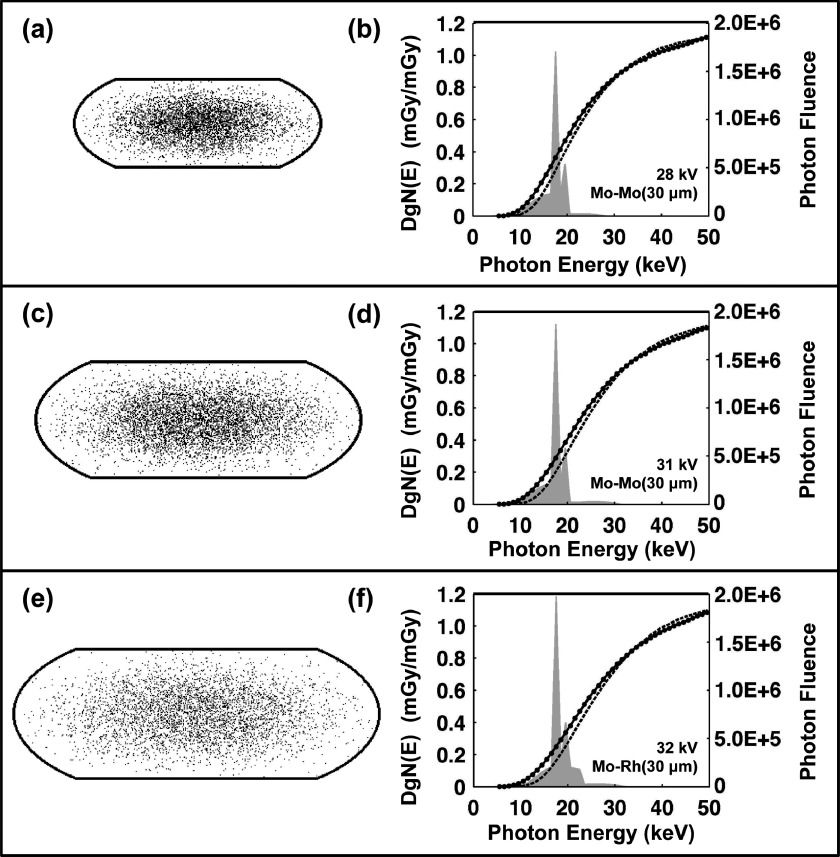
Coronal slices through the heterogeneous compressed phantom designs are illustrated in Figs. 8(a), 8(c), and 8(e) for the small, medium, and large-sized phantoms, respectively. The Gaussian-shaped glandular distributions (defined at the end of Sec. 2.B) are visible in these figures revealing a high concentration of glandular voxels (black) toward the center of the phantom and decreasing toward the 1.5 mm skin boundaries (solid black line). The DgN(E) comparisons shown in Figs. 8(b), 8(d), and 8(f) indicate that within the range of photon energies containing significant photon fluence (i.e., <30 keV for the Mo x-ray spectra shown), the DgN(E)hetero values were consistently lower than the DgN(E)homo values. The differences (and SDs) between DgN(E)homo and DgN(E)hetero values averaged across all photon energies (5–50 keV) were 5.9% (12.1), 7.3% (14.0), and 7.3% (14.2) for the small, medium, and large phantoms, respectively. While these differences seem relatively small, they include photon energies above the maximum tube potential (∼30 kV) used in conventional mammography. As seen in Fig. 8, the DgN(E)hetero values are slightly larger outside of this energy range (i.e., 30–50 keV) which decreases the resulting differences over all photon energies. Table II outlines the clinically relevant mammography spectra used for weighting the DgN(E) values shown in Fig. 8 to produce pDgN coefficients. pDgNhetero coefficients were on average 35.3% and 24.2% lower than pDgNhomo coefficients across all comparisons shown in Table II for the Mo and W x-ray spectra, respectively. For all phantom sizes and VGF values, the difference is greater for the Mo x-ray spectra than for the W x-ray spectra. This result can be attributed to the higher effective energy (i.e., penetration power) of the W x-ray beam (Eeffective = 18.1 keV) relative to the Mo x-ray beam (Eeffective = 15.7 keV) for a given phantom size. Using the present phantom designs, the differences in pDgN values increase with phantom size; however, it is important to note that the VGF is not constant across phantom sizes, so this result is multifaceted. Furthermore, the difference in pDgN values also increases with increasing VGF given a constant phantom size as shown by the three permutations in VGF for the medium-sized phantom.
FIG. 8.
Heterogeneous phantom designs for the (a) small, (c) medium, and (e) large size phantoms are shown. The black borders illustrate the 1.5 mm skin thickness and the black and white points within the skin depict the glandular and adipose voxels, respectively. Comparison of homogeneous (solid line) and heterogeneous (dashed line) DgN(E) values as a function of photon energy is also shown for the (b) small, (d) medium, and (f) large size phantoms. No data points are shown for the heterogeneous DgN(E) values for ease in visual comparison. Examples of clinically relevant molybdenum mammography x-ray spectra (shaded gray) are also shown along with the tube potential and target/filtration combinations used.
TABLE II.
Comparison results of the homogeneous and heterogeneous polyenergetic DgN (pDgN) values for all phantom sizes/compositions and x-ray techniques.
| Clinically relevant mammography spectra | pDgN (mGy/mGy) | |||||
|---|---|---|---|---|---|---|
| Phantom (VGF) | Target-filtera | kV | HVL (mm Al) | Homogeneous | Heterogeneous | Relative difference (%) |
| Small (17%) | Mo–Mo | 28 | 0.37 | 0.288 | 0.216 | −28.6 |
| W–Rh | 28 | 0.53 | 0.397 | 0.327 | −19.3 | |
| Medium (7.3%) | Mo–Mo | 31 | 0.40 | 0.255 | 0.180 | −34.5 |
| W–Rh | 31 | 0.56 | 0.351 | 0.277 | −23.6 | |
| Medium (12.6%) | Mo–Mo | 31 | 0.40 | 0.247 | 0.171 | −36.4 |
| W–Rh | 31 | 0.56 | 0.342 | 0.265 | −25.4 | |
| Medium (19.1%) | Mo–Mo | 31 | 0.40 | 0.239 | 0.161 | −39.0 |
| W–Rh | 31 | 0.56 | 0.332 | 0.252 | −27.4 | |
| Large (7.0%) | Mo–Rh | 32 | 0.47 | 0.250 | 0.170 | −38.1 |
| W–Ag | 30 | 0.62 | 0.335 | 0.260 | −25.2 | |
| Mo anode: mean (SD) | −35.3% (4.1) | |||||
| W anode: mean (SD) | −24.2% (3.0) | |||||
Mo–Mo (0.03 mm), Mo–Rh (0.03 mm), W–Rh (0.05 mm), and W–Ag (0.05 mm).
Averaged over all photon energies simulated, the change (and SDs) in DgN(E)hetero values was 15.6% (10.8) and −13.4% (5.8) for displacement of the glandular distribution in the superior and inferior directions, respectively, relative to the centered distribution as shown qualitatively in Fig. 9. It is well understood that there is relatively higher dose deposition in the breast tissue closer to the x-ray source location, a consequence of exponential attenuation. The higher DgN(E) values for the superior shift is a result of there being relatively more glandular voxels in the region that contains the highest dose deposition. Figure 10 depicts coronal slices of the glandular distributions and resulting DgN(E)hetero values for displacement of the distribution centroid in the lateral direction. Averaged over all photon energies, the change (and SD) in DgN(E)hetero values was 0.1% (1.1) for lateral displacement relative to the centered distribution. Table III shows the changes in pDgNhetero coefficients for displacement of the glandular distributions relative to the centered distribution. The largest decrease in pDgN coefficients is when the glandular distribution is displaced in the inferior direction. This is a consequence of a relative decrease in the amount of glandular voxels near the entrance surface of the breast where the dose is highest. These results illustrate that displacing the glandular distribution in the superior and inferior directions has a large impact on the resulting glandular dose relative to the centered configuration, whereas displacing the distribution in the lateral direction has little impact, as expected.
FIG. 9.
Graph comparing changes in DgN(E)hetero values in the medium-sized phantom resulting from displacing the glandular distribution in the superior and inferior directions (as shown on right). The centered distributions is denoted using a solid line and the shifted distributions are denoted using dotted lines. The location of the x-ray tube is shown for reference along with coronal slices through the voxelized phantoms.
FIG. 10.
Graph comparing changes in DgN(E) values in the medium-sized phantom resulting from displacing the glandular distribution in the lateral direction. The centered distribution is denoted using a solid line and the shifted distribution is denoted using dotted lines.
TABLE III.
Comparison results of heterogeneous polyenergetic DgN (pDgNhetero) values for displacement of the glandular distributions.
| Clinically relevant mammography spectra | ||||||
|---|---|---|---|---|---|---|
| Phantom (VGF) | Target /filtera | kV | HVL (mm Al) | Glandular distribution displacement | pDgNhetero (mGy/mGy) | Change (%) (relative to centered) |
| Medium (12.6%) | Mo–Mo | 31 | 0.4 | Centered | 0.169 | — |
| Superior | 0.232 | 37.3 | ||||
| Inferior | 0.124 | −26.6 | ||||
| Lateral | 0.173 | 2.4 | ||||
| W–Rh | 31 | 0.5 | Centered | 0.263 | — | |
| Superior | 0.338 | 28.5 | ||||
| Inferior | 0.205 | −22.1 | ||||
| Lateral | 0.267 | 1.5 | ||||
Mo–Mo (0.03 mm), W–Rh (0.05 mm).
4. DISCUSSION
The analysis comparing homogeneous with heterogeneous glandular tissue distributions in the breast clearly demonstrates that when the realistic heterogeneous glandular tissue distributions are considered, the DgN values are lower by about 25%–35% compared to the homogeneous distribution used in most previously reported DgN tables. This important finding is consistent with earlier observations by Dance8 and later by Sechopoulos.9 The contribution of this current work is that the glandular distributions used in this study were developed from a relatively large population average (N = 219) over a range of women with different age, breast density, ethnicity, and breast dimensions.
It should be emphasized that this work, reinforcing earlier work by Dance and Sechopoulos, strongly suggests that the radiation dose levels used for mammography for the past 3 decades have been overestimated by about 30%. The 30% overestimation corresponds to the average for a parameterization of the glandular distribution, thereby generalizing the distribution based on actual patient data. Therefore, the overestimation could be much greater on a patient-specific basis. In the case of the linear no threshold (LNT) model describing risk as a function of dose, the results from this study suggest that the radiation risks of breast cancer screening using mammography are lowered by this same factor. In the more likely case where the dose response relationship is not linear and has a threshold, the reduction in risk based upon these revised DgN coefficients may be even greater.
In this work, the glandular distribution evaluated in pendant-geometry bCT image data sets was modeled using a best-fit biGaussian distribution, and then this distribution was used in the case of the compressed breast geometry of mammography and breast tomosynthesis. While this (essentially linear) extrapolation of the breast density distribution model to the compressed breast geometry cannot be completely verified, robustness analysis performed in this study demonstrates that the overall findings are robust against likely perturbations in the breast density distribution in the compressed breast. Furthermore, compression of elastic breast tissue to a first approximation obeys Hooke’s law, which is fundamentally linear.15 For example, changes in the location of the center of the glandular distribution (Fig. 9) along the direction of the incident x-ray beam demonstrate a logical change in the DgN coefficient’s profiles; that is, when the glandular tissue is more proximal to the surface of the breast facing the x-ray tube, the dose coefficients are higher, and in the case of a distal shift, the dose coefficients are lower. Figure 10 illustrates, however, that lateral shifts in the glandular tissue distribution result in virtually no change in the dose coefficient profile. While these results are found using the cranial–caudal mammography acquisition geometry, if the mediolateral oblique geometry was used, identical shifts would result in different DgN coefficients since the direction of the incident x-ray beam is no longer parallel to the direction of the glandular distribution shift.
The energy dependent DgN(E) curves, shown in Fig. 8, clearly demonstrate that the differences between the heterogeneous assumption and that of the homogeneous glandular tissue assumption are greater for lower photon energies. This is because the shielding effect of principally adipose tissue surrounding a more glandular tissue distribution at the center of the breast is more pronounced for lower x-ray photon energies. Indeed, as the x-ray energy increases, corresponding to increased penetration at depth in the breast, the differences between the heterogeneous/homogeneous tissue distributions become vanishingly small above about 30 keV. For x-ray energies in the 40–50 keV range, the DgN coefficients for the heterogeneous glandular tissue composition are greater than those for the homogeneous tissue composition. These trends are consistent with the physics of exponential attenuation; however, they do suggest that recent efforts to increase the effective x-ray beam energy to reduce mean glandular dose in digital mammography and breast tomosynthesis need to consider using DgN coefficients revised for the heterogeneous tissue distribution.
At our institution, the dose levels in dedicated bCT are set to be equal to the dose of two-view mammography for that woman. Considering that the present work demonstrates on average a 30% lower glandular dose in mammography, this raises the bar in terms of the dose delivered in bCT. However, glandular dose estimations in bCT assume that the breast is a perfect cylinder and that the glandular tissue is homogeneously distributed throughout the breast. Future work is needed to estimate the glandular dose in bCT using more realistic breast shapes and the 3D distribution of glandular tissue. In addition, if bCT proves its utility in the diagnostic breast imaging setting, holding dose levels to that of two-view mammography is not necessary.
The main limitation of the present work is that the previously reported bCT-derived glandular distributions were only characterized for each bra cup size. As shown in Fig. 6, there was no notable difference in the biGaussian fitting results of the radial glandular distributions across cup size or the three coronal regions (i.e., posterior, mid, and anterior). Thus, identical fitted glandular distributions were used for all phantoms reported in this study. Due to the large variation in breast size and glandular fraction within each cup size, it is likely that characterizing the glandular distributions by cup size obscures any significant differences. Future work will investigate characterizing the bCT-derived glandular distributions by breast size (e.g., diameter and volume) and overall glandular fraction.
The extraction of fibroglandular tissue and the quantitative estimate of glandular fraction depend on the particular segmentation software and applied threshold to separate breast tissues. The glandular distributions used in the present work are based on segmented bCT images that employed a 3D segmentation method7,16 which used a combination of iterative threshold, a connected-component algorithm, and a 3D median filter. The work of Yaffe et al. showed that this particular bCT segmentation method compared well with other methods for segmenting mammography projection images where the volumetric glandular fraction (excluding skin) was 14.3% for the bCT images and on average 13.6% for three separate cohorts of segmented mammography images, demonstrating the robustness of segmentation methods used here.7 In addition, Vedantham et al. used a different segmentation method and found that the VGF exclusive of skin was on average 17.2% using 137 bCT volumes.17 This is in good agreement with our previously published result, which showed on average a VGF of 15.8% using 219 bCT volumes.6 Despite these consistent comparisons, there still exists some error, albeit small, as a result of the image segmentation methods used to derive the glandular fraction and 3D glandular distributions used in the present work.
In summary, this investigation has demonstrated that when the realistic anatomical structure of the breast is considered, the radiation dose conversion coefficients (DgN values) for typical mammography spectra are reduced by about 35%. For higher energy x-ray beams (e.g., tungsten anode) more typical of tomosynthesis, the DgN values are lower by about 25%. These results make use of an analysis of glandular tissue distribution over a reasonably large range of women, made possible by the availability of true 3D image data sets produced using prototype bCT scanners. These results also illustrate that radiation dosimetry methods pertinent to mammography and tomosynthesis need to be fundamentally updated to address realistic distributions of glandular tissue.
5. CONCLUSIONS
This study, combined with similar results of earlier studies, demonstrates that radiation dose levels in mammography are about 30% lower than previously assumed using the homogeneous tissue approximation. The homogeneous assumption overestimates the amount of glandular tissue at the entrance of the breast where the dose deposition is higher. The results in this study are based on clinically measured glandular distributions using a large cohort of women, but future work is still required to better classify the glandular distributions based on breast size (i.e., diameter and volume) and overall glandular fractions.
ACKNOWLEDGMENTS
This work was funded in part by a research grant (No. RO1 EB002138) from the National Institute of Biomedical Imaging and Bioengineering, a research grant (No. RO1 CA181081) from the National Cancer Institute, and a UC Davis Provost Bridge Funding grant. The authors would also like to acknowledge Dr. Anita Nosratieh for providing the compressed breast aspect ratios used in this study and Dr. Shih-Ying Huang for providing us with the raw data for the bCT-derived 3D glandular distributions and the associated anatomical metrics.
REFERENCES
- 1.J. D. Boice, Jr., “Welcome to the Fiftieth Annual Meeting of the NCRP: Achievements of the past 50 years and addressing the needs of the future,” Health Phys. 108, 111–114 (2015). 10.1097/HP.0000000000000242 [DOI] [PubMed] [Google Scholar]
- 2.Boone J. M., “Glandular breast dose for monoenergetic and high-energy x-ray beams: Monte Carlo assessment,” Radiology 213, 23–37 (1999). 10.1148/radiology.213.1.r99oc3923 [DOI] [PubMed] [Google Scholar]
- 3.Boone J. M., “Normalized glandular dose (DgN) coefficients for arbitrary x-ray spectra in mammography: Computer-fit values of Monte Carlo derived data,” Med. Phys. 29, 869–875 (2002). 10.1118/1.1472499 [DOI] [PubMed] [Google Scholar]
- 4.Dance D. R., “Monte Carlo calculation of conversion factors for the estimation of mean glandular breast dose,” Phys. Med. Biol. 35, 1211–1219 (1990). 10.1088/0031-9155/35/9/002 [DOI] [PubMed] [Google Scholar]
- 5.Huang S. Y., Boone J. M., Yang K., Kwan A. L., and Packard N. J., “The effect of skin thickness determined using breast CT on mammographic dosimetry,” Med. Phys. 35, 1199–1206 (2008). 10.1118/1.2841938 [DOI] [PMC free article] [PubMed] [Google Scholar]
- 6.Huang S. Y., Boone J. M., Yang K., Packard N. J., McKenney S. E., Prionas N. D., Lindfors K. K., and Yaffe M. J., “The characterization of breast anatomical metrics using dedicated breast CT,” Med. Phys. 38, 2180–2191 (2011). 10.1118/1.3567147 [DOI] [PMC free article] [PubMed] [Google Scholar]
- 7.Yaffe M. J., Boone J. M., Packard N., Alonzo-Proulx O., Huang S. Y., Peressotti C. L., Al-Mayah A., and Brock K., “The myth of the 50-50 breast,” Med. Phys. 36, 5437–5443 (2009). 10.1118/1.3250863 [DOI] [PMC free article] [PubMed] [Google Scholar]
- 8.Dance D. R., Hunt R. A., Bakic P. R., Maidment A. D., Sandborg M., Ullman G., and Alm Carlsson G., “Breast dosimetry using high-resolution voxel phantoms,” Radiat. Prot. Dosim. 114, 359–363 (2005). 10.1093/rpd/nch510 [DOI] [PubMed] [Google Scholar]
- 9.Sechopoulos I., Bliznakova K., Qin X., Fei B., and Feng S. S., “Characterization of the homogeneous tissue mixture approximation in breast imaging dosimetry,” Med. Phys. 39, 5050–5059 (2012). 10.1118/1.4737025 [DOI] [PMC free article] [PubMed] [Google Scholar]
- 10.Wu X., Barnes G. T., and Tucker D. M., “Spectral dependence of glandular tissue dose in screen-film mammography,” Radiology 179, 143–148 (1991). 10.1148/radiology.179.1.2006265 [DOI] [PubMed] [Google Scholar]
- 11.Sechopoulos I., Ali E. S. M., Badal A., Badano A., Boone J. M., Kyprianou I. S., Mainegra-Hing E., McMillan K. L., McNitt-Gray M. F., Rogers D. W. O., Samei E., and Turner A. C., “Monte Carlo reference data sets for imaging research: Executive summary of the report of AAPM Research Committee Task Group 195,” Med. Phys. 42, 5679–5691 (2015). 10.1118/1.4928676 [DOI] [PubMed] [Google Scholar]
- 12.Johns H. E. and Cunningham J. R., The Physics of Radiology, 3rd ed. (Thomas, Springfield, IL, 1974). [Google Scholar]
- 13.Wu X., Gingold E. L., Barnes G. T., and Tucker D. M., “Normalized average glandular dose in molybdenum target-rhodium filter and rhodium target-rhodium filter mammography,” Radiology 193, 83–89 (1994). 10.1148/radiology.193.1.8090926 [DOI] [PubMed] [Google Scholar]
- 14.Hernandez A. M. and Boone J. M., “Tungsten anode spectral model using interpolating cubic splines: Unfiltered x-ray spectra from 20 kV to 640 kV,” Med. Phys. 41, 042101 (15pp.) (2014). 10.1118/1.4866216 [DOI] [PMC free article] [PubMed] [Google Scholar]
- 15.Kellner A. L., Nelson T. R., Cervino L. I., and Boone J. M., “Simulation of mechanical compression of breast tissue,” IEEE Trans. Bio-Med. Eng. 54, 1885–1891 (2007). 10.1109/TBME.2007.893493 [DOI] [PubMed] [Google Scholar]
- 16.Packard N. and Boone J. M., “Glandular segmentation of cone beam breast CT volume images,” Proc. SPIE 6510, 651038 (2007). 10.1117/12.713911 [DOI] [Google Scholar]
- 17.Vedantham S., Shi L., Karellas A., and O’Connell A. M., “Dedicated breast CT: Fibroglandular volume measurements in a diagnostic population,” Med. Phys. 39, 7317–7328 (2012). 10.1118/1.4765050 [DOI] [PMC free article] [PubMed] [Google Scholar]


