

Abstract
Objective
To examine whether care experiences and immunization for racial/ethnic/language minority Medicare beneficiaries vary with the proportion of same-group beneficiaries in Medicare Advantage (MA) contracts.
Data Sources/Study Setting
Exactly 492,495 Medicare beneficiaries responding to the 2008–2009 MA Consumer Assessment of Healthcare Providers and Systems (CAHPS) Survey.
Data Collection/Extraction Methods
Mixed-effect regression models predicted eight CAHPS patient experience measures from self-reported race/ethnicity/language preference at individual and contract levels, beneficiary-level case-mix adjustors, along with contract and geographic random effects.
Principal Findings
As a contract's proportion of a given minority group increased, overall and non-Hispanic, white patient experiences were poorer on average; for the minority group in question, however, high-minority plans may score as well as low-minority plans. Spanish-preferring Hispanic beneficiaries also experience smaller disparities relative to non-Hispanic whites in plans with higher Spanish-preferring proportions.
Conclusions
The tendency for high-minority contracts to provide less positive patient experiences for others in the contract, but similar or even more positive patient experiences for concentrated minority group beneficiaries, may reflect cultural competency, particularly language services, that partially or fully counterbalance the poorer overall quality of these contracts. For some beneficiaries, experiences may be just as positive in some high-minority plans with low overall scores as in plans with higher overall scores.
Keywords: Patient experiences with care, health care disparities, racial and ethnic minorities, Hispanic Americans, Medicare, managed care
The Consumer Assessment of Healthcare Providers and Systems (CAHPS) standardized surveys of patient experience are increasingly used to measure the quality of care provided by health plans and providers, to help consumers make objective and meaningful comparisons (Hibbard and Jewett 1996; Spranca et al. 2000; Kolstad and Chernew 2009), to encourage quality improvement (Goldstein et al. 2001; Davies et al. 2008; Browne et al. 2010; Friedberg et al. 2011), and as criteria in pay-for-performance systems, particularly in the context of Medicare.
Racial/ethnic disparities in Medicare beneficiaries' health care experiences are well documented (Morales et al. 2001; Lurie et al. 2003; Fongwa et al. 2008; Weech-Maldonado et al. 2008b; Goldstein et al. 2010; Haviland et al. 2012) and have been demonstrated among Medicare beneficiaries enrolled in both fee-for-service and Medicare Advantage (MA) managed care contracts (Lurie et al. 2003; Fongwa et al. 2008; Weech-Maldonado et al. 2008b; Elliott et al. 2011). Among MA beneficiaries, differences in patient experience reports and ratings by race/ethnicity reflect both the degree to which racial/ethnic minorities are concentrated within contracts that provide lower quality care (“between-contract” effects) and the degree to which contracts provide care of differential quality to beneficiaries differing in race/ethnicity (“within-contract” effects).
It is important to understand the role of each of these potential sources of disparities (within- and between-contract effects) and sources of variation in each to address and ultimately reduce these disparities.
Racial/ethnic minorities are often clustered within physician practices, hospitals, and MA contracts to a greater degree than would be expected by chance (Rodriguez et al. 2008; Weinick et al. 2014). Their providers and contracts deliver care that is, on average, rated more poorly than care delivered by providers and contracts with fewer minorities (Rodriguez et al. 2008; Goldstein et al. 2010; Haviland et al. 2011; Orr et al. 2013). Although more research is needed to explain why minorities tend to have lower quality care providers and contracts, one possibility is that providers and contracts with fewer resources operate in areas that are residentially segregated by race/ethnicity. Concentration of minorities in particular MA contracts may also be explained, in part, by these contracts having lower out-of-pocket costs (Atherly and Thorpe 2005). Weinick et al. (2014) notes that new special needs plans (SNPs), the first plans that allow eligibility requirements based on low income or chronic condition, substantially concentrate racial/ethnic minorities in contracts relative to the racial/ethnic composition of their operational area, perhaps because the beneficiaries eligible for SNPs are disproportionately likely to be racial/ethnic minorities.
Prior research has found that racial/ethnic disparities in quality of care persist within contracts, on average, even after controlling for minorities' disproportionate enrollment in lower quality contracts (Schneider, Zaslavsky, and Epstein 2002). In an inpatient sample, Elliott et al. (2010) found that relative hospital ranks for patients' hospital care experiences vary across racial/ethnic groups such that the “best” hospital for one racial/ethnic group may not be the best for another (Elliott et al. 2010).
Together, these findings suggest that in addition to offering different average levels of care, managed care contracts and providers may offer different levels of care quality to the racial/ethnic subpopulations they serve. Differential care quality by race/ethnicity may reflect contract specialization that better meets the unique needs or preferences of subpopulations. The incentives for and effects of such specialization would likely be more pronounced for contracts with higher proportions of minority enrollment. To examine this hypothesis, we examine whether care experiences and immunization rates for racial/ethnic minority beneficiaries vary according to the proportion of same-race/ethnicity individuals enrolled in MA contracts.
For Hispanic beneficiaries, we are able to investigate this hypothesis in more detail by considering the role of language preference in such specialization. Language barriers have been shown to more greatly influence Hispanics' reported experiences of care than ethnicity alone (Morales et al. 1999; Weech-Maldonado et al. 2001, 2003, 2004). Thus, Hispanic beneficiaries may benefit from enrolling in contracts with a higher proportion of Hispanics because those contracts may specialize in serving Spanish-speaking populations, resulting in a cycle of greater contract enrollment by Hispanics and stronger language services by providers or other managed care contract staff. If this were true, we would expect that Spanish-preferring Hispanics would benefit most, that English-preferring Hispanics would benefit somewhat, and that English-preferring, non-Hispanic whites (NH-whites) would not benefit at all from being enrolled in contracts with higher proportions of Spanish-preferring beneficiaries. Alternatively, NH-whites might benefit as well if such plans had greater cultural competence and sensitivity to individual beneficiary needs.
The present study uses 2008 and 2009 MA CAHPS data to examine whether reports by MA beneficiaries regarding their care experiences and immunization vary according to the proportion of same-race/ethnicity beneficiaries enrolled in their MA contracts. We extend prior research by examining the degree to which racial/ethnic contract proportions reinforce or counterbalance the effect of minority beneficiaries' tendency to enroll in lower quality plans, and the degree to which Spanish-preferring Hispanics benefit from enrolling in contracts with a higher proportion of Spanish-preferring Hispanic beneficiaries.
Methods
Data Source
Our analyses use data from the 492,495 respondents to the 2008 and 2009 MA CAHPS survey. We pooled data across 2008 and 2009 to increase available sample size and increase the reliability of estimates. The 2008 (2009) MA CAHPS survey attempted to contact 380,487 (378,255) Medicare beneficiaries enrolled in MA contracts and received responses from 247,233 (245,262), for a 65.0 percent (64.8 percent) response rate. The survey represents all MA beneficiaries from the 373 (449) MA contracts with more than 300 enrollees. We exclude survey responses from Puerto Rico (17,286), as their reported care experiences have been shown to be substantially different from mainland Hispanics (Elliott et al. 2012), and language specialization is unlikely to be responsible for observed care experiences in a largely Spanish-speaking territory. This exclusion results in a dataset of 475,209 MA CAHPS responses.
CMS conducted the 2008 and 2009 MA CAHPS surveys to obtain, publicly report, and make other use of data that measure beneficiaries' experiences with care and services received through Medicare Part C and Part D. The 2008 and 2009 MA CAHPS surveys were administered in English and Spanish by mail, with bilingual telephone follow-up. The survey uses a stratified, random sample of Medicare beneficiaries, with contracts serving as strata for MA. MA contracts, commonly called “health plans,” are sets of offerings from a single health plan sponsor in a specific geographic area; we refer to “contracts” throughout this article. Enrollment in MA contracts is restricted to Medicare beneficiaries. MA CAHPS data can be used to compare the performance of MA contracts with regard to beneficiaries' experiences of care. Poststratification weights allow for interpretation of results as representative of the population of MA beneficiaries (Klein et al. 2011).
Dependent Variables: Eight CAHPS Measures
We analyzed the eight outcomes that were publicly reported from the 2008–2009 MA CAHPS survey: six composite scores of patient experience derived from multiple report items and two separate report items regarding receipt of immunizations for flu in the last year and pneumonia in one's lifetime. Four composite measures assessed Part C experiences (getting needed care, getting care quickly, doctor communication, and customer service). Two of the composites (getting drugs, getting information from drug plan) assessed experiences with prescription drug coverage for MA beneficiaries with Part D coverage. Questions regarding immunizations reflect the degree to which beneficiaries receive recommended preventive care; per CMS's official scoring for these measures, we restrict analysis to respondents ages 65 and older. Questions were answered by the subset of beneficiaries to whom they were applicable, as determined by screener items assessing eligibility. Responses to each CAHPS item were linearly transformed to a possible range of 0–100, and composites were scored as the average of nonmissing items for each individual. The reliability and validity of the composites are described elsewhere (Hays et al. 1999; Hargraves, Hays, and Cleary 2003; Martino et al. 2009). We excluded the five global ratings of care (e.g., overall ratings of care, providers, health plans) from further consideration on the basis of evidence that such measures may not be valid for comparisons by race/ethnicity (Weech-Maldonado et al. 2008a; Elliott et al. 2009). The systematic tendency of certain minority groups to endorse the most extreme response category has been established for questions that elicit ratings on a 0–10 scale. In contrast, for a version of the CAHPS provider communication composite, NH-whites, non-Hispanic blacks (NH-blacks), and Hispanics used items similarly in a randomized experiment (Weinick et al. 2011). The eight included measures are described in Table S1.
Independent Variables
For analyses of disparities in patient experience overall, our main independent variable was race/ethnicity, categorized as NH-white, NH-black, Hispanic, and non-Hispanic Asian/Pacific Islander (NH-API). We combined respondents with unknown race/ethnicity, those who reported multiple races, and American Indian and Alaska Native (AI/AN) respondents into a single “NH-other” category due to small sample sizes, and do not interpret results for this heterogeneous group. In language specialization analyses, Hispanics were further classified into language subgroups based on language of survey completion (English or Spanish), a proxy for preferred language.
To assess the degree to which levels and disparities in patient experiences differ according to the racial/ethnic composition of MA contracts, we included a variable indicating the proportion of contracts' beneficiaries who were of each race/ethnicity. In models examining language specialization, we included a variable indicating the proportion of contracts' beneficiaries who completed a Spanish language survey (as a proxy for Spanish preference).
Other Covariates
To adjust for beneficiary characteristics known to be associated with systematic differences in response, and that may differ across MA contracts, we included as covariates the following case-mix adjustors: age, education, self-rated overall and mental health, and proxy assistance completing the survey. To control for geographic variations in CAHPS scores, we included as covariates 305 geographic indicators of Hospital Referral Region (HRR) (Wennberg 1998), as well as one additional indicator for the Virgin Islands. To adjust for national annual trends or other factors imbalanced across the 2 years of data, we included a survey year indicator.
Statistical Analysis
For all analyses, we applied weights that accounted for survey design and nonresponse at the level of the contract. We calculated mean beneficiary characteristics and CAHPS scores by race/ethnicity, adjusting scores for the case-mix and geography variables noted above.
Our first series of models examine the effects of contract racial/ethnic composition on outcomes and the interaction between being a member of a racial/ethnic minority and the proportion of same-race/ethnicity beneficiaries in the contract. These models predict each measure using mixed-effect linear regression models that employed beneficiary-level case-mix adjustors, survey year, individual race/ethnicity indicators, contract-level race/ethnicity proportions, and interaction of individual race/ethnicity indicator by corresponding contract-level race/ethnicity proportion as fixed effects. These models also allowed for random intercepts for contracts, geography/market (HRR), random race/ethnicity “slopes” by contract (race/ethnicity by contract interactions), and random race/ethnicity “slopes” by HRR (race/ethnicity by HRR interactions) (Table2). In an additional set of models, we examined the association of the proportion of beneficiaries who are Spanish-preferring with CAHPS measures and the interaction between being a Spanish-preferring Hispanic and the proportion of Spanish-preferring beneficiaries in the contract. In these models, we created separate subgroups for Spanish-preferring Hispanics and English-preferring Hispanics and replaced the contract-level proportion of Hispanics variable with a contract-level, Spanish-preferring Hispanic proportion variable, which is then interacted with both Hispanic group indicators.
Table 2.
Racial/Ethnic Disparities Based on Case Mix-Adjusted‡ Multivariate Mixed Linear Regression for CAHPS Measures†, MA CAHPS Years 2008 and 2009 Combined
| Getting Needed Drugs | Getting Needed Drug Information | Getting Needed Care | Getting Care Quickly | |||||||||||||
|---|---|---|---|---|---|---|---|---|---|---|---|---|---|---|---|---|
| Est | SE | p-value | Est | SE | p-value | Est | SE | p-value | Est | SE | p-value | |||||
| Fixed effects | ||||||||||||||||
| Race/ethnicity§ | ||||||||||||||||
| Hispanic | −3.73 | 0.37 | *** | −4.20 | 0.78 | *** | −2.81 | 0.45 | *** | −3.75 | 0.41 | *** | ||||
| NH-black | −2.64 | 0.41 | *** | −4.78 | 0.85 | *** | −1.49 | 0.46 | ** | −3.76 | 0.42 | *** | ||||
| NH-Asian/Pacific Islander | −6.84 | 0.62 | *** | −8.93 | 0.73 | *** | −7.53 | 0.60 | *** | −11.13 | 0.69 | *** | ||||
| Contract-level proportions | ||||||||||||||||
| Contract-level Hispanic proportion | −3.55 | 1.07 | *** | −5.49 | 1.97 | ** | −8.68 | 1.12 | *** | −4.61 | 1.16 | *** | ||||
| Contract-level NH-black proportion | −9.05 | 1.21 | *** | −13.59 | 2.21 | *** | −11.65 | 1.23 | *** | −8.29 | 1.26 | *** | ||||
| Contract-level NH-Asian/Pacific Islander proportion | −5.82 | 1.97 | ** | −10.02 | 3.51 | ** | −8.20 | 2.24 | *** | −9.03 | 2.53 | *** | ||||
| Race/ethnicity by contract-level proportions | ||||||||||||||||
| Hispanic by contract-level Hispanic proportion | 3.04 | 1.50 | * | 9.66 | 2.85 | *** | 5.17 | 1.69 | ** | 5.38 | 1.54 | *** | ||||
| NH-black by contract-level NH-black proportion | 0.21 | 1.86 | 2.14 | 3.47 | −2.02 | 2.11 | 4.20 | 1.86 | * | |||||||
| NH-Asian/Pacific Islander by contract-level NH-Asian/Pacific Islander proportion | 8.29 | 3.47 | * | 11.97 | 3.84 | ** | 4.90 | 3.56 | 5.30 | 3.84 | ||||||
| Indicator for year 2009 survey | −0.15 | 0.07 | * | 0.80 | 0.17 | *** | 0.78 | 0.08 | *** | 0.60 | 0.08 | *** | ||||
| Random effects | ||||||||||||||||
| Contract | 4.05 | 2.01 | 0.43 | *** | 9.59 | 3.10 | 1.30 | *** | 2.89 | 1.70 | 0.40 | *** | 2.73 | 1.65 | 0.37 | *** |
| Hospital Referral Region | 0.81 | 0.90 | 0.15 | *** | 2.81 | 1.68 | 0.70 | *** | 2.74 | 1.65 | 0.37 | *** | 12.04 | 3.47 | 1.22 | *** |
| Race/ethnicity by contract¶ | ||||||||||||||||
| NH-white by contract | 0.00 | 0.00 | 0.97 | 0.99 | 0.98 | 0.13 | 0.36 | 0.24 | 0.64 | 0.80 | 0.27 | ** | ||||
| Hispanic by contract | 4.20 | 2.05 | 1.17 | *** | 7.07 | 2.66 | 3.24 | * | 3.44 | 1.85 | 1.13 | ** | 1.33 | 1.15 | 0.71 | * |
| NH-black by contract | 4.43 | 2.10 | 1.07 | *** | 5.18 | 2.28 | 3.17 | 4.43 | 2.10 | 1.29 | *** | 2.02 | 1.42 | 0.87 | * | |
| NH-Asian/Pacific Islander by contract | 9.83 | 3.14 | 3.27 | ** | 0.47 | 0.69 | 2.93 | 12.94 | 3.60 | 4.34 | ** | 10.08 | 3.18 | 3.75 | ** | |
| Race/ethnicity by Hospital Referral Region | ||||||||||||||||
| Hispanic by Hospital Referral Region | 2.33 | 1.53 | 1.47 | 20.72 | 4.55 | 7.57 | ** | 8.89 | 2.98 | 3.12 | ** | 7.29 | 2.70 | 2.53 | ** | |
| NH-black by Hospital Referral Region | 4.84 | 2.20 | 1.58 | ** | 36.02 | 6.00 | 9.43 | *** | 7.16 | 2.68 | 2.03 | *** | 7.10 | 2.66 | 1.80 | *** |
| NH-Asian/Pacific Islander by Hospital Referral Region | 15.36 | 3.92 | 5.70 | ** | 2.90 | 1.70 | 3.70 | 4.35 | 2.09 | 3.06 | 15.84 | 3.98 | 7.57 | * | ||
| Residual | 240.68 | 15.51 | 0.58 | *** | 380.16 | 19.50 | 1.70 | *** | 272.13 | 16.50 | 0.70 | *** | 375.98 | 19.39 | 0.84 | *** |
| Customer Service | Doctor Communication | Had Flu Shot Last Year | Had Pneumonia Shot | |||||||||||||
|---|---|---|---|---|---|---|---|---|---|---|---|---|---|---|---|---|
| Est | SE | p-value | Est | SE | p-value | Est | SE | p-value | Est | SE | p-value | |||||
| Fixed effects | ||||||||||||||||
| Race/ethnicity§ | ||||||||||||||||
| Hispanic | −2.75 | 0.68 | *** | −0.54 | 0.29 | −1.96 | 0.80 | * | −8.20 | 0.83 | *** | |||||
| NH-black | −2.26 | 0.51 | *** | 0.43 | 0.24 | −13.24 | 0.78 | *** | −13.55 | 0.84 | *** | |||||
| NH-Asian/Pacific Islander | −7.59 | 0.80 | *** | −4.01 | 0.48 | *** | 3.99 | 0.85 | *** | −9.19 | 1.11 | *** | ||||
| Contract-level proportions | ||||||||||||||||
| Contract-level Hispanic proportion | −4.16 | 1.87 | * | −3.20 | 0.68 | *** | −15.10 | 2.17 | *** | −13.21 | 2.24 | *** | ||||
| Contract-level NH-black proportion | −14.80 | 2.09 | *** | −2.30 | 0.72 | ** | −15.90 | 2.39 | *** | −14.06 | 2.46 | *** | ||||
| Contract-level NH-Asian/Pacific Islander proportion | −7.43 | 3.53 | * | −0.63 | 1.45 | −0.23 | 4.15 | −17.15 | 4.44 | *** | ||||||
| Race/ethnicity by contract-level proportions | ||||||||||||||||
| Hispanic by contract-level Hispanic proportion | 5.17 | 2.17 | * | 3.31 | 1.05 | ** | 9.76 | 3.00 | ** | −3.52 | 3.27 | |||||
| NH-black by contract-level NH-black proportion | 8.78 | 2.34 | *** | 0.01 | 1.10 | 10.26 | 3.31 | ** | 1.59 | 3.61 | ||||||
| NH-Asian/Pacific Islander by contract-levelNH-Asian/Pacific Islander proportion | 5.09 | 4.60 | −1.95 | 2.43 | −0.23 | 4.63 | −9.35 | 5.67 | ||||||||
| Indicator for year 2009 survey | 1.06 | 0.12 | *** | 0.40 | 0.06 | *** | −2.13 | 0.14 | *** | 0.12 | 0.14 | |||||
| Random effects | ||||||||||||||||
| Contract | 14.03 | 3.75 | 1.50 | *** | 0.47 | 0.68 | 0.10 | *** | 13.95 | 3.74 | 1.59 | *** | 15.31 | 3.91 | 1.68 | *** |
| Hospital Referral Region | 3.33 | 1.82 | 0.57 | *** | 1.32 | 1.15 | 0.18 | *** | 11.55 | 3.40 | 1.41 | *** | 11.32 | 3.37 | 1.39 | *** |
| Race/ethnicity by contract¶ | ||||||||||||||||
| NH-white by contract | 0.83 | 0.91 | 0.61 | 0.12 | 0.35 | 0.09 | 2.88 | 1.70 | 1.02 | ** | 1.06 | 1.03 | 0.93 | |||
| Hispanic by contract | 2.45 | 1.57 | 1.71 | 0.65 | 0.81 | 0.35 | * | 12.40 | 3.52 | 3.71 | *** | 18.90 | 4.35 | 4.72 | *** | |
| NH-black by contract | 1.72 | 1.31 | 1.26 | 0.12 | 0.35 | 0.20 | 7.14 | 2.67 | 2.87 | ** | 11.89 | 3.45 | 3.30 | *** | ||
| NH-Asian/Pacific Islander by contract | 11.12 | 3.33 | 6.95 | 3.08 | 1.76 | 1.44 | * | 0.00 | 0.00 | 4.00 | 2.00 | 6.50 | ||||
| Race/ethnicity by Hospital Referral Region | ||||||||||||||||
| Hispanic by Hospital Referral Region | 33.28 | 5.77 | 8.93 | *** | 3.49 | 1.87 | 1.26 | ** | 29.96 | 5.47 | 8.27 | *** | 27.70 | 5.26 | 7.59 | *** |
| NH-black by Hospital Referral Region | 5.54 | 2.35 | 2.34 | ** | 1.79 | 1.34 | 0.60 | ** | 29.99 | 5.48 | 6.87 | *** | 34.44 | 5.87 | 7.94 | *** |
| NH-Asian/Pacific Islander by Hospital Referral Region | 11.58 | 3.40 | 7.12 | 8.57 | 2.93 | 3.30 | ** | 21.57 | 4.64 | 11.58 | * | 60.19 | 7.76 | 24.58 | ** | |
| Residual | 341.13 | 18.47 | 1.17 | *** | 173.51 | 13.17 | 0.41 | *** | 1,161.89 | 34.09 | 2.51 | *** | 1,140.26 | 33.77 | 2.54 | *** |
Notes: NH, non-Hispanic.
†All outcome measures were linearly rescaled to 0–100.
‡The case-mix adjustors were age, education, self-rated overall health, self-rated mental health, proxy assistance, and indicator of year 2009 survey versus year 2008.
§The omitted racial/ethnic group is NH-white. There is also an indicator for multiracial, unknown, and AI/AN, not shown.
¶There is a random effect for multiracial, unknown, and AI/AN by contract, not shown.
***p < .001; **p < .01; *p < .05.
Main effects of contract racial/ethnic proportions (Spanish-preferring proportions) directly assess the extent to which contracts with higher percentages of certain racial/ethnic groups (Spanish-preferring) report systematically higher or lower scores for beneficiaries in general. Interactions between contract-level racial/ethnic measures and corresponding individual race/ethnicity assess the extent to which disparities vary by the racial/ethnic composition of the contract, with positive coefficients meaning smaller disparities (or relative benefits to the minority group in question) when one is in a contract with more members of one's subgroup. Such smaller disparities might or might not result in better absolute experiences, depending on the main effect of contract racial/ethnic proportions.
For each set of models, we developed figures to illustrate the net effects of being in higher minority (higher Spanish-preferring) contracts for members of each corresponding racial/ethnic (language preference) group.
Results
Two-thirds of 2008 and 2009 MA CAHPS respondents (excluding Puerto Rico) were NH-white, 8 percent were Hispanic, 9 percent were NH-black, and 3 percent were NH-API (Table1). Spanish language surveys comprised 1 percent of all completed surveys and 15 percent of those from Hispanic respondents. Two-thirds of respondents were aged 65–79, 23 percent had less than a high school education, and 26 percent were in poor or fair self-rated overall health. NH-black, Hispanic, and NH-API respondents were significantly less likely than NH-white respondents to have completed high school and were significantly more likely to have received assistance from a proxy to complete the survey.
Table 1.
Characteristics of MA Beneficiaries Responding to 2008 and 2009 MA CAHPS, by Race and Ethnicity
| NH-White | Hispanic (Excluding Puerto Rico) | NH-Black | NH-Asian/Pacific Islander | ||
|---|---|---|---|---|---|
| Totaln = 475,209 | n = 320,959 (67.5%) | n = 38,213 (8.0%) | n = 40,535 (8.5%) | n = 12,439 (2.6%) | |
| Respondent characteristics | |||||
| Age (%) | |||||
| 18–44 | 0.8 | 0.7 | 1.5*** | 1.7*** | 0.5** |
| 45–54 | 2.3 | 2.0 | 3.0*** | 4.6*** | 0.9*** |
| 55–64 | 5.5 | 4.9 | 7.4*** | 9.9*** | 2.7*** |
| 65–69 | 23.0 | 23.3 | 23.5 | 23.5 | 23.3 |
| 70–74 | 24.1 | 23.9 | 26.0*** | 25.1*** | 27.1*** |
| 75–79 | 20.3 | 20.6 | 19.8** | 17.6*** | 21.6* |
| 80–84 | 14.3 | 14.6 | 12.1*** | 10.6*** | 14.4 |
| 85 or older | 9.7 | 10.0 | 6.9*** | 7.1*** | 9.5 |
| Education (%) | |||||
| Less than 8th grade | 9.4 | 6.1 | 32.6*** | 14.9*** | 12.5*** |
| Some high school | 13.3 | 11.8 | 17.6*** | 23.5*** | 9.5*** |
| High school diploma/GED | 35.6 | 37.9 | 24.9*** | 31.2*** | 24.9*** |
| Some college or 2-year degree | 24.1 | 25.4 | 16.4*** | 20.6*** | 19.7*** |
| 4-year college graduate | 8.0 | 8.6 | 4.4*** | 4.3*** | 17.1*** |
| More than 4-Year College degree | 9.5 | 10.4 | 4.1*** | 5.6*** | 16.3*** |
| Self-rated general health (%) | |||||
| Excellent | 8.9 | 9.1 | 10.6*** | 6.1*** | 7.9*** |
| Very good | 28.0 | 30.1 | 20.6*** | 19.1*** | 28.1*** |
| Good | 37.0 | 36.8 | 35.3*** | 37.9** | 40.7*** |
| Fair | 21.1 | 19.2 | 26.9*** | 30.4*** | 19.6 |
| Poor | 5.1 | 4.8 | 6.5*** | 6.5*** | 3.7*** |
| Self-rated mental health (%) | |||||
| Excellent | 31.5 | 32.9 | 27.9*** | 25.9*** | 26.7*** |
| Very good | 33.6 | 34.9 | 27.0*** | 28.5*** | 34.8 |
| Good | 25.2 | 23.8 | 29.4*** | 30.9*** | 27.8*** |
| Fair | 8.1 | 6.9 | 13.2*** | 12.5*** | 8.9*** |
| Poor | 1.7 | 1.5 | 2.6*** | 2.3*** | 1.7 |
| Proxy help (%) | |||||
| No proxy help | 90.0 | 91.6 | 77.1*** | 87.4*** | 76.2*** |
| Proxy helped | 6.8 | 5.3 | 18.9*** | 9.6*** | 16.3*** |
| Proxy answered | 3.2 | 3.1 | 4.0*** | 3.0 | 7.5*** |
| Surveys completed in Spanish (%) | 1.3 | 0.1 | 15.0*** | 0.0*** | 0.1 |
| Surveys completed in 2009 (%) | 54.2 | 55.3 | 56.3** | 55.7 | 53.3** |
| Average contract-level race/ethnicity proportions | |||||
| Average proportion NH-white | 68.9 | 72.9 | 51.9*** | 57.5*** | 52.2*** |
| Average proportion Hispanic | 7.6 | 5.7 | 22.4*** | 9.1*** | 10.0*** |
| Average proportion NH-black | 7.7 | 6.4 | 9.3*** | 17.2*** | 6.2** |
| Average proportion NH-Asian/Pacific Islander | 2.5 | 1.9 | 3.4*** | 2.0*** | 18.2*** |
| Average proportion American Indian/Alaskan Native | 0.3 | 0.3 | 0.3*** | 0.3*** | 0.3 |
| Average proportion multiracial | 1.5 | 1.5 | 1.4** | 1.8*** | 1.7*** |
| Average proportion unknown race | 11.5 | 11.4 | 11.4* | 12.1*** | 11.5*** |
| Average proportion Spanish-preferring | 1.3 | 0.8 | 5.8*** | 1.9*** | 1.6*** |
Notes: NH, non-Hispanic. Excludes responses from Puerto Rico. Total includes AI/AN, multiple races, and those who did not respond to race item. Statistical tests compare each race and ethnic group to NH-white. Comparisons of race and ethnic proportions were conducted via contract-level paired t-test.
***p < .001; **p < .01; *p < .05.
The average NH-white beneficiary is enrolled in a contract that is 73 percent NH-white, and the average Hispanic beneficiary is enrolled in a contract that is 22 percent Hispanic (Table1). Corresponding percentages are 17 percent for NH-blacks and 18 percent for NH-API. Each of these reflects some degree of concentration of racial/ethnic groups within contracts. Previous research suggests that such concentration is greater than expected from the racial/ethnic composition of the geographic location alone (Weinick et al. 2014).
Overall, across racial/ethnic subgroups (excluding AI/AN, multiracial, and unknown), case-mix adjusted mean scores of the six CAHPS composites ranged between 74.6 and 90.6 on a 0 to 100 scale, with the exception of getting care quickly, which ranged from 61.5 to 71.1 (Table S2). Adjusted composites were significantly higher for NH-whites than for all other groups, except for NH-blacks and Hispanics for the doctor communication measure (without adjusting for contract or different geographic distributions of different demographic groups; Table S2). Rates of self-reported influenza and pneumonia vaccination among respondents ages 65 and older ranged from 58.4 to 79.5 and 56.9 to 74.0 out of 100, respectively; influenza vaccination rates were significantly higher among NH-whites and NH-APIs than among Hispanics and NH-blacks, while pneumonia vaccination rates were significantly higher among NH-whites than among all other racial/ethnic groups. For each of the eight CAHPS measures, the right-most column in Table S2 displays adjusted mean differences between NH-whites and each racial/ethnic subgroup, with a negative value indicating less positive experiences for the non-white group. NH-black, Hispanic, and NH-API respondents report significantly worse experiences than NH-whites (p < .05) for seven of eight measures, though the exception varies by group. NH-API respondents have higher flu immunization rates than NH-whites, whereas NH-blacks and Hispanics report similar doctor communication as NH-whites.
Contract Racial/Ethnic Proportions
In Table2, results under the race/ethnicity heading describe the average within-contract disparities of Hispanic, NH-black, and NH-API beneficiaries; negative values indicate worse experiences compared to NH-whites. Contract-level proportions in Table2 describe patient experiences according to the proportion of minority enrollment in the contract, with negative values indicating less positive experiences as the proportion minority increases. Overall, patient experiences are poorer as the proportion of minority enrollment in contracts increases. This association is significant (p < .05) in all instances for higher contract proportions of NH-blacks and Hispanics, and in six of eight instances for contract NH-API proportion. There are no instances of significantly better experiences associated with a higher proportion of any of these three minority groups for any of these eight measures.
Race/ethnicity by contract-level proportions describe changes in disparities versus NH-whites for Hispanic, NH-black, and NH-API beneficiaries in contracts with more of their own racial/ethnic group (Table2). Estimates in these rows reflect the expected change in disparity for a beneficiary of that race/ethnicity in a contract whose beneficiaries are entirely (100 percent) members of the same minority group. For example, to calculate the difference in getting needed drugs for a Hispanic beneficiary in a 40 percent Hispanic enrollment contract compared to a Hispanic beneficiary in a near 0 percent Hispanic enrollment contract, one would multiply 3.04 (the estimate for Hispanic by contract-level Hispanic proportion for getting needed drugs) by 40 percent. Overall, disparities versus NH-whites tend to be smaller or even reversed for minorities within contracts with more members of their own racial/ethnic group. This trend is present and statistically significant in seven of eight instances for Hispanic beneficiaries in contracts with more Hispanic members, in three of eight instances for NH-black beneficiaries in contracts with more NH-black members, and in two of eight instances for NH-API beneficiaries in contracts with more NH-API members. There were no instances of significantly larger disparities for minorities in contracts with more same-minority members.
Based on these model results, the net effects for minority beneficiaries of being in overall worse contracts with smaller disparities are illustrated in Figure1a–d and Figure S1a–d.
Figure 1.
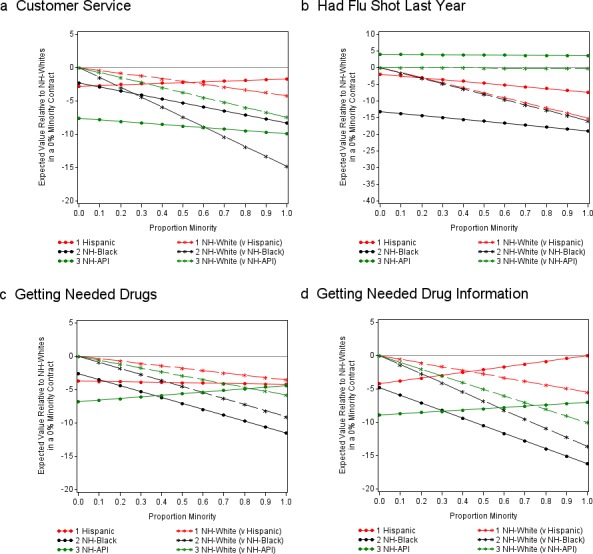
- Notes: The two red lines each describe hypothetical contracts in which a proportion, x, of the members is Hispanic, and a proportion, 1 − x, of the members is NH-white, where x is the value that appears on the horizontal axis. The dotted red line in the figures represents values for Hispanics in those contracts; the starred red line represents values for NH-whites. Similarly, the two black lines refer to hypothetical contracts in which a proportion, x, is NH-black and a proportion, 1 − x, is NH-white; likewise, the two green lines refer to hypothetical contracts in which a proportion, x, is NH-API and a proportion, 1 − x, is NH-white. In all instances, the zero or reference point on the vertical axis corresponds to the average experience of NH-whites in a 100 percent NH-white contract. All other lines and points compare to this reference point.The highest observed concentrations of racial/ethnic groups within contract are 93 percent NH-white, 76 percent NH-black, 88 percent NH-API, and 92 percent Hispanic.
In each of the figures, the two red lines each describe hypothetical contracts in which a proportion, x, of the members is Hispanic, and a proportion, 1 − x, of the members is NH-white, where x is the value that appears on the horizontal axis. The dotted red line in the figures represents values for Hispanics in those contracts; the starred red line represents values for NH-whites. Similarly, the two black lines refer to hypothetical contracts in which a proportion, x, is NH-black and a proportion, 1 − x, is NH-white; likewise, the two green lines refer to hypothetical contracts in which a proportion, x, is NH-API and a proportion, 1 − x, is NH-white. In all instances, the zero or reference point on the vertical axis corresponds to the average experience of NH-whites in a 100 percent NH-white contract. All other lines and points compare to this reference point. For example, the vertical axis value on the dotted red line when x equals 0.3 in Figure1a estimates the difference between Hispanics in a 30 percent Hispanic/70 percent NH-white contract from NH-whites in a 100 percent NH-white contract with respect to customer service. Similarly, the vertical axis value on the starred red line corresponding to 0.3 on the horizontal axis indicates the experiences of NH-whites in a 30 percent Hispanic/70 percent NH-white contract relative to the experiences of NH-whites in a 100 percent NH-white contract with respect to customer service.
For the eight CAHPS measures under study, almost all starred lines (NH-white) slope downward, reflecting the negative main effects of the proportion of NH-black, Hispanic, and NH-API with respect to overall patient experiences. Second, the dotted lines typically slope downward more mildly or are flat, and in a few cases have slightly upward slopes (customer service and getting information from drug plan for Hispanics; flu shots, getting needed drugs, and getting information from drug plan for NH-API). This reflects a pattern in which the tendency of minorities to be enrolled in worse contracts usually overwhelms and only partially counteracts the smaller disparities when comparing the experiences of minorities and NH-whites in a given contract (“within-contract disparities”). Thus, while contracts with a high proportion of NH-black beneficiaries tend to have smaller NH-black versus NH-white disparities (smaller gaps between black dotted and starred lines as one moves from left to the right on each figure), the absolute experience of NH-blacks is similar or worse in contracts with high proportions of NH-blacks. For Hispanic beneficiaries, this holds for six of eight CAHPS measures, and for NH-API beneficiaries this holds for five of eight CAHPS measures. Thus, on average, in addition to lower minority contracts receiving higher scores from NH-whites, minority scores are also often higher in contracts with few minority beneficiaries, despite the typically larger disparities.
Spanish Language Specialization
Overall, patient experiences are poorer as the proportion of Hispanic, Spanish-preferring enrollment in contracts increases (Table3). These effects are significant (p < .05) for seven of the eight CAHPS measures, with the exception being health plan customer service. However, similar to the results above, Spanish-preferring Hispanics report significantly smaller or even reversed disparities relative to NH-whites in contracts with more Spanish-preferring members for five of eight measures. English-preferring Hispanics also report significantly smaller disparities relative to NH-whites in contracts with more Spanish-preferring members for five of eight measures.
Table 3.
Racial/Ethnic Disparities by Spanish Language Preference Based on Multivariate Mixed Linear Regression for CAHPS Measures†, MA CAHPS Years 2008 and 2009§
| Getting Needed Drugs | Getting Needed Drug Information | Getting Needed Care | Getting Care Quickly | |||||||||||||
|---|---|---|---|---|---|---|---|---|---|---|---|---|---|---|---|---|
| Est | SE | p-value | Est | SE | p-value | Est | SE | p-value | Est | SE | p-value | |||||
| Fixed effects | ||||||||||||||||
| Race/ethnicity¶ | ||||||||||||||||
| Hispanic – Spanish-preferring | −8.73 | 1.01 | *** | −0.10 | 1.43 | −2.41 | 1.13 | * | 6.87 | 0.87 | *** | |||||
| Hispanic – English-preferring | −3.21 | 0.34 | *** | −3.87 | 0.68 | *** | −2.64 | 0.41 | *** | −4.01 | 0.37 | *** | ||||
| NH-black | −2.66 | 0.41 | *** | −4.78 | 0.85 | *** | −1.51 | 0.46 | ** | −3.78 | 0.42 | *** | ||||
| NH-Asian/Pacific Islander | −6.82 | 0.62 | *** | −8.98 | 0.73 | *** | −7.55 | 0.59 | *** | −11.21 | 0.69 | *** | ||||
| Multiracial, unknown, and AI/AN | −2.46 | 0.19 | −3.62 | 0.36 | −2.17 | 0.18 | −1.78 | 0.16 | ||||||||
| Contract-level proportions | ||||||||||||||||
| Contract-level Hispanic Spanish-preferring proportion | −11.92 | 3.62 | *** | −16.29 | 6.58 | * | −27.67 | 3.86 | *** | −8.67 | 3.84 | * | ||||
| Contract-level NH-black proportion | −8.91 | 1.21 | *** | −13.69 | 2.21 | *** | −11.67 | 1.24 | *** | −8.70 | 1.26 | *** | ||||
| Contract-level NH-Asian/Pacific Islander proportion | -5.71 | 1.98 | ** | −10.31 | 3.52 | ** | −8.57 | 2.26 | *** | −9.92 | 2.54 | *** | ||||
| Race/ethnicity by contract-level proportions | ||||||||||||||||
| Hispanic Spanish-preferring by contract-level Hispanic Spanish-preferring proportion | 21.05 | 10.16 | * | 15.55 | 12.17 | 31.72 | 10.42 | ** | 19.57 | 7.58 | ** | |||||
| Hispanic English-preferring by contract-level Hispanic Spanish-preferring proportion | 13.69 | 4.92 | ** | 30.32 | 8.28 | *** | 17.00 | 5.19 | ** | 1.82 | 4.71 | |||||
| NH-black by contract-level NH-black proportion | 0.11 | 1.86 | 2.31 | 3.47 | −1.83 | 2.10 | 4.58 | 1.85 | * | |||||||
| NH-Asian/Pacific Islander by contract-level NH-Asian/Pacific Islander proportion | 8.31 | 3.48 | * | 12.26 | 3.84 | ** | 5.42 | 3.54 | 6.11 | 3.83 | ||||||
| Indicator for year 2009 survey | −0.14 | 0.07 | 0.80 | 0.17 | *** | 0.78 | 0.08 | *** | 0.59 | 0.08 | *** | |||||
| Random effects | Est | √Est | SE | p-value | Est | √Est | SE | p-value | Est | √Est | SE | p-value | Est | √Est | SE | p-value |
| Contract | 4.00 | 2.00 | 0.43 | *** | 9.79 | 3.13 | 1.31 | *** | 3.01 | 1.73 | 0.41 | *** | 2.82 | 1.68 | 0.38 | *** |
| Hospital Referral Region | 0.83 | 0.91 | 0.15 | *** | 2.90 | 1.70 | 0.71 | *** | 2.89 | 1.70 | 0.38 | *** | 12.18 | 3.49 | 1.22 | *** |
| Race/ethnicity by contract†† | ||||||||||||||||
| Hispanic Spanish-preferring by contract | 50.83 | 7.13 | 12.76 | *** | 17.68 | 4.21 | 12.57 | 35.72 | 5.98 | 11.98 | ** | 8.51 | 2.92 | 5.46 | ||
| Hispanic English-preferring by contract | 5.74 | 2.40 | 1.52 | *** | 4.34 | 2.08 | 2.92 | 3.12 | 1.77 | 1.13 | ** | 1.03 | 1.02 | 0.61 | * | |
| NH-white by contract | 0.00 | 0.00 | 0.87 | 0.93 | 0.99 | 0.13 | 0.36 | 0.24 | 0.64 | 0.80 | 0.28 | * | ||||
| NH-black by contract | 4.45 | 2.11 | 1.07 | *** | 5.33 | 2.31 | 3.16 | * | 4.39 | 2.10 | 1.28 | *** | 1.91 | 1.38 | 0.85 | * |
| NH-Asian/Pacific Islander by contract | 9.96 | 3.16 | 3.30 | ** | 0.66 | 0.81 | 3.00 | 12.70 | 3.56 | 4.28 | ** | 9.97 | 3.16 | 3.73 | ** | |
| Multiracial, unknown, and AI/AN by contract | 3.06 | 1.75 | 0.72 | *** | 4.63 | 2.15 | 2.20 | * | 1.70 | 1.31 | 0.66 | ** | 0.71 | 0.84 | 0.41 | * |
| Race/ethnicity by Hospital Referral Region | ||||||||||||||||
| Hispanic by Hospital Referral Region | 1.65 | 1.29 | 1.26 | 20.30 | 4.51 | 7.46 | ** | 9.01 | 3.00 | 3.17 | ** | 6.91 | 2.63 | 2.54 | ** | |
| NH-black by Hospital Referral Region | 4.70 | 2.17 | 1.53 | ** | 35.86 | 5.99 | 9.40 | *** | 6.99 | 2.64 | 1.97 | *** | 7.11 | 2.67 | 1.80 | *** |
| NH-Asian/Pacific Islander by Hospital Referral Region | 15.21 | 3.90 | 5.65 | ** | 2.82 | 1.68 | 3.63 | 4.25 | 2.06 | 3.01 | 15.80 | 3.98 | 7.57 | * | ||
| Residual | 240.3 | 15.50 | 0.58 | *** | 380.1 | 19.50 | 1.70 | *** | 272.0 | 16.49 | 0.70 | *** | 375.4 | 19.38 | 0.84 | *** |
| Customer Service | Doctor Communication | Had Flu Shot Last Year | Had Pneumonia Shot | |||||||||||||
|---|---|---|---|---|---|---|---|---|---|---|---|---|---|---|---|---|
| Est | SE | p-value | Est | SE | p-value | Est | SE | p-value | Est | SE | p-value | |||||
| Fixed effects | ||||||||||||||||
| Race/ethnicity¶ | ||||||||||||||||
| Hispanic – Spanish-preferring | −8.31 | 1.49 | *** | 1.19 | 0.61 | −2.96 | 1.25 | * | −19.05 | 1.40 | *** | |||||
| Hispanic – English-preferring | −2.05 | 0.65 | ** | −0.35 | 0.26 | −1.36 | 0.73 | −8.07 | 0.73 | *** | ||||||
| NH-black | −2.26 | 0.51 | *** | 0.41 | 0.24 | −13.25 | 0.77 | *** | −13.57 | 0.84 | *** | |||||
| NH-Asian/Pacific Islander | −7.59 | 0.80 | *** | −4.06 | 0.47 | *** | 3.93 | 0.85 | *** | −9.17 | 1.11 | *** | ||||
| Multiracial, unknown, and AI/AN | −1.52 | 0.25 | −1.00 | 0.11 | −2.33 | 0.28 | −3.01 | 0.31 | ||||||||
| Contract-level proportions | ||||||||||||||||
| Contract-level Hispanic Spanish-preferring proportion | −10.19 | 6.14 | −5.05 | 2.31 | * | −46.23 | 7.21 | *** | −53.45 | 7.45 | *** | |||||
| Contract-level NH-black proportion | −14.80 | 2.10 | *** | −2.52 | 0.73 | *** | −15.71 | 2.41 | *** | −13.71 | 2.45 | *** | ||||
| Contract-level NH-Asian/Pacific Islander proportion | −7.63 | 3.53 | * | −1.07 | 1.46 | −0.58 | 4.17 | −16.43 | 4.41 | *** | ||||||
| Race/ethnicity by contract-level proportions | ||||||||||||||||
| Hispanic Spanish-preferring by contract-level Hispanic Spanish-preferring proportion | 17.30 | 13.05 | 5.86 | 5.24 | 39.42 | 10.79 | *** | 45.91 | 12.57 | *** | ||||||
| Hispanic English-preferring by contract-level Hispanic Spanish-preferring proportion | 14.09 | 6.55 | * | 2.88 | 3.14 | 32.09 | 9.11 | *** | 9.88 | 9.46 | ||||||
| NH-black by contract-level NH-black proportion | 8.64 | 2.33 | *** | 0.08 | 1.09 | 10.20 | 3.30 | ** | 1.74 | 3.63 | ||||||
| NH-Asian/Pacific Islander by contract-level NH-Asian/Pacific Islander proportion | 5.23 | 4.60 | −1.50 | 2.43 | 0.51 | 4.62 | −9.25 | 5.65 | ||||||||
| Indicator for year 2009 survey | 1.07 | 0.12 | *** | 0.40 | 0.06 | *** | −2.13 | 0.14 | *** | 0.13 | 0.14 | |||||
| Random effects | Est | √Est | SE | p-value | Est | √Est | SE | p-value | Est | √Est | SE | p-value | Est | √Est | SE | p-value |
| Contract | 14.12 | 3.76 | 1.51 | *** | 0.48 | 0.69 | 0.10 | *** | 14.47 | 3.80 | 1.64 | *** | 15.19 | 3.90 | 1.66 | *** |
| Hospital Referral Region | 3.33 | 1.83 | 0.57 | *** | 1.41 | 1.19 | 0.19 | *** | 11.72 | 3.42 | 1.43 | *** | 11.27 | 3.36 | 1.38 | *** |
| Race/ethnicity by contract†† | ||||||||||||||||
| Hispanic Spanish-preferring by contract | 42.24 | 6.50 | 15.36 | ** | 4.11 | 2.03 | 2.03 | * | 11.26 | 3.36 | 6.89 | 26.28 | 5.13 | 10.97 | ** | |
| Hispanic English-preferring by contract | 2.51 | 1.58 | 1.65 | 0.30 | 0.55 | 0.29 | 10.54 | 3.25 | 3.52 | ** | 11.00 | 3.32 | 3.71 | ** | ||
| NH-white by contract | 0.87 | 0.93 | 0.62 | 0.16 | 0.40 | 0.09 | * | 2.87 | 1.70 | 1.02 | ** | 1.20 | 1.09 | 0.89 | ||
| NH-black by contract | 1.60 | 1.26 | 1.24 | 0.08 | 0.28 | 0.19 | 6.98 | 2.64 | 2.84 | ** | 12.35 | 3.52 | 3.38 | *** | ||
| NH-Asian/Pacific Islander by contract | 11.14 | 3.34 | 6.96 | 3.04 | 1.74 | 1.44 | * | 0.00 | 0.00 | 4.12 | 2.03 | 6.49 | ||||
| Multiracial, unknown, and AI/AN by contract | 2.29 | 1.51 | 1.06 | * | 0.22 | 0.47 | 0.19 | 0.19 | 0.43 | 1.50 | 3.75 | 1.94 | 1.95 | * | ||
| Race/ethnicity by Hospital Referral Region | ||||||||||||||||
| Hispanic by Hospital Referral Region | 35.08 | 5.92 | 9.16 | *** | 3.77 | 1.94 | 1.29 | ** | 30.87 | 5.56 | 8.25 | *** | 27.99 | 5.29 | 7.50 | *** |
| NH-black by Hospital Referral Region | 5.59 | 2.36 | 2.34 | ** | 1.73 | 1.31 | 0.59 | ** | 30.00 | 5.48 | 6.87 | *** | 34.34 | 5.86 | 7.94 | *** |
| NH-Asian/Pacific Islander by Hospital Referral Region | 11.49 | 3.39 | 7.09 | 8.42 | 2.90 | 3.26 | ** | 21.39 | 4.63 | 11.54 | * | 59.65 | 7.72 | 24.58 | ** | |
| Residual | 340.8 | 18.46 | 1.17 | *** | 173.5 | 13.17 | 0.41 | *** | 1,162 | 34.09 | 2.51 | *** | 1,140 | 33.76 | 2.54 | *** |
Notes: NH, non-Hispanic. Spanish-preferring refers to respondents who completed the survey in Spanish.
†All outcome measures were linearly rescaled to 0–100.
§The case-mix adjustors were age, education, self-rated overall health, self-rated mental health, proxy assistance, and indicator of year 2009 survey versus year 2008.
¶Responses from Puerto Rico were omitted from analysis. The reference racial/ethnic group is non-Hispanic white. There is also an indicator for multiracial, unknown, and AI/AN, not shown.
††There is a random effect for multiracial, unknown, and AI/AN by contract, not shown.
***p < .001; **p < .01; *p < .05.
Figure2a–d, constructed based upon the model results above, are interpretable in the same fashion as described above for Figure1a–d; however, in these figures, the proportion of interest is Spanish language preference. Figures for additional CAHPS measures are in the Appendix. The three lines each describe hypothetical contracts in which a proportion, x, of the members is Hispanic Spanish-preferring (i.e., Hispanic and responded to the CAHPS survey in Spanish), and a proportion, 1 − x, of the members is NH-white, where x is the value that appears on the horizontal axis. The starred red line represents values for Hispanics who responded to the CAHPS survey in Spanish. The starred purple line represents values for Hispanics who responded to the CAHPS survey in English, while the dotted black line represents NH-whites. The zero or reference point on the vertical axis corresponds to the average experience of NH-whites in a 100 percent NH-white contract. All other lines and points compare to this reference point. For example, in Figure2a, the vertical axis value on the starred red line corresponding to 0.3 on the horizontal axis indicates the experiences of Spanish-preferring Hispanics in a 30 percent Hispanic Spanish-preferring contract/70 percent NH-white contract relative to the experiences of NH-whites in a 100 percent NH-white contract with respect to customer service.
Figure 2.
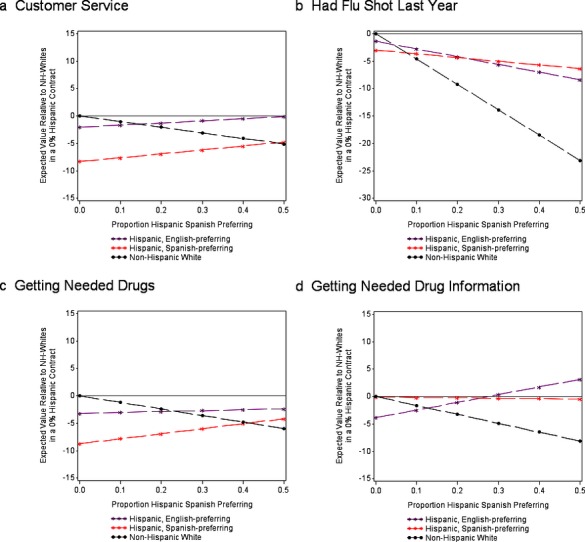
- Notes : The three lines each describe hypothetical contracts in which a proportion, x, of the members is Hispanic Spanish-preferring (i.e., Hispanic and responded to the CAHPS survey in Spanish), and a proportion, 1 − x, of the members is NH-white, where x is the value that appears on the horizontal axis. The starred red line represents values for Hispanics who responded to the CAHPS survey in Spanish. The starred purple line represents values for Hispanics who responded to the CAHPS survey in English, while the dotted black line represents NH-whites. The zero or reference point on the vertical axis corresponds to the average experience of NH-whites in a 100 percent NH-white contract. All other lines and points compare to this reference point.The highest observed concentrations of racial/ethnic language groups within contract are 93 percent NH-white, 92 percent Hispanic, and 47 percent Spanish-preferring Hispanic.
In Figure2a–d and Figure S2a–d, starred red lines representing Spanish-preferring Hispanics tend to slope upward mildly or to be flat, with two exceptions of slightly downward slopes for flu vaccination and pneumonia shot. This reflects a pattern in which Spanish-preferring Hispanics enrolled in contracts with a higher proportion of Spanish-preferring Hispanics report better care experiences than Spanish-preferring Hispanics in contracts with lower same-group proportions. The smaller or reversed disparities for English-preferring Hispanic beneficiaries in higher Spanish-preferring proportion contracts canceled or overwhelmed the overall decline with higher Spanish-preferring proportions for five of the eight CAHPS measures. Exceptions were getting care quickly, doctor communication, and pneumonia shot. The dotted black lines representing NH-whites indicate a consistently downward slope, indicating a pattern in which NH-whites enrolled in contracts with a higher proportion of Spanish-preferring Hispanics report worse care experiences than NH-whites enrolled in contracts with 0 percent Spanish-preferring Hispanics.
Discussion
Consistent with previous findings, we find substantial disparities in experiences of care and immunization for Hispanic, NH-black, and NH-API Medicare beneficiaries that are not accounted for by geography or which contracts beneficiaries select. Medicare managed care contracts with higher proportions of racial/ethnic minority beneficiaries tend to have less positive patient experiences overall than contracts with a lower proportion of minority enrollment. Racial/ethnic minorities enrolled in higher same-minority contracts report smaller within-contract disparities relative to NH-whites than minorities in lower same-minority contracts. However, the benefits of enrollment in higher same-minority contracts sometimes only partially counteract the tendency of those contracts to be worse overall. One implication of this pattern is that high-minority contracts are consistently worse for NH-white beneficiary experiences. In contrast, minority experiences are sometimes similar or better in contracts with high proportions of their group and sometimes higher in contracts with primarily NH-white beneficiaries.
The observed pattern is particularly dramatic for immunization. Analyses of the Medicare Current Beneficiary Survey have identified higher rates of missed opportunities for vaccination among NH-black and Hispanic beneficiaries than among NH-white beneficiaries who visit a health care provider during vaccination season (Hebert et al. 2005); other analyses have noted an association between perceived information-giving skills of physicians and vaccination of their patients (O'Malley and Forrest 2006). Although our data do not allow us to examine contracts' vaccine promotion efforts or their effects on minority immunization, one possibility is that contracts with higher minority enrollment make systematic efforts to promote vaccine education and recommendations for their minority beneficiaries. Such efforts may help to overcome both attitudinal barriers to vaccination, which are more prevalent among NH-black beneficiaries, and lower likelihood of initiating health care visits for vaccination among Hispanic and NH-black beneficiaries (Hebert et al. 2005).
We found that Hispanics benefitted more consistently from being enrolled in contracts with more members of their own racial/ethnic group than NH-blacks or NH-APIs. We hypothesized that contract Spanish proportion would have a large positive interaction with beneficiaries' Spanish preference and a moderate positive interaction with English-preferring Hispanic status, relative to English-preferring NH-whites. In other words, we hypothesized that within-plan differences would be most favorable for Spanish-preferring members in contracts with larger proportions of Spanish-speaking beneficiaries, with a smaller but similar pattern for English-preferring Hispanic beneficiaries. This prediction was well-supported in the data and is consistent with the possibility that contracts' provision of language services improves experiences of care for Hispanic beneficiaries, particularly those who are Spanish-preferring. While our data do not allow us to examine the language services available for each contract, it is possible that contracts with higher proportions of Spanish-preferring members respond to a greater need by offering more Spanish-speaking providers. As language services represent a core domain of culturally competent care (Weech-Maldonado et al. 2012a), similar benefits may accrue to beneficiary subpopulations for which other languages are primary. As the 2008 and 2009 MA CAHPS surveys were not fielded in Chinese or other Asian languages, we are not able to investigate the degree to which this is true for NH-API beneficiaries. However, this area is rich for further inquiry as the CAHPS family of surveys is translated and administered in additional languages. Further research is needed to examine the unique contribution of language services to better care experiences, and alternative explanations for our findings are possible. For example, contracts serving Hispanics may have provider networks that emphasize providers who encourage preventive practices, consistent with evidence that Hispanics are more likely than NH-whites to seek care from community health centers (Mead et al. 2008).
Racial concordance of health care providers and patients is one possible mechanism by which NH-black beneficiaries experience smaller within-plan disparities relative to NH-whites in receiving care more quickly and better health plan customer service in contracts with higher NH-black proportions. Prior research has found that NH-black patients with NH-black physicians report better experiences, more preventive care, and more involvement in decisions than NH-black patients with other physicians (Cooper-Patrick et al. 1999; Saha et al. 1999; LaVeist and Carroll 2002). MA CAHPS data do not allow us to investigate this hypothesis, as they do not include beneficiary-level information on providers or staff. Better experiences for English-preferring Hispanics in contracts with high proportions of Spanish-preferring and Hispanic beneficiaries may reflect a similar process.
Our study has several limitations. First, the observed differences in reports and ratings between subgroups may be attributable to both differences in the quality of care received and response bias. However, evidence from a prior study suggests that reported disparities among NH-black, Hispanic, and NH-white beneficiaries in CAHPS composites may primarily reflect differences in experiences, rather than differences in expectations and scale use (Weinick et al. 2011). Cultural differences may influence response tendencies and compromise our ability to accurately compare respondents of different racial/ethnic groups. Second, our data do not allow us to consider the role of managed care organization characteristics, such as plan type and staff composition, which may influence care experiences. Third, survey language may not be a perfect proxy for respondents' preferred language or the degree to which respondents speak Spanish at home or with health professionals.
We find that contracts with higher racial/ethnic minority enrollment provide poorer patient experiences overall. The concentration of minorities within some contracts presents opportunities for contracts to undertake targeted quality improvement efforts to meet the unique linguistic or cultural needs of their enrollees, and for contracts to become more responsive to the needs of diverse beneficiary populations. Efforts to improve cultural competence might include providing interpreter services to overcome linguistic barriers, recruiting and retaining a diverse workforce to improve communication, establishing a more welcoming environment attuned to the needs of diverse beneficiaries, training health care providers and administrative staff to improve cultural awareness and knowledge, developing health promotion materials that reflect culture-specific attitudes and values, and establishing clinic locations and hours of operation that help to overcome barriers to accessing care (Brach and Fraser 2000). The Office of Minority Health's National Standards for Culturally and Linguistically Appropriate Services provides guidance for development of relevant policies and practices (Office of Minority Health and Services 2013). Hospitals with greater cultural competency have been shown to offer better care experiences to both racial/ethnic minorities and their patient populations at large (Weech-Maldonado et al. 2012b). Future research should examine the degree to which efforts to improve cultural competence influence outpatient care experiences for racial/ethnic minorities. These results also have implications for Medicare beneficiaries' selection of plans. For Hispanic beneficiaries in particular, plans with low overall scores but high proportions of Hispanics may provide similar or better experiences than plans with higher overall scores. New CMS reporting of patient experience and clinical quality measures by racial/ethnic group within contracts can facilitate such comparisons (Martino et al. 2013).
Acknowledgments
Joint Acknowledgment/Disclosure Statement: This article was funded by CMS under contract number HHSM-500-2005-000281. We thank Fergal McCarthy MPhil for assistance with manuscript preparation.
Disclosures: None.
Disclaimers: None.
Supporting Information
Additional supporting information may be found in the online version of this article:
Appendix SA1: Author Matrix.
Table S1. MA CAHPS Composite Measures and Corresponding Survey Items.
Table S2. Case-Mix Adjusted Mean MA CAHPS Scores by Race and Ethnicity, with Case-Mix Adjusted Differences across Race/Ethnicity, Combined MA CAHPS 2008 and 2009 Data.
Figures S1. (a–d) Model-Based Predicted Results of Racial/Ethnic Disparities¹ by Contract Composition Relative to Non-Hispanic Whites in a Contract with Zero Percent Minorities,2 MA CAHPS Years 2008 and 2009 Combined.
Figures S2. (a–d) Model-Based Predicted Results of Hispanic and NH-White Disparities by Spanish Language Preference¹ and Contract Composition Relative to NH-Whites in a Contract with Zero Percent Hispanics,2 MA CAHPS Years 2008 and 2009 Combined Excluding Puerto Rico.
References
- Atherly A. Thorpe KE. Value of Medicare Advantage to Low-Income and Minority Medicare Beneficiaries. Atlanta, GA: Emory University; 2005. [Google Scholar]
- Brach C. Fraser I. Can Cultural Competency Reduce Racial and Ethnic Health Disparities? A Review and Conceptual Model. Medical Care Research and Review. 2000;57(Suppl 1):181–217. doi: 10.1177/1077558700057001S09. [DOI] [PMC free article] [PubMed] [Google Scholar]
- Browne K, Roseman D, Shaller D. Edgman-Levitan S. Analysis & Commentary. Measuring Patient Experience as a Strategy for Improving Primary Care. Health Affairs. 2010;29(5):921–5. doi: 10.1377/hlthaff.2010.0238. [DOI] [PubMed] [Google Scholar]
- Cooper-Patrick L, Gallo JJ, Gonzales JJ, Vu HT, Powe NR, Nelson C. Ford DE. Race, Gender, and Partnership in the Patient-Physician Relationship. Journal of the American Medical Association. 1999;282(6):583–9. doi: 10.1001/jama.282.6.583. [DOI] [PubMed] [Google Scholar]
- Davies E, Shaller D, Edgman-Levitan S, Safran DG, Oftedahl G, Sakowski J. Cleary PD. Evaluating the Use of a Modified CAHPS Survey to Support Improvements in Patient-Centred Care: Lessons from a Quality Improvement Collaborative. Health Expectations: An International Journal of Public Participation in Health Care and Health Policy. 2008;11(2):160–76. doi: 10.1111/j.1369-7625.2007.00483.x. [DOI] [PMC free article] [PubMed] [Google Scholar]
- Elliott MN, Haviland AM, Dembosky JW, Hambarsoomian K. Weech-Maldonado R. Are There Differences in the Medicare Experiences of Beneficiaries in Puerto Rico Compared with Those in the U.S. Mainland? Medical Care. 2012;50(3):243–8. doi: 10.1097/MLR.0b013e3182408027. [DOI] [PubMed] [Google Scholar]
- Elliott MN, Haviland AM, Kanouse DE, Hambarsoomian K. Hays RD. Adjusting for Subgroup Differences in Extreme Response Tendency in Ratings of Health Care: Impact on Disparity Estimates. Health Services Research. 2009;44(2 Pt 1):542–61. doi: 10.1111/j.1475-6773.2008.00922.x. [DOI] [PMC free article] [PubMed] [Google Scholar]
- Elliott MN, Haviland AM, Orr N, Hambarsoomian K. Cleary PD. How Do the Experiences of Medicare Beneficiary Subgroups Differ between Managed Care and Original Medicare? Health Services Research. 2011;46(4):1039–58. doi: 10.1111/j.1475-6773.2011.01245.x. [DOI] [PMC free article] [PubMed] [Google Scholar]
- Elliott MN, Lehrman WG, Goldstein E, Hambarsoomian K, Beckett MK. Giordano LA. Do Hospitals Rank Differently on HCAHPS for Different Patient Subgroups? Medical Care Research and Review. 2010;67(1):56–73. doi: 10.1177/1077558709339066. [DOI] [PubMed] [Google Scholar]
- Fongwa MN, Cunningham W, Weech-Maldonado R, Gutierrez PR. Hays RD. Reports and Ratings of Care: Black and White Medicare Enrollees. Journal of Health Care for the Poor and Underserved. 2008;19(4):1136–47. doi: 10.1353/hpu.0.0074. [DOI] [PubMed] [Google Scholar]
- Friedberg MW, SteelFisher GK, Karp M. Schneider EC. Physician Groups' Use of Data from Patient Experience Surveys. Journal of General Internal Medicine. 2011;26(5):498–504. doi: 10.1007/s11606-010-1597-1. [DOI] [PMC free article] [PubMed] [Google Scholar]
- Goldstein E, Cleary PD, Langwell KM, Zaslavsky AM. Heller A. Medicare Managed Care CAHPS: A Tool for Performance Improvement. Health Care Financing Review. 2001;22(3):101–7. [PMC free article] [PubMed] [Google Scholar]
- Goldstein E, Elliott MN, Lehrman WG, Hambarsoomian K. Giordano LA. Racial/Ethnic Differences in Patients' Perceptions of Inpatient Care Using the HCAHPS Survey. Medical Care Research and Review. 2010;67(1):74–92. doi: 10.1177/1077558709341066. [DOI] [PubMed] [Google Scholar]
- Hargraves JL, Hays RD. Cleary PD. Psychometric Properties of the Consumer Assessment of Health Plans Study (CAHPS) 2.0 Adult Core Survey. Health Services Research. 2003;38(6 Pt 1):1509–27. doi: 10.1111/j.1475-6773.2003.00190.x. [DOI] [PMC free article] [PubMed] [Google Scholar]
- Haviland AM, Elliott MN, Hambarsoomian K. Lurie N. Immunization Disparities by Hispanic Ethnicity and Language Preference. Archives of Internal Medicine. 2011;171(2):158–65. doi: 10.1001/archinternmed.2010.499. [DOI] [PubMed] [Google Scholar]
- Haviland AM, Elliott MN, Weech-Maldonado R, Hambarsoomian K, Orr N. Hays RD. Racial/Ethnic Disparities in Medicare Part D Experiences. Medical Care. 2012;50(Suppl):S40–7. doi: 10.1097/MLR.0b013e3182610aa5. [DOI] [PMC free article] [PubMed] [Google Scholar]
- Hays RD, Shaul JA, Williams VS, Lubalin JS, Harris-Kojetin LD, Sweeny SF. Cleary PD. Psychometric Properties of the CAHPS 1.0 Survey Measures. Consumer Assessment of Health Plans Study. Medical Care. 1999;37(3 Suppl):MS22–31. doi: 10.1097/00005650-199903001-00003. [DOI] [PubMed] [Google Scholar]
- Hebert PL, Frick KD, Kane RL. McBean AM. The Causes of Racial and Ethnic Differences in Influenza Vaccination Rates among Elderly Medicare Beneficiaries. Health Services Research. 2005;40(2):517–37. doi: 10.1111/j.1475-6773.2005.00370.x. [DOI] [PMC free article] [PubMed] [Google Scholar]
- Hibbard JH. Jewett JJ. What Type of Quality Information Do Consumers Want in a Health Care Report Card? Medical Care Research and Review. 1996;53(1):28–47. doi: 10.1177/107755879605300102. [DOI] [PubMed] [Google Scholar]
- Klein DJ, Elliott MN, Haviland AM, Saliba D, Burkhart Q, Edwards C. Zaslavsky AM. Understanding Nonresponse to the 2007 Medicare CAHPS Survey. Gerontologist. 2011;51(6):843–55. doi: 10.1093/geront/gnr046. [DOI] [PubMed] [Google Scholar]
- Kolstad JT. Chernew ME. Quality and Consumer Decision Making in the Market for Health Insurance and Health Care Services. Medical Care Research and Review. 2009;66(1 Suppl):28S–52S. doi: 10.1177/1077558708325887. [DOI] [PubMed] [Google Scholar]
- LaVeist TA. Carroll T. Race of Physician and Satisfaction with Care among African-American Patients. Journal of the National Medical Association. 2002;94(11):937–43. [PMC free article] [PubMed] [Google Scholar]
- Lurie N, Zhan C, Sangl J, Bierman AS. Sekscenski ES. Variation in Racial and Ethnic Differences in Consumer Assessments of Health Care. American Journal of Managed Care. 2003;9(7):502–9. [PubMed] [Google Scholar]
- Martino SC, Elliott MN, Cleary PD, Kanouse DE, Brown JA, Spritzer KL, Heller A. Hays RD. Psychometric Properties of an Instrument to Assess Medicare Beneficiaries' Prescription Drug Plan Experiences. Health Care Financing Review. 2009;30(3):41–53. [PMC free article] [PubMed] [Google Scholar]
- Martino SC, Weinick RM, Kanouse DE, Brown JA, Haviland AM, Goldstein E, Adams JL, Hambarsoomian K, Klein DJ. Elliott MN. Reporting CAHPS and HEDIS Data by Race/Ethnicity for Medicare Beneficiaries. Health Services Research. 2013;48(2 Pt 1):417–34. doi: 10.1111/j.1475-6773.2012.01452.x. [DOI] [PMC free article] [PubMed] [Google Scholar]
- Mead H, Cartwright-Smith L, Jones K, Ramos C. Siegel B. Racial and Ethnic Disparities in U.S. Health Care: A Chartbook. New York: The Commonwealth Fund; 2008. [Google Scholar]
- Morales LS, Cunningham WE, Brown JA, Liu H. Hays RD. Are Latinos Less Satisfied with Communication by Health Care Providers? Journal of General Internal Medicine. 1999;14(7):409–17. doi: 10.1046/j.1525-1497.1999.06198.x. [DOI] [PMC free article] [PubMed] [Google Scholar]
- Morales LS, Elliott MN, Weech-Maldonado R, Spritzer KL. Hays RD. Differences in CAHPS Adult Survey Reports and Ratings by Race and Ethnicity: An Analysis of the National CAHPS Benchmarking Data 1.0. Health Services Research. 2001;36(3):595–617. [PMC free article] [PubMed] [Google Scholar]
- Office of Minority Health and Services. National Standards for Culturally and Linguistically Appropriate Services in Health and Health Care: A Blueprint for Advancing and Sustaining CLAS Policy and Practice. Washington, DC: Office of Minority Health, U.S. Department of Health and Human Services; 2013. [Google Scholar]
- O'Malley AS. Forrest CB. Immunization Disparities in Older Americans: Determinants and Future Research Needs. American Journal of Preventive Medicine. 2006;31(2):150–8. doi: 10.1016/j.amepre.2006.03.021. [DOI] [PubMed] [Google Scholar]
- Orr N, Elliott MN, Burkhart Q, Haviland A. Weinick RM. Racial/Ethnic Differences in Medicare Experiences and Immunization: The Role of Disease Burden. Medical Care. 2013;51(9):823–31. doi: 10.1097/MLR.0b013e31829c8d77. [DOI] [PubMed] [Google Scholar]
- Rodriguez HP, von Glahn T, Grembowski DE, Rogers WH. Safran DG. Physician Effects on Racial and Ethnic Disparities in Patients' Experiences of Primary Care. Journal of General Internal Medicine. 2008;23(10):1666–72. doi: 10.1007/s11606-008-0732-8. [DOI] [PMC free article] [PubMed] [Google Scholar]
- Saha S, Komaromy M, Koepsell TD. Bindman AB. Patient-Physician Racial Concordance and the Perceived Quality and Use of Health Care. Archives of Internal Medicine. 1999;159(9):997–1004. doi: 10.1001/archinte.159.9.997. [DOI] [PubMed] [Google Scholar]
- Schneider EC, Zaslavsky AM. Epstein AM. Racial Disparities in the Quality of Care for Enrollees in Medicare Managed Care. Journal of the American Medical Association. 2002;287(10):1288–94. doi: 10.1001/jama.287.10.1288. [DOI] [PubMed] [Google Scholar]
- Spranca M, Kanouse DE, Elliott M, Short PF, Farley DO. Hays RD. Do Consumer Reports of Health Plan Quality Affect Health Plan Selection? Health Services Research. 2000;35(5 Pt 1):933–47. [PMC free article] [PubMed] [Google Scholar]
- Weech-Maldonado R, Morales LS, Spritzer K, Elliott M. Hays RD. Racial and Ethnic Differences in Parents' Assessments of Pediatric Care in Medicaid Managed Care. Health Services Research. 2001;36(3):575–94. [PMC free article] [PubMed] [Google Scholar]
- Weech-Maldonado R, Morales LS, Elliott M, Spritzer K, Marshall G. Hays RD. Race/Ethnicity, Language, and Patients' Assessments of Care in Medicaid Managed Care. Health Services Research. 2003;38(3):789–808. doi: 10.1111/1475-6773.00147. [DOI] [PMC free article] [PubMed] [Google Scholar]
- Weech-Maldonado R, Elliott MN, Morales LS, Spritzer K, Marshall GN. Hays RD. Health Plan Effects on Patient Assessments of Medicaid Managed Care among Racial/Ethnic Minorities. Journal of General Internal Medicine. 2004;19(2):136–45. doi: 10.1111/j.1525-1497.2004.30235.x. [DOI] [PMC free article] [PubMed] [Google Scholar]
- Weech-Maldonado R, Elliott MN, Oluwole A, Schiller KC. Hays RD. Survey Response Style and Differential Use of CAHPS Rating Scales by Hispanics. Medical Care. 2008a;46(9):963–8. doi: 10.1097/MLR.0b013e3181791924. [DOI] [PMC free article] [PubMed] [Google Scholar]
- Weech-Maldonado R, Fongwa MN, Gutierrez P. Hays RD. Language and Regional Differences in Evaluations of Medicare Managed Care by Hispanics. Health Services Research. 2008b;43(2):552–68. doi: 10.1111/j.1475-6773.2007.00796.x. [DOI] [PMC free article] [PubMed] [Google Scholar]
- Weech-Maldonado R, Carle A, Weidmer B, Hurtado M, Ngo-Metzger Q. Hays RD. The Consumer Assessment of Healthcare Providers and Systems (CAHPS) Cultural Competence (CC) Item Set. Medical Care. 2012a;50(9 Suppl 2):S22–31. doi: 10.1097/MLR.0b013e318263134b. [DOI] [PMC free article] [PubMed] [Google Scholar]
- Weech-Maldonado R, Elliott M, Pradhan R, Schiller C, Hall A. Hays RD. Can Hospital Cultural Competency Reduce Disparities in Patient Experiences with Care? Medical Care. 2012b;50(Suppl):S48–55. doi: 10.1097/MLR.0b013e3182610ad1. [DOI] [PMC free article] [PubMed] [Google Scholar]
- Weinick RM, Elliott MN, Volandes AE, Lopez L, Burkhart Q. Schlesinger M. Using Standardized Encounters to Understand Reported Racial/Ethnic Disparities in Patient Experiences with Care. Health Services Research. 2011;46(2):491–509. doi: 10.1111/j.1475-6773.2010.01214.x. [DOI] [PMC free article] [PubMed] [Google Scholar]
- Weinick R, Haviland A, Hambarsoomian K. Elliott MN. Does the Racial/Ethnic Composition of Medicare Advantage Plans Reflect Their Areas of Operation? Health Services Research. 2014;49(2):526–45. doi: 10.1111/1475-6773.12100. [DOI] [PMC free article] [PubMed] [Google Scholar]
- Wennberg JE. The Dartmouth Atlas of Health Care. I. American Hospital Publishing. Hanover, NH: Dartmouth Medical School and Center for the Evaluative Clinical Sciences; 1998. [Google Scholar]
Associated Data
This section collects any data citations, data availability statements, or supplementary materials included in this article.
Supplementary Materials
Appendix SA1: Author Matrix.
Table S1. MA CAHPS Composite Measures and Corresponding Survey Items.
Table S2. Case-Mix Adjusted Mean MA CAHPS Scores by Race and Ethnicity, with Case-Mix Adjusted Differences across Race/Ethnicity, Combined MA CAHPS 2008 and 2009 Data.
Figures S1. (a–d) Model-Based Predicted Results of Racial/Ethnic Disparities¹ by Contract Composition Relative to Non-Hispanic Whites in a Contract with Zero Percent Minorities,2 MA CAHPS Years 2008 and 2009 Combined.
Figures S2. (a–d) Model-Based Predicted Results of Hispanic and NH-White Disparities by Spanish Language Preference¹ and Contract Composition Relative to NH-Whites in a Contract with Zero Percent Hispanics,2 MA CAHPS Years 2008 and 2009 Combined Excluding Puerto Rico.