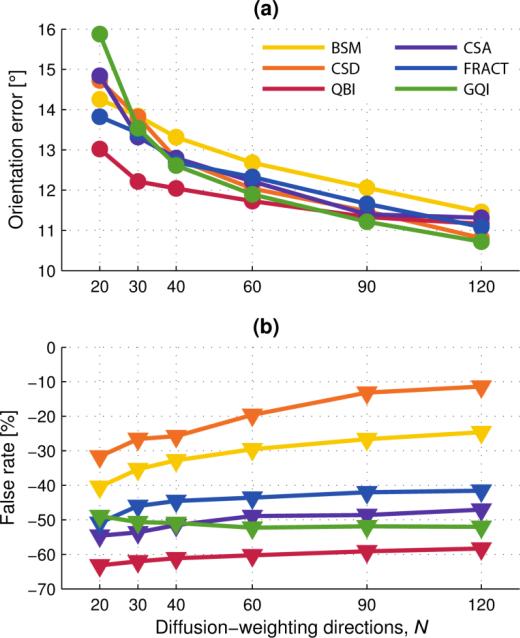
Fig. 6.
Three fiber estimation versus number of diffusion-weighting gradient directions, N. Multi-fiber analysis method indicated by color according to the legend. Filled markers (circle and triangle) are mean values of the quantity indicated. (a) Individual fiber orientation error. (b) Corresponding false-negative rate.

