

Abstract
The lymphatic system is vital to a proper maintenance of fluid and solute homeostasis. Collecting lymphatics are composed of actively contracting tubular vessels segmented by bulbous sinus regions that encapsulate bi-leaflet check valves. Valve resistance to forward flow strongly influences pumping performance. However, because of the sub-millimeter size of the vessels with flow rates typically < 1 ml/hour and pressures of a few cmH2O, resistance is difficult to measure experimentally. Using a newly defined idealized geometry, we employed an uncoupled approach where the solid leaflet deflections of the open valve were computed and lymph flow calculations were subsequently performed. We sought to understand: 1) the effect of sinus and leaflet size on the resulting deflections experienced by the valve leaflets and 2) the effects on valve resistance to forward flow of the fully open valve. For geometries with sinus-to-root diameter ratios > 1.39, the average resistance to forward flow was 0.95 × 10⁶ [g/(cm4 s)]. Compared to the viscous pressure drop that would occur in a straight tube the same diameter as the upstream lymphangion, valve leaflets alone increase the pressure drop up to 35%. However, the presence of the sinus reduces viscous losses, with the net effect that when combined with leaflets the overall resistance is less than that of the equivalent continuing straight tube. Accurately quantifying resistance to forward flow will add to the knowledge used to develop therapeutics for treating lymphatic disorders and may eventually lead to understanding some forms of primary lymphedema.
Keywords: Finite element analysis, Computational fluid dynamics, Lymphatic valves, Flow resistance
INTRODUCTION
The lymphatic system plays vital roles in physiologic fluid and solute homeostasis as well as immune cell transport. It is responsible for the uptake of fluid and solutes from the interstitial spaces and their subsequent return to the venous system. Its dysfunction could result in a number of pathologies, including lymphedema, e.g. build-up of interstitial fluid (IF) that, if left untreated, could lead to chronic inflammation and/or tissue fibrosis (Avraham et al., 2013). Two types of valves are present within the lymphatic vasculature (primary and secondary) and both play a crucial role in maintaining effective net forward lymphatic fluid (lymph) flow. Valve defects have been shown to underlie the pathogenesis of lymphatic distichiasis, a dominantly inherited form of primary lymphedema (Mellor et al., 2007; Petrova et al., 2004). Additionally, physical injury to valves occurs in lymphatic filariasis (Case et al., 1991), which is the most common cause of lymphedema in the world (Pfarr et al., 2009). The initial lymphatics eventually give rise to collecting vessels which are tubular in structure and segmented into discrete units called lymphangions (Mislin and Schipp, 1966) by bulbous sinus regions that encapsulate bi-leaflet check valves.
Non-linear optical microscopy imaging of rat mesenteric lymphatic vessels has shown the valve leaflet matrix to be primarily composed of elastin but anchored to the wall of the lymphatic vessel by thick axially oriented bands of collagen (Rahbar et al., 2012). The region of the lymphatic wall containing these secondary valves is surrounded by a bulbous sinus. The sinus represents an increase in the radial dimension of the lymphatic starting near the upstream site where the leaflets radially insert into the lymphatic wall that continues axially past the trailing edge of the valve leaflets. This suggests that the regional differentiation of composition provides structural support for the lymphatic valves. The valve leaflets of rat mesenteric lymphatics are covered by lymphatic endothelium on the inner and outer surfaces. The endothelium on the valve leaflets and sinus region has been shown to have a high expression of endothelial nitric oxide synthase, the enzyme responsible for shear-dependent production of nitric oxide (NO) in the lymphatics (Bohlen et al., 2009) and serves as a critical regulator of lymphatic pumping function (Bohlen et al., 2011). It has also been shown through experiments with isolated and pressurized rat mesenteric lymphatic vessel segments with multiple valves that gradual increases in outlet pressure result in decreases in opening times. The closing pressure difference (across pipettes and vessel segments) required for one valve segment varied more than 20-fold (0.1–2.2 cmH2O) with increasing transmural pressure. The pressure difference required to open the valve varied as well, but not to the same degree (Davis et al., 2011). The results further demonstrated the valve is biased in the open position. However, given that the valve closing pressure experiment begins with flow in the vessel, it is necessary to account for pipette resistance in estimating the true pressure difference required for closing (Bertram et al., 2014b). Both closing pressure and opening pressure differences are certainly dependent on transmural pressure, but experimental evaluation is confounded not only by issues such as pipette resistance, but also by the sizes of the vessels (approximately 100 μm in diameter).
Lumped parameter modeling of lymphatic pumping has shown the valve resistance to forward flow to be one of the most important parameters in determining pumping efficiency (Jamalian et al., 2013), particularly at lower values of imposed pressure difference. In particular, that model demonstrated an order-of-magnitude increase in flow rate results when the minimum valve resistance is decreased from 8 × 10⁶ to 1 × 10⁶ [g/(cm4 s)] for an imposed adverse pressure difference of 0.10 cmH2O. As a follow-up study to the above-mentioned valve opening and closing experiments, Bertram et al. estimated the open valve resistance and found it to be 0.6 × 10⁶ [g/(cm4 s)] (Bertram et al., 2014b). This estimation involved experiments where lymphatic vessels were cannulated and pressurized, whilst a constant flow rate was applied through each segment. There were considerable technical challenges involved, including the fact that the majority of the resistance in the flow system is determined by the cannulating pipettes. The resulting pressure-flow data were quite noisy as a result, and since resistance is estimated by the slope of that relationship, there was considerable uncertainty in the result.
Unlike valves in blood vessels, lymphatic valves have not been studied extensively, in part because of the experimental difficulties listed above. The only modeling study we are aware of is our previous work analyzing flow patterns in a stationary valve geometry based on a three-dimensional (3D) confocal image of a lymphatic valve (Wilson et al., 2013). We found that flow stagnation occurred in regions adjacent to the valve leaflets, resulting in a build-up of lymphatic endothelial cell-derived NO that matched the NO data we have previously measured using NO sensitive electrodes in rat mesenteric lymphatics in situ (Bohlen et al., 2009). However, the valve and wall geometries in this computational model were completely static, failing to account for leaflet movement as well as the fact that lymphatic vessels expand and contract dramatically, often more than 50% of the original diameter (Dixon et al., 2006). Capturing fully dynamic images of valve movement is experimentally complicated by the fact that these large deflections occur over small time-scales of less than 0.5 seconds.
The study reported herein seeks to investigate: 1) the effect of sinus and leaflet size on the resulting deflections experienced by the valve leaflets and 2) the resulting effects on valve resistance to forward flow. In particular, we seek to calculate the valve resistance to forward flow using a combination of finite element (FE) analysis of the structural deflections of the valve leaflet and computational fluid dynamics (CFD) to determine the local flow patterns based upon the leaflet configurations resulting from these deflections. Because we are most interested in the minimum resistance to flow, we employ an uncoupled approach in which the deflection of the fully open valve is first calculated, and then the flow is calculated.
METHODS
Idealized Lymphatic Valve Geometry and Meshing
A 3D parametric representation of a lymphatic valve and sinus (Fig. 1c–e) was designed based on confocal image-based data from experiments where intravital imaging was performed of isolated rat mesenteric lymphatic vessels (Fig. 1a–b) (for details on the isolated rat mesenteric preparation see Appendix A in supplementary material). The images were analyzed using OsiriX (UCLA, Los Angeles, CA, USA) and ImageJ (National Institutes of Health, Bethesda, MD, USA) to extract geometric parameters (Tables 1 and 2) to aid in the construction of the idealized valve based on a parametric surface map.
Figure 1. Example of confocal images (a) and 3D reconstruction (b) analyzed to construct the parametric geometry (c – e).

(a) In-plane confocal image from a 3D stack of a rat mesenteric lymphatic vessel. (b) 3D confocal reconstruction to illustrate the geometry of the valve. Calibration bar = 40 μm (Davis et al., 2011). (c) Side-view of the lymphatic geometry with leaflets in a barely open position. Vertical grey lines at the root of the valve near the leaflet insertions and at the end of the sinus indicate cross-sectional locations of pressure sampling planes used during Step III. (d) View of the lymphatic valve leaflets where trailing edge and commissural incissura are clearly visible. Note coordinates of the annulus (xc, yann, zann) and leaflet edge (xc, yedge, zedge) are indicated in blue and green text, respectively. (e) Schematic of the lymphatic valve geometry with key dimensions (dimension values are noted in Table 2).
Table 1.
Measurements obtained from images of the pressurized rat mesenteric lymphatic vessel. Measurements reflect values of interest from one vessel subjected to range of pressure differences.
| Pressure input description | Symbol (units) | Input Parameter Values | |||
|---|---|---|---|---|---|
| Inlet (Pin) and outlet (Pout) | Pin (cmH2O) | 6 | 3 | 3 | 1 |
| Pout (cmH2O) | 1 | 1 | 4 | 6 | |
| Description | Symbol (units) | Measured Parameter Values | |||
|---|---|---|---|---|---|
| Maximum diameter of the sinus area | Dmax (μm) | 163 | 155 | 160 | 167 |
| Height from the root to the commissural incissura measured in the axial direction | Hc (μm) | 246 | 243 | 237 | 232 |
| Height from the root to the trailing edge | Hte (μm) | 134 | 144 | 120 | 134 |
| Length from root to maximum diameter | Hmd (μm) | 228 | 216 | 218 | 194 |
| Length of the total sinus region | Hs (μm) | 456 | 432 | 436 | 388 |
| Diameter of the elliptic orifice | do (μm) | 71 | 66 | closed | closed |
| Diameter of root | Dr (μm) | 112 | 105 | 102 | 95 |
| Sinus-to-root ratio | STR (n/a) | 1.46 | 1.48 | 1.57 | 1.76 |
Table 2.
Description of key parameters used in idealized geometry construction.
| Symbol | Value, Units |
|---|---|
| Dmax | 100–300 μm |
| Hc | 240 μm |
| Hte | 136 μm |
| Hmd | 217 μm |
| Hs | 434 μm |
| do | 2 μm |
| Dr | 100 μm |
| STR | 1–3 |
To assist in identifying the dimensions of the lymphatic valve and sinus, we analyzed additional valve regions using immunofluorescence histochemistry. In particular, the ratio of the maximum diameter of the sinus, Dmax, to the diameter of the incoming lymphangion, Dr (sinus-to-root ratio, STR = Dmax/Dr) and the ratio of the total sinus length, Hs, to Dr (length-to-root ratio, LTR = Hs/Dr) were measured for 74 rat mesenteric lymphatic vessels (Fig. 2) (for details on these experiments see Appendix A in supplementary material). STR ranged from 1.20 to 2.66 with a mean of 1.65 (Fig. 2a). LTR ranged from 3.22 to 12.96 with a mean of 5.78 (Fig. 2b).
Figure 2. Distribution of STR values (a) and LTR values (b), for various rat mesenteric lymphatic sinus regions (n=74).

Estimated STR values had a mean of 1.65, while LTR values had a mean of 5.78.
Due to the expectation that STR would have a profound influence on leaflet deformations and thus resistance to flow, we chose to vary it over the physiologic range, holding LTR constant. STR was varied from 1 to 3 in average steps of 0.06 (varying Dmax only). Hs and Dr were held constant at 434 μm and 100 μm, respectively (LTR = 4.34). Further details regarding the construction of the leaflets and sinus can be found in Appendix A (supplementary material).
Overview of Computational Workflow
The computational workflow consists of three steps (Fig. 3). Step I involves performing CFD simulations to determine the pressure loads applied to the valve leaflets in the FE simulations to determine the deflected leaflet geometries (Step II). During Step III, CFD simulations were performed using the leaflet geometries obtained from Step II.
Figure 3. Flow chart of computational workflow.
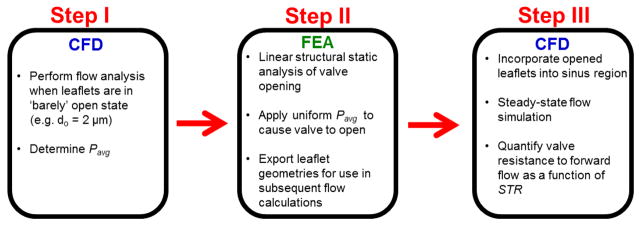
CFD simulations using valves in the barely open configuration (do=2 μm) were performed, and the mean of the average pressures across each leaflet, Pavg, was determined for each geometry (Step I). Pavg was applied to each leaflet in the FE simulations to open the valve leaflets (Step II). Deflected valve leaflet geometries were extracted from the FE simulation data and incorporated into the sinus region. Steady-state flow simulations were performed to determine the valve resistance to forward flow (Step III).
Step I: CFD to determine pressure loading conditions for FE simulations
To determine the required pressure loading conditions for FE simulations, flow simulations were performed in which the leaflets began in a ‘barely-open’ state (do= 2 μm). The sinus corresponding to the deflected leaflets, based on the STR ratio, was merged to the leaflets’ edges to create a complete sinus-leaflet geometry (Fig. 1c). The inlet and outlet of the sinus geometry were extruded by 200 μm to facilitate the application of boundary conditions to allow for fully developed flow (Wilson et al., 2013). The valve leaflets were modeled as interfaces with infinitesimal thickness due to the relatively small ratio of leaflet-thickness to sinus-diameter (unpublished observations).
Lymph was assumed to be Newtonian and incompressible (dynamic viscosity, μ, of 0.9 cP and density, ρ, of 1 g/cm3, corresponding to experimental conditions in which APSS is the working fluid). Steady simulations were performed using the commercial CFD software Star-CCM+ (v9.02.007, CD-adapco, Melville, NY, USA). A uniform velocity profile was applied at the entrance with an average velocity, V, of 1.5 mm/s [Reynolds number (Re) of 0.17 with Re= rVDr/m], which is in the physiologic range of velocities observed during in situ experiments (Dixon et al., 2006). The outlet boundary condition was defined to have a gauge pressure of zero; residuals were allowed to reach a value in the order of 10−4 to ensure adequate convergence. In post-processing, the centerline inlet pressures were raised by the total pressure drop of the equivalent straight tube (no sinus, no valve) to equalize the inlet pressures so that the effects of the different geometric features on overall pressure drop could be better visualized.
Average pressure values were extracted from either side of the top and bottom leaflets and the trans-leaflet pressure was calculated for each. While the geometry is symmetric, minor details during manual mesh repair caused slight variations between the top and bottom leaflet surfaces, resulting in small differences in average pressure values between the two (less than 0.1% difference across all STR values). Thus, the mean of the two values of trans-leaflet pressure from the top and bottom was calculated to obtain the final pressure load, Pavg, subsequently applied to leaflets during FE simulations. CFD grid independence was also confirmed based on the criteria of less than 10 % error in wall shear stress set forth by Prakash and Ethier for arterial flows (Prakash and Ethier, 2001) (Appendix A in supplementary material).
Step II: Finite Element (FE) Analysis
Leaflet geometries were imported into ANSYS Mechanical (v15.0, ANSYS, Cecil Township, PA, USA) and a neo-Hookean model (Gundiah et al., 2007, 2009; Watton et al., 2009) was employed (Appendix A in supplementary material). The initial shear modulus, G, was set as 45kPa, which is in the range values experimentally determined for arterial elastin (Mithieux and Weiss, 2005; Nivison-Smith and Weiss, 1997; Zou and Zhang, 2009). The material was assumed to be nearly incompressible with a Poisson ratio, ν, of 0.499. A shell element was used to mesh the leaflets with a prescribed thickness of 5 μm and element face size of 2 μm. A contact algorithm using Gauss-point detection between the leaflets was used, and grid independence was also confirmed (Appendix A in supplementary material). A static structural solver was used to simulate opening the leaflets. The imposed transvalvular pressure was increased linearly in 50 steps to a maximum value of Pavg, computed through Step I. The annuli of the valve leaflets attached to the wall of the sinus were set as fixed supports. Upon simulation convergence, the deflected leaflet geometries were exported for incorporation into subsequent CFD simulations.
Step III: CFD with the deflected leaflets
Leaflets were incorporated into the sinus region and the same meshing and boundary conditions as described in Step I were employed for these flow simulations. Using pressure and flow data computed through Step III, the resistance to forward flow, Rf, was calculated as R f = DP/Q, where Q is the volumetric flow rate and ΔP is the difference between the pressures averaged at cross sections perpendicular to the axial direction of flow at the root of the valve leaflet and at the end of the sinus (Fig. 1c).
RESULTS
Simulations revealed approximately uniform distributions of pressure on the leaflet faces for each value of STR (Fig. 4a). Pavg, computed during Step I, decreased with increasing STR (from 1015 dyn/cm2 for STR = 1.0 to 643 dyn/cm2 for STR = 3.0), attributed to a geometrical increase in surface area and reduced curvature of the leaflets with elevated STR values (Fig. 4b). Throughout valve-opening, high strain concentrations developed along the annulus of the valve leaflet where the fixed boundary condition was applied (Fig. 5). The maximum von-Mises strain observed for STR = 1.6 was 0.13. Simulations using larger STR values resulted in approximately the same maximum strain. As expected, von-Mises stress distributions (not shown) qualitatively matched those of strain. CFD simulations using the deflected valve geometries revealed higher velocities in simulations with smaller STR values (Fig. 6), which can be attributed to a smaller orifice area at the trailing edge. Stagnant, slightly reversing flow was observed in the sinus regions adjacent to the valve leaflets (Fig. 6d). The magnitudes of these velocities were less than 0.1 mm/s, compared to 3.6 mm/s in the central jet for STR = 1.42
Figure 4. Pavg values obtained from Step I of computational workflow.

(a) Distributions of pressure at the leaflet surface exposed to central lymph flow. (b) Pavg as a function of STR. Pavg ranges from 1015 dyn/cm2 for STR = 1 to 643 dyn/cm2 for STR = 3.0.
Figure 5. von-Mises strain distributions for leaflets (STR = 1.6) during four incremental loads in the static analysis obtained during Step II.

The respective incremental pressure loads are (a) 17 dyn/cm2; (b) 558 dyn/cm2; (c) 575 dyn/cm2; and (d) 872 dyn/cm2. Throughout valve-opening, high strain concentrations developed along the annulus of the valve leaflet where the fixed boundary condition was applied.
Figure 6. Cross-sections of velocity obtained during Step III (vectors and contours show velocity direction and magnitude, respectively).

(a) STR = 1.42; (b) STR = 1.60; (c) STR = 2.05; (d) STR = 2.05. Note that velocity vectors are prescribed as constant length rather than proportional to velocity to better illustrate the flow patterns. A view of the sinus and valve leaflets is enhanced in (d) to better illustrate regions of apparent recirculation above the valve leaflets.
The valve resistance to forward flow, Rf, and fully open orifice area, Ap, decrease and increase, respectively for increasing STR. Resistance values decrease by more than half from 1.5 × 10⁶ [g/(cm4 s)] at STR = 1.39 to 0.65 × 10⁶ [g/(cm4 s)] at STR = 3.0, while Ap increases from 4.8 × 10⁻⁵ cm2 at STR = 1.39 to 1.8 × 10⁻⁴ cm2 at STR=3.0. The average valve resistance across geometries for STR ≥ 1.39 was 0.95 × 10⁶ [g/(cm4 s)] (Fig. 7). The apparently consistent relationship between resistance and orifice area led us to assess whether it could be used as a basis for a hydraulic representation of resistance based on Poiseuille flow. Specifically, we sought the degree to which the inverse of the square orifice area, Ap−2, for all of the fully open valve geometries (regardless of STR), would correlate with Rf. This resulted in an overall reasonably good fit with R2 = 0.9862 (p < 0.001) (Fig. 7, inset panel), but at such low Reynolds number one would imagine the fit should be nearly perfect.
Figure 7. Rf and Ap versus STR (STR ≥ 1.39).

Rf and Ap resulted in second-order fits with R2 values of 0.9900 (p < 0.001) and 0.9993 (p < 0.001), respectively. The inset shows Rf versus Ap fitted with a linear function for STR ≥ 1.39 (R2 = 0.9862 (p<0.001), slope = 0.0020 g/s). Resistance values are expected to lie entirely along the fitted line according to a viscous flow assumption, however other geometric factors such as the expansion of the sinus and elliptic-shape of the valve leaflets contribute to orifice area being a poor predictor of resistance. There is also a considerable offset in the intercept with the Rf axis.
The presence of the valve leaflets within the sinus region, as well as the non-uniform cross-section of the sinus itself, introduce non-linear behavior in the centerline pressure drop for all STR values (Fig. 8a). To isolate the effect of the sinus and the valve leaflets on centerline pressure, simulations were also performed using geometries with the sinus, but without the valve leaflets. The resulting pressure distribution, Psinus, was then compared to both the pressure that would have resulted from a straight tube of the same diameter as the upstream lymphangion, PPoiseuille, and pressure distribution (with both the sinus and valve leaflets), Ptotal (Fig 6a–b). For a given STR, Ptotal decreases in a linear fashion but begins a non-linear monotonic decrease just upstream of the center of the trailing edge that continues downstream along the length of the sinus (Fig. 8a). Hence, the presence of the leaflets causes an increase in the pressure gradient just downstream of the trailing edge. For example, the pressure gradient calculated across the trailing edge of the valve leaflet for STR = 1.39 was −756 dyn/cm3 compared to −318 dyn/cm3 for STR = 2.05. However, this increase in pressure drop is compensated for by the expansion of the sinus, which results in some degree of pressure relief just downstream of the commissural incissura. The pressure gradient present just downstream of the trailing edge decreases with increasing STR (Fig. 8b). To further illustrate the effect of the sinus and leaflets on centerline pressure, Ppoiseuille was subtracted from Ptotal for each STR (Fig 8c). Downstream of the trailing edge but before the commissural incissura, Ppoiseuille is greater than Ptotal for 1.39 ≤ STR ≤ 1.60 but less than Ptotal for 1.82 ≤ STR ≤ 2.05. The Poiseuille model results in a higher pressure drop than any case for Ptotal across all values of STR. The axial location where Ptotal − PPoiseuille becomes greater than zero moves downstream with decreasing STR and occurs upstream of the commissural incissura for all cases except STR = 1.39. Specifically, for STR = 1.39, this occurs downstream of the commissural incissura at approximately 0.3 mm but upstream of this location at 0.24 mm for STR = 1.53.
Figure 8. Pressure computations along the centerline of the lymphatic vessel.

(a) Pressure traces for a vessel (STR = 1.39) sampled along the centerline using a geometry with leaflets (dashed line denoted as Ptotal) and one with no leaflets (filled circles denoted as Psinus). The Poiseuille pressure using a characteristic radius of 50 μm (e.g. no sinus or leaflets) is also shown (solid line denoted as PPoiseuille). (b) Ptotal sampled along the central axis of the lymphatic vessel across a range of STR values. (c) Difference between Ptotal and PPoiseuille.
DISCUSSION
Valves and their associated sinuses are defining anatomical and functional characteristics of the lymphatic vascular network. These features start appearing during embryologic development and normally persist throughout the post-capillary lymphatic network. Because of the low or even sub-atmospheric pressures in the lymphatic system, the valves serve to prevent/minimize lymph backflow and are thus critical to lymph transport function. The numbers and relative size and shape of these structures appear to vary between tissues and animals (unpublished observations). The study presented herein computationally investigated the effects of sinus geometry and deformable leaflets on the fluid dynamics of lymphatic valves. By varying STR, we were able to understand its effect on leaflet pressure distributions in the early stages of valve opening, and how these pressures in turn affect the deflection of the valve leaflet. The resulting resistance to flow after deflection was then calculated. The average value of resistance to forward flow (STR ≥ 1.39) was 0.95 × 10⁶ [g/(cm4 s)], which is close to the resistance previously estimated by Bertram et al. of 0.6 × 10⁶ [g/(cm4 s)] (Bertram et al., 2014a) from experimentally derived values, suggesting that the data generated in this model are physiologically sound. This also boosts confidence in the rough, noise-ridden experimental estimate. The resistance calculated here is within the 95% confidence limit of Bertram’s estimation at larger pressurized diameters (Bertram et al., 2014b).
FE simulations also showed high strain concentrations near the annulus of the valve leaflets (Fig. 5). While these strains are most likely due to the fixed boundary condition imposed at the annulus of the valve leaflets, in the physiologic situation, the compliant wall could serve to relieve some of these elevated strains. Interestingly, the valve leaflet insertions are anchored to the vessel wall by axially oriented bands of collagen fibers (Rahbar et al., 2012). We have also observed axially oriented cells at the insertion points that continue beyond the downstream edge of the commissural incissura, which could also support this anchoring principle (unpublished observations). Future investigations will explore vessel wall elasticity, non-homogeneity and anisotropy.
Velocity vectors indicated reversed recirculation in the sinus region behind the leaflets with velocity magnitudes that were much lower than in central lymph flow. This was the case across a range of STR values (Fig. 6), and suggests that nearly stagnant flow is an ever-present feature of lymphatic valve flow patterns. This may alter, but not completely abolish, the transport of immune cells, macromolecules, proteins or even smaller molecules such as NO in the immediate region. However, future studies should investigate this by performing FSI coupled with solute and particle transport models.
The resistance to forward flow monotonically decreases with increasing STR while the orifice area of the deflected leaflets increases (Fig. 7). Our investigation into fitting the relationship between resistance and the inverse square of orifice area with a linear function failed to demonstrate a completely accurate correlation. This should have worked if the orifice area were a reliable indicator of the resistance of the overall valve + sinus geometry. Obviously, that is not the case. We also applied second-order and power-law fits to the data. While both yielded higher R2 values compared to the linear model, the power-law fit seemed to best capture the behavior of Rf versus Ap−2 (R2 of 0.9992). Neither corresponds to any particular theoretical flow relationship, but perhaps these more accurate relationships could be a surrogate for estimating flow resistance from images of orifice area.
The valve leaflets within the sinus region, as well as the non-uniform cross section of the sinus, are the major determinants of the centerline pressure drop across all STR values (Fig. 8b). The presence of the leaflets creates additional pressure drop, but this is more than compensated for by the low resistance of the sinus geometry. Physiologically, the leaflets serve to prevent backflow and are necessary to proper lymphatic pumping, however their presence also increases the resistance to forward flow. The results in this work suggest that the sinus, in addition to facilitating valve opening, serves to balance the resistance caused by the leaflets. Compared to higher-valued STR geometries, simulations run with STR values less than 1.39 resulted in much higher Rf values due to an inherently higher stiffness of the valve structures in these confined spaces, which limited their ability to open fully. For example, Rf was nearly 8X larger at 9.3 × 10⁶ [g/(cm4 s)] (STR = 1.2) compared to 1.2 × 10⁶ [g/(cm4 s)] (STR =1.6). Because of the possibility that this restricted opening behavior is not truly representative of the in vivo condition, the Rf values reported in this paper are for STR ≥ 1.39. Sinuses with smaller diameters (and hence lower STR) have been observed (Fig. 2), but for the most part, the majority of sinuses (62 of 74 investigated in this study) in rat mesenteric lymphatic vessels have an STR greater than 1.4. This suggests most lymphatic valves in the rat mesentery seem to naturally develop to this size, presumably due to the fact that this larger range of STR is optimal to minimize the forward resistance to flow to propel lymph. However, sinus dimensions (including STR and LTR) should be quantified among different tissues and species.
Limitations of this model include the constitutive model used in the FE analysis, which was a neo-Hookean whose shear and bulk moduli were based on data of arterial elastin (Mithieux and Weiss, 2005; Nivison-Smith and Weiss, 1997; Zou and Zhang, 2009). Further studies should investigate non-homogeneity and variations in lymphatic leaflet material properties. Additionally, the compliance of the sinus wall was not considered and could likely serve to relieve high strain concentrations observed at the annulus, as well as influence the overall deflection of the leaflets. While the uncoupled methods used in this study were able to facilitate the estimation of the parameters of interest, future studies should incorporate a fully-coupled FSI model to understand the time-dependent interaction of fluid and solid forces on the resulting valve behaviors.
Supplementary Material
Acknowledgments
We would like to acknowledge the NIH for, in part, funding this study (Grant R01 HL094269, R01 HL096552 and U01 HL123420 JEM and DCZ) and the Royal Academy of Engineering and Royal Society for funding JEM.
Footnotes
CONFLICT OF INTEREST STATEMENT
There are no conflicts of interest to state.
Publisher's Disclaimer: This is a PDF file of an unedited manuscript that has been accepted for publication. As a service to our customers we are providing this early version of the manuscript. The manuscript will undergo copyediting, typesetting, and review of the resulting proof before it is published in its final citable form. Please note that during the production process errors may be discovered which could affect the content, and all legal disclaimers that apply to the journal pertain.
References
- Avraham T, Zampell JC, Yan A, Elhadad S, Weitman ES, Rockson SG, Bromberg J, Mehrara BJ. Th2 differentiation is necessary for soft tissue fibrosis and lymphatic dysfunction resulting from lymphedema. The FASEB Journal. 2013;27:1114–1126. doi: 10.1096/fj.12-222695. [DOI] [PMC free article] [PubMed] [Google Scholar]
- Bertram C, Macaskill C, Davis M, Moore J., Jr Development of a model of a multi-lymphangion lymphatic vessel incorporating realistic and measured parameter values. Biomechanics and modeling in mechanobiology. 2014a;13:401–416. doi: 10.1007/s10237-013-0505-0. [DOI] [PMC free article] [PubMed] [Google Scholar]
- Bertram C, Macaskill C, Moore J., Jr Incorporating measured valve properties into a numerical model of a lymphatic vessel. Computer methods in biomechanics and biomedical engineering. 2014b;17:1519–1534. doi: 10.1080/10255842.2012.753066. [DOI] [PMC free article] [PubMed] [Google Scholar]
- Bohlen HG, Gasheva OY, Zawieja DC. Nitric oxide formation by lymphatic bulb and valves is a major regulatory component of lymphatic pumping. American Journal of Physiology-Heart and Circulatory Physiology. 2011;301:H1897–H1906. doi: 10.1152/ajpheart.00260.2011. [DOI] [PMC free article] [PubMed] [Google Scholar]
- Bohlen HG, Wang W, Gashev A, Gasheva O, Zawieja D. Phasic contractions of rat mesenteric lymphatics increase basal and phasic nitric oxide generation in vivo. American Journal of Physiology-Heart and Circulatory Physiology. 2009;297:H1319–H1328. doi: 10.1152/ajpheart.00039.2009. [DOI] [PMC free article] [PubMed] [Google Scholar]
- Case T, Leis B, Witte M, Way D, Bernas M, Borgs P, Crandall C, Crandall R, Nagle R, Jamal S. Vascular abnormalities in experimental and human lymphatic filariasis. Lymphology. 1991;24:174–183. [PubMed] [Google Scholar]
- Davis MJ, Rahbar E, Gashev AA, Zawieja DC, Moore JE. Determinants of valve gating in collecting lymphatic vessels from rat mesentery. American Journal of Physiology-Heart and Circulatory Physiology. 2011;301:H48–H60. doi: 10.1152/ajpheart.00133.2011. [DOI] [PMC free article] [PubMed] [Google Scholar]
- Dixon JB, Greiner ST, Gashev AA, Cote GL, MOORE JE, Zawieja DC. Lymph flow, shear stress, and lymphocyte velocity in rat mesenteric prenodal lymphatics. Microcirculation. 2006;13:597–610. doi: 10.1080/10739680600893909. [DOI] [PubMed] [Google Scholar]
- Gundiah N, Ratcliffe MB, Pruitt LA. Determination of strain energy function for arterial elastin: experiments using histology and mechanical tests. Journal of biomechanics. 2007;40:586–594. doi: 10.1016/j.jbiomech.2006.02.004. [DOI] [PubMed] [Google Scholar]
- Gundiah N, Ratcliffe MB, Pruitt LA. The biomechanics of arterial elastin. Journal of the Mechanical Behavior of Biomedical Materials. 2009;2:288–296. doi: 10.1016/j.jmbbm.2008.10.007. [DOI] [PubMed] [Google Scholar]
- Jamalian S, Bertram CD, Richardson WJ, Moore JE. Parameter sensitivity analysis of a lumped-parameter model of a chain of lymphangions in series. American Journal of Physiology-Heart and Circulatory Physiology. 2013;305:H1709–H1717. doi: 10.1152/ajpheart.00403.2013. [DOI] [PMC free article] [PubMed] [Google Scholar]
- Mellor RH, Brice G, Stanton AW, French J, Smith A, Jeffery S, Levick JR, Burnand KG, Mortimer PS. Mutations in FOXC2 are strongly associated with primary valve failure in veins of the lower limb. Circulation. 2007;115:1912–1920. doi: 10.1161/CIRCULATIONAHA.106.675348. [DOI] [PubMed] [Google Scholar]
- Mislin H, Schipp R. Year Structural and functional relations of the lymph vessels. International Symposium of Lymphology; Zurich, Switzerland. [Google Scholar]
- Mithieux SM, Weiss AS. Elastin. Advances in protein chemistry. 2005;70:437–461. doi: 10.1016/S0065-3233(05)70013-9. [DOI] [PubMed] [Google Scholar]
- Nivison-Smith L, Weiss A. Elastin based constructs, Regen. Med. Tissue Eng. Biomater. InTech. 1997:323–340. [Google Scholar]
- Petrova TV, Karpanen T, Norrmén C, Mellor R, Tamakoshi T, Finegold D, Ferrell R, Kerjaschki D, Mortimer P, Ylä-Herttuala S. Defective valves and abnormal mural cell recruitment underlie lymphatic vascular failure in lymphedema distichiasis. Nature medicine. 2004;10:974–981. doi: 10.1038/nm1094. [DOI] [PubMed] [Google Scholar]
- Pfarr K, Debrah A, Specht S, Hoerauf A. Filariasis and lymphoedema. Parasite immunology. 2009;31:664–672. doi: 10.1111/j.1365-3024.2009.01133.x. [DOI] [PMC free article] [PubMed] [Google Scholar]
- Prakash S, Ethier CR. Requirements for mesh resolution in 3D computational hemodynamics. Journal of biomechanical engineering. 2001;123:134–144. doi: 10.1115/1.1351807. [DOI] [PubMed] [Google Scholar]
- Rahbar E, Weimer J, Gibbs H, Yeh AT, Bertram CD, Davis MJ, Hill MA, Zawieja DC, Moore JE., Jr Passive pressure–diameter relationship and structural composition of rat mesenteric lymphangions. Lymphatic research and biology. 2012;10:152–163. doi: 10.1089/lrb.2011.0015. [DOI] [PMC free article] [PubMed] [Google Scholar]
- Watton PN, Ventikos Y, Holzapfel GA. Modelling the mechanical response of elastin for arterial tissue. Journal of biomechanics. 2009;42:1320–1325. doi: 10.1016/j.jbiomech.2009.03.012. [DOI] [PubMed] [Google Scholar]
- Wilson JT, Wang W, Hellerstedt AH, Zawieja DC, Moore JE. Confocal Image-Based Computational Modeling of Nitric Oxide Transport in a Rat Mesenteric Lymphatic Vessel. Journal of biomechanical engineering. 2013;135:051005. doi: 10.1115/1.4023986. [DOI] [PMC free article] [PubMed] [Google Scholar]
- Zou Y, Zhang Y. An experimental and theoretical study on the anisotropy of elastin network. Annals of biomedical engineering. 2009;37:1572–1583. doi: 10.1007/s10439-009-9724-z. [DOI] [PubMed] [Google Scholar]
Associated Data
This section collects any data citations, data availability statements, or supplementary materials included in this article.