Abstract
Van Allen radiation belts consist of relativistic electrons trapped by Earth's magnetic field. Trapped electrons often drift azimuthally around Earth and display a butterfly pitch angle distribution of a minimum at 90° further out than geostationary orbit. This is usually attributed to drift shell splitting resulting from day–night asymmetry in Earth's magnetic field. However, direct observation of a butterfly distribution well inside of geostationary orbit and the origin of this phenomenon have not been provided so far. Here we report high-resolution observation that a unusual butterfly pitch angle distribution of relativistic electrons occurred within 5 Earth radii during the 28 June 2013 geomagnetic storm. Simulation results show that combined acceleration by chorus and magnetosonic waves can successfully explain the electron flux evolution both in the energy and butterfly pitch angle distribution. The current provides a great support for the mechanism of wave-driven butterfly distribution of relativistic electrons.
 Relativistic electrons trapped in the Van Allen radiation belts sometimes exhibit a minimum of their pitch angle distribution at 90°. Here, the authors explain the origin of this phenomenon in terms of chorus and magnetosonic waves through simulations and observations of a geomagnetic storm data.
The Earth's outer Van Allen radiation belt is composed of trapped electrons with relativistic energy (Ek≥1 MeV). Fluxes and pitch angle distributions of relativistic electrons often exhibit dramatic and highly dynamic changes during geomagnetic storms or substorms, which are associated with different physical mechanisms. Those mechanisms include transport, energization and loss processes. Wave–particle interaction plays an important role in energy exchange between various modes of plasma waves and Van Allen radiation belt relativistic electrons. Two types of plasma waves, chorus and magnetosonic (MS) wave (also known as ‘equatorial noise'), can efficiently accelerate electrons up to relativistic energies. Relativistic electrons can pose serious damage to satellites and astronauts in space, it is therefore important to understand and ultimately predict Van Allen radiation belt electron dynamic variations.
Radiation belt trapped electrons experience azimuthal drift-motion around Earth when they bounce between northern and southern magnetic mirror points. Due to the day–night azimuthal asymmetry in Earth's magnetic field, their drift shells which are traced out by their guiding centres can separate radially for different pitch angles, which is known as drift shell splitting1. Significant drift shell splitting occurs only in the outer radiation belt L>6 (with L being the radial distance in Earth radii RE), where the asymmetry becomes substantial. Previous theoretical1,2 and observational3,4,5 works have long confirmed drift shell splitting.
Drift shell splitting separates the high and low pitch angle particles in nightside injections as they move to the dayside magnetosphere. The higher pitch angle particles drift to larger radial distance beyond the magnetopause on the dayside and may consequently be lost from the distribution6. Therefore, drift shell splitting can be interpreted in terms of butterfly pitch angle distributions, namely, a sharp dropout in the flux of 90° electrons. Another drift shell splitting is in combination with a negative radial flux gradient as equatorially mirroring particles drift around Earth at locations L=6–12 (refs 7, 8). Drift shell splitting will most easily affect trapped particle populations further out than geosynchronous orbit. Occurrence of drift shell splitting inside of geosynchronous orbit would need a very large magnetopause compression during very large geomagnetic storms.
A fundamental problem, both theoretically and observationally, is that there is any butterfly pitch angle distribution of relativistic electrons below L=5 associated with a new mechanism instead of drift shell splitting. Previous studies have analysed the characteristics and evolution of pitch angle distributions of the outer radiation belt electrons9,10. Chorus and MS waves were proposed to produce butterfly distributions by preferentially accelerating off-equator electrons11,12. Adiabatic processes could potentially yield the formation of butterfly distributions at locations L≥6 (refs 13, 14). Direct confirmation of wave-driven butterfly distributions below L=5 requires simultaneous high-resolution data but this is generally unavailable before the launch of NASA's Van Allen Radiation Belt Storm Probes in 2012 (ref. 15). Fortunately, the unique events on the 28 June 2013 geomagnetic storm observed from Van Allen Probes provide an excellent opportunity to identify such mechanisms.
Here we report the formation of a unusual butterfly pitch angle distribution of relativistic electrons around L=4.8, corresponding to the occurrence of strong chorus and MS waves at the same time. Using two-dimensional simulation, we show that flux enhancements of relativistic electrons are most pronounced between the medium pitch angles 30° and 60° due to the dominant acceleration process for combined chorus and MS waves. Meanwhile, the pitch angle distributions close to 90° are increased due to relatively larger acceleration process for chorus alone. The combined acceleration by chorus and MS waves substantially modifies the whole population of relativistic electrons, producing the butterfly distribution. Our detailed modelling, together with the correlated Van Allen Probes data, presents a further understanding on how chorus and MS waves play different roles in Earth's outer radiation belts.
Results
Correlated Van Allen Probe data
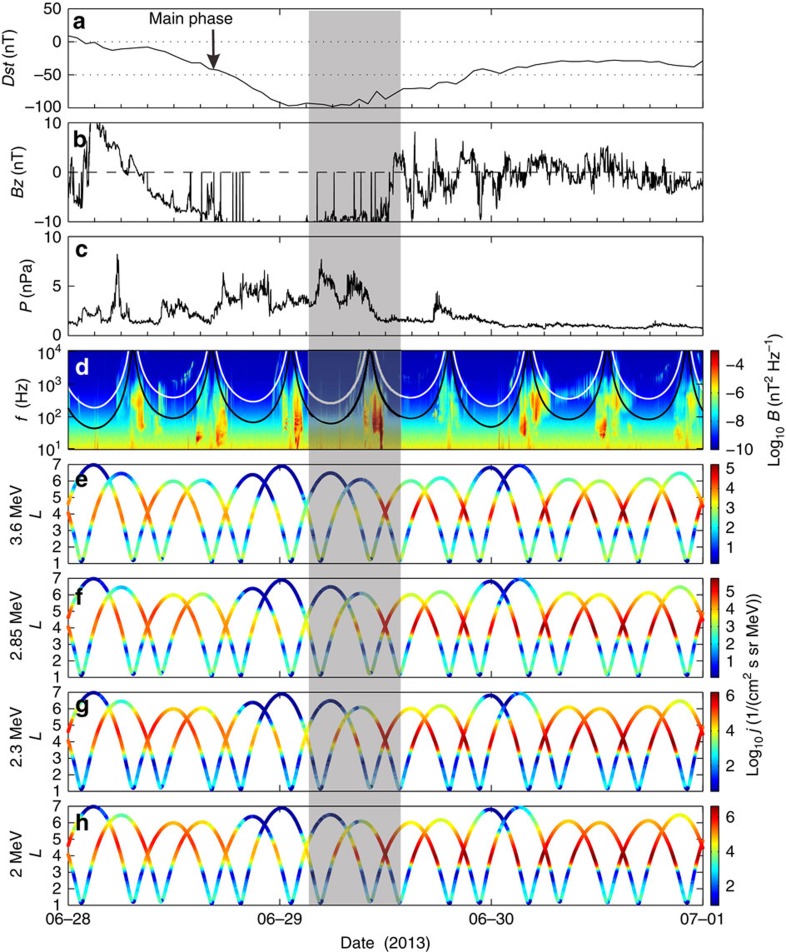
On 28 June 2013, a moderate storm with Dst≈−100 nT (Fig. 1a) was triggered by an interplanetary coronal mass ejection16. This is a relatively minor magnetopause compression, thus drift shell splitting is not expected to occur inside of geosynchronous orbit. A large negative Bz (the z component of the interplanetary magnetic field) occurs during the period 1100 hours on June 28 to 1200 UT on June 29 (Fig. 1b), leading to efficient coupling with Earth's magnetosphere and prolonged geomagnetic activity17. Distinct whistler-mode chorus and MS emissions (Fig. 1d) were observed by the Electric and Magnetic Field Instrument Suite and Integrated Science (EMFISIS) Waves instrument 18,19 onboard Van Allen Probe A. Chorus and MS waves are right hand polarized electromagnetic waves. Chorus waves are excited by the injection of energetic (tens of keV) plasma sheet electrons into the inner magnetosphere during the period of enhanced plasma convection associated with the intervals of negative Bz (refs 20, 21, 22). MS waves are generated by a ring distribution of low-energy (∼10 keV) protons at frequencies close to the harmonics of the proton gyrofrequency23.
Figure 1. Van Allen Probe data during the 28–30 June 2013 storm.
(a) The Dst index. (b) The interplanetary magnetic field Bz. (c) Solar wind dynamic pressure. (d) Magnetic spectral intensity of chorus and MS waves from the EMFISIS instrument on Van Allen Probe A. The black and white lines denote the lower hybrid resonance frequency flhr and 0.1fce (fce being the electron gyrofrequency). (e–h) Relativistic electron differential fluxes from the REPT instrument onboard the Van Allen Probe A as a function of L showing a rapid increase in the radial range 3.5<L<5.5 where strong chorus and MS waves occur. The light grey shading area indicates the simulation period.
The fluxes of relativistic (2–3.6 MeV) electrons (Fig. 1e–h) from the Relativistic Electron-Proton Telescope (REPT) instrument24 onboard Van Allen Probes decreased during the main phase of the storm when the magnetopause was compressed down to L=7.6, and dramatically increased during the recovery phase after 29 June when the solar wind dynamic pressure decreased and the magnetopause moved beyond L=10 (Fig. 1c).
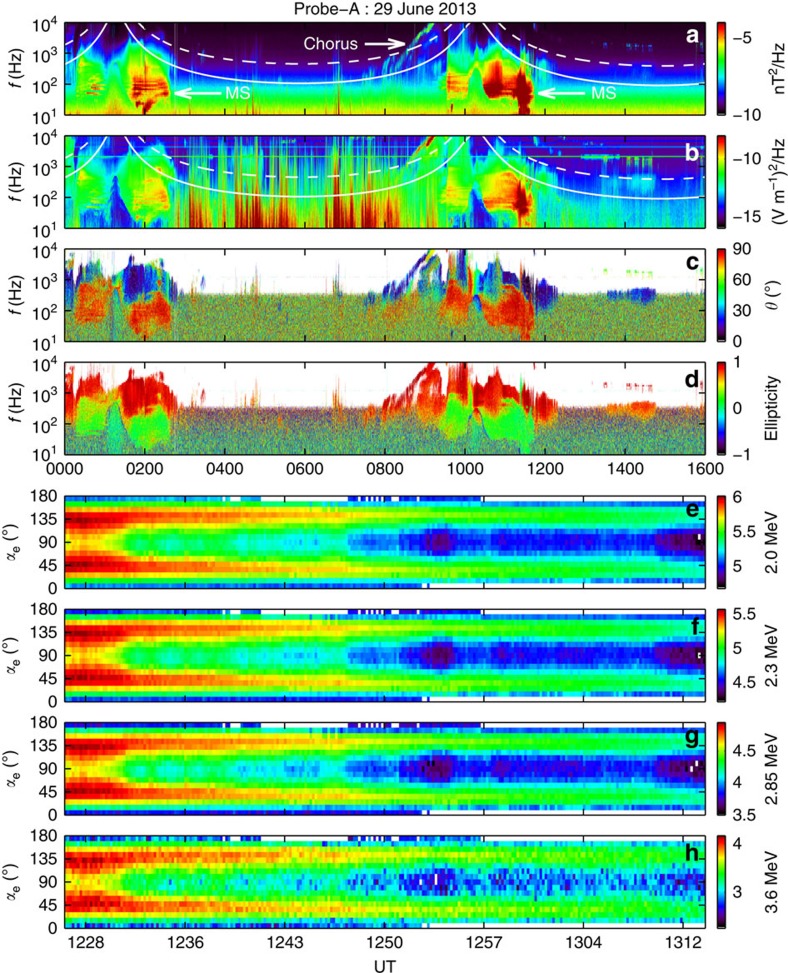
In Fig. 2, we show data during the period 000 to 1600 UT on 29 June 2013 (corresponding to the shaded area in Fig. 1) from the EMFISIS instrument for magnetic and electric spectral intensity of chorus and MS waves (Fig. 2a,b), wave normal angle θ (Fig. 2c) and wave ellipticity (Fig. 2d). The observed chorus wave has a low normal angle (θ≈0°) and circular polarization (ellipticity≈0)25. Meanwhile, the observed MS wave is highly oblique (θ≈90°) and linearly polarized (ellipticity≈0)26. This indicates that the MS or chorus wave k vector is approximately perpendicular or parallel to the ambient magnetic field direction12.
Figure 2. Formation of butterfly distribution of relativistic electrons.
Data from the EMFISIS instrument for magnetic and electric spectral intensity (in unit of log10) of chorus and MS waves (a,b), wave normal angle (c), the angle between Earth's magnetic field and the normal to the plane of the wave, and wave ellipticity (d), the degree of elliptical polarization. Chorus wave occurs above 0.1fce (the white dashed line). MS wave occur as a series of narrow tones, spaced at multiples of the proton gyrofrequency fcp up to flhr (the white solid line). (c,d) The observed MS or chorus wave has a high (θ≈90°) or low (θ≈0°) normal angle and a high (ellipticity≈0) or low (ellipticity≈1) degree of elliptical polarization. (e–h) Pitch angle distribution for different indicated energies (2–3.6 MeV) over ∼40 min duration from the REPT instrument. Fluxes (in the same unit as that in Fig. 1) of relativistic electrons have minima around pitch angle 90°, and peaks around the pitch angle range of 30°–60° or 120°–150°.
A very interesting feature here is that distinct butterfly distributions of fluxes of relativistic (2–3.6 MeV) electrons from the REPT instrument occurred around L=4.8 over the interval 1228-1312 UT (Fig. 2e–h), corresponding to the occurrence of enhanced chorus and MS waves. Electron fluxes have minima around pitch angle 90°, and peaks around the pitch angle range of 30°–60° or 120°–150°. Observations of butterfly distributions at locations L<5 are unlikely due to drift shell splitting as Earth's magnetic field is more dipolar and only distorted/stretched under extreme geomagnetic conditions. As this was a relatively minor compression and only a moderate geomagnetic storm, it is unlikely that drift shell splitting is the cause of these observations. Here we perform a two-dimensional simulation, together with the high-resolution observations from the Van Allen Probes, to examine whether chorus and MS waves can be responsible for evolution of both the energy and butterfly pitch angle distribution of the observed relativistic electron flux increase.
Numerical modelling
To model the temporal evolution of the electron distribution function, we need to solve the Fokker–Planck diffusion equation, which is associated with pitch-angle and momentum diffusion coefficients driven by wave–particle interaction. Then evaluation of diffusion coefficients needs specific information of wave amplitudes and spectral properties. In this event, due to the brief UT intervals of Van Allen Probes, the in situ measurements of chorus or MS waves were confined to a limited range of magnetic local time (MLT) and L-shells: L=4–6 and MLT=22–24 for chorus; L=2–3.5 and MLT=10–18 for MS.
Previous works have demonstrated that MS waves can propagate over a broad region of MLT and L-shells23,27,28. Here using the previously developed programmes29,30, we present ray-tracing results of MS waves based on the wave data. MS waves are launched at L=5.6 for different parameters and MLT regions at the geomagnetic equator (Supplementary Table 1). The modelled results (Supplementary Fig. 1) confirm that MS waves can propagate either into or out of the plasmasphere through the plasmapause, covering a broad region of L=2–5.6, particularly the observed butterfly distribution location L=4.8 and MLT=19.
In this event, Van Allen Probes stayed relatively deep inside the plasmasphere in the day–evening sector. Consequently, those MS waves which potentially occurred in the day–evening sector can not be directly observed by Van Allen Probes in their orbits. Since relativistic electrons drift eastward around Earth approximately in a circular orbit, the observed butterfly distribution should come from the whole contribution of resonances with those MS waves in different MLT regions.
We have also checked the Van Allen Probes data on 28 July 2013 and found that MS waves were indeed observed at L=4.8 and MLT=19. However, Van Allen Probes only passed the observed location in a brief UT interval every day, they may not observe the MS waves each time. In addition, using the Gaussian fitting method (not shown for brevity), we find that those MS waves display a similar Gaussian distribution to those at L=3 and MLT=17.3 on 29 July. It is therefore possibly reasonable to expect that the MS waves potentially existing at L=4.8 and MLT=19 on 29 July to follow the similar Gaussian distribution to that at L=3 and MLT=17.3.
Meanwhile, for calculating the diffusion coefficients of MS waves, we assume that MS waves propagate very highly oblique (θ=86°–89°), distributed in a standard Gaussian form (X=tanθ) with a peak value Xm=tan89°. We noted that a concise modelling method by using maxima wave intensities was adopted in the previous work26.
Moreover, chorus occurs over a broad range of MLT from the nightside through dawn to the dayside31,32, potentially producing efficient scattering precipitation of energetic (tens of keV) electrons into the atmosphere. Considering that the ratio between the precipitated and trapped electron fluxes measured by Polar Orbiting Environmental Satellites (POES) is approximately proportional to the chorus power spectral intensity33, previous studies have developed a novel technique to obtain a dynamic global model of chorus wave amplitudes as a function of L, MLT and time by converting the measured POES flux ratios at different MLT34,35. Here we use the same approach (described in Methods), together with the previous parametric study36, to obtain the global distribution of chorus wave amplitude as a function of L, MLT in this event. Specifically, we remove the proton contamination by the same method in the previous work37. The model parameters listed in Table 1 are adopted to calculate diffusion coefficients for chorus waves. However, the current POES model does not incorporate other loss mechanisms and further improvements are needed in the future. Considering that observations of a global distribution of chorus waves are still very limited, this model should move a step forward in constructing an event-dependent global dynamic model of chorus waves.
Table 1. Adopted model parameters for chorusa.
| MLT | fm/fce | δf/fce | λm | Ne (cm−3) | fpe/fce | Bt (pT) |
|---|---|---|---|---|---|---|
| 00–04 | 0.25 | 0.05 | 15° | 12.2 | 3.9 | 63 |
| 04–08 | 0.23 | 0.05 | 25° | 14.0 | 4.3 | 73 |
| 08–12 | 0.21 | 0.04 | 45° | 20.7 | 5.2 | 10(0.75+0.04λ) |
| 12–16 | 0.20 | 0.04 | 40° | 25.6 | 5.7 | 36 |
| 20–24 | 0.35 | 0.05 | 40° | 17.1 | 4.7 | 81 |
MLT, magnetic local time.
No realistic data available either in 08–12 or in 16–20 MLT.
aChorus wave parameters either obtained from direct observations by the Van Allen Probes or inferred from POES data or from the previous parametric result36.
In general, chorus waves which consist of substructures are coherent at the equator but become less coherent off the equator, resonating with relativistic electrons38. The consequences of coherent wave–particle interactions involving relativistic electrons and chorus waves off the equator have been presented in the previous work39. Here the quasi-linear theory to treat wave–particle interaction is adopted and the corresponding conditions will be discussed below. We assume chorus waves to obey the same Gaussian distributions in wave frequency and wave normal angle at and off the equator. Considering that relativistic electrons move along the geomagnetic field line and bounce back between mirror points, we consider wave–particle interaction at each location and calculate bounce-averaged diffusion coefficients.
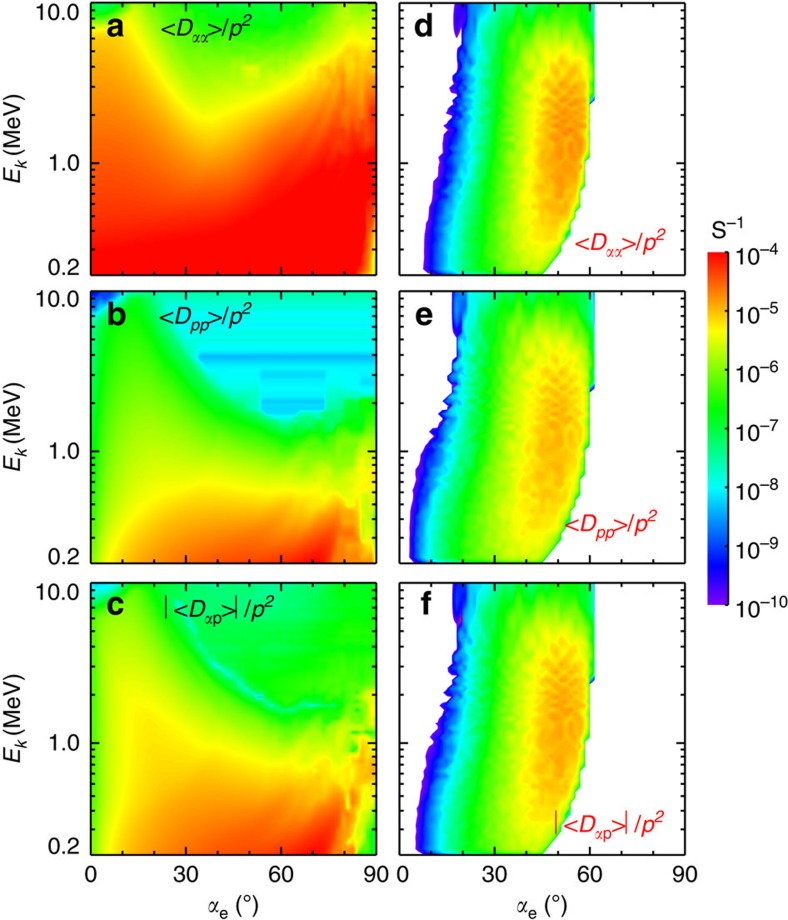
The obtained bounce-averaged diffusion coefficients (Fig. 3) cover an entire region of pitch angles 0°–90° for chorus but a limited region 30°–60° for MS waves. This can allow for significant increases in fluxes of relativistic (2–3.6 MeV) electrons at medium pitch angles 30°–60° by MS waves12 and at high pitch angles up to 90° by chorus waves40, leading to the resultant butterfly distribution on a timescale comparable to 10 h.
Figure 3. Diffusion rates.
Bounce-averaged pitch angle (〈Dαα〉, (a,d)), momentum (〈Dpp〉, (b,e)) and cross (〈Dαp〉, (c,f)) diffusion rates (in unit of s−1) for resonant interactions between chorus (left) or MS (right) wave with electrons. Diffusion rates cover an entire region of pitch angles 0°–90° for chorus but a limited region 30°–60° for MS waves. Combination of chorus and MS waves leads to efficient acceleration of electrons between 2 and 3.6 MeV at medium pitch angles 30°–60° and high pitch angles up to 90°, yielding the resultant butterfly distribution on a timescale comparable to 10 h.
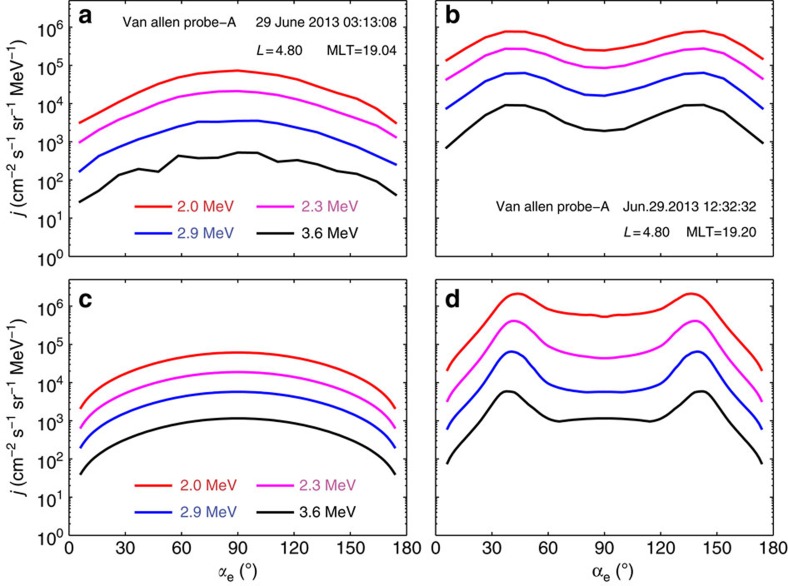
Using aforementioned bounce-averaged diffusion coefficients, we calculate phase space density (PSD) ft evolution of electrons in solving a two-dimensional Fokker–Planck diffusion equation41. The evolution of differential flux j is then simulated in the pitch angle region 0°–90° by the subsequent conversion j=p2ft and the results are extended to the range 90°–180° due to the mirror symmetry. We show in Fig. 4a remarkable agreement between the simulated pitch angle distribution (Fig. 4c,d) and the REPT observation (Fig. 4a,b) during the acceleration interval. The most pronounced flux enhancement occurs over the medium pitch angles 30°–60°, where momentum diffusion rates for combined chorus and MS waves dominate (Fig. 3). Furthermore, the pitch angle distributions at higher pitch angles close to 90° are enhanced due to larger momentum diffusion rates of chorus waves. Finally, the combined acceleration by chorus and MS waves significantly alters the whole population of relativistic electrons, yielding the butterfly distribution in about 9 h.
Figure 4. Comparison of Fokker–Planck simulation results with observations.
(a,b) Observed evolution of the relativistic electron fluxes as a function of pitch angle at the same location (shown inside panels) during the simulation. (c,d) Starting with an initial condition representative of relativistic electrons (a), we show the relativistic (2–3.6 MeV) electron fluxes due to acceleration by chorus and MS waves from a numerical solution to the two-dimensional Fokker–Planck diffusion equation. Acceleration is most pronounced within the medium pitch angle region 30°–60° or 120°–150° produced by both chorus and MS waves, and noticeable around the high pitch angles induced by chorus waves. The combined acceleration by chorus and MS waves leads to the butterfly distribution both in the magnitude and the time scale (d) comparable to the observation (b). The current simulation provides a further support for wave-driven butterfly distribution of relativistic electrons during this storm.
Discussion
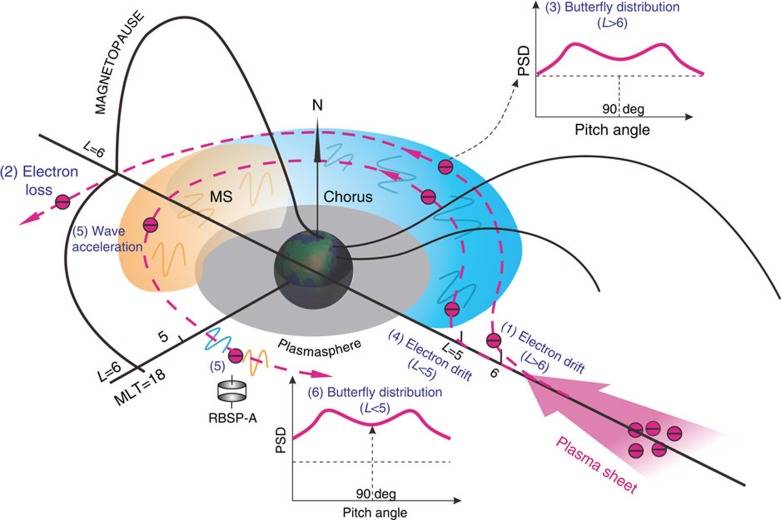
The present modelling provides a further confirmation of wave-driven butterfly pitch angle distribution of relativistic electrons observed by the REPT instrument at lower locations (L<5) of the outer radiation belt. This is in contrast to the formation of butterfly distributions at higher locations (L>6) induced by drift shell splitting due to local magnetic field asymmetry. The associated physical processes are schematically presented in Fig. 5. Relativistic electrons at L<5 drift azimuthally around Earth inside the magnetosphere without loss to the magnetopause, continuously resonating with chorus and MS waves. The combined acceleration by chorus and MS waves occurs preferably between the medium pitch angles 30° and 60°, leading to the unusual butterfly distribution. The combined acceleration process described here is a universal physical process, which should also be effective in the magnetospheres of Jupiter, Saturn and other magnetized plasma environments in the cosmos.
Figure 5. Schematic diagram of formation of butterfly distributions.
The long black curves indicate Earth's magnetic field lines. The grey area denote the region of dense cold plasma known as plasmasphere. The blue and yellow areas stand for primary occurrences of chorus and MS waves. The wavy line represents chorus (blue) and MS (yellow) waves. Relativistic electrons originating from the plasma sheet azimuthally drift eastward around Earth. (1) Higher pitch angle electrons at L>6 drift to larger radial distance beyond the dayside magnetopause and are consequently lost due to the day–night magnetic field asymmetry (2), yielding the regular butterfly distribution (3). (4) Electrons at L<5 drift inside the magnetosphere without loss to the dayside magnetopause because of a very small day–night magnetic field asymmetry, continuously resonating with chorus and MS waves. (5) Wave acceleration can enhance electron PSD primarily within the medium pitch angles, leading to the formation of the unusual butterfly distribution (6).
It should be mentioned that, in a departure from the coherent chorus–electron interaction approach38, we use the quasi-linear theory of wave–particle interaction, which has been frequently adopted by radiation belt research community to treat wave–particle interaction12,40,42. Previous work43 has shown that energetic electron pitch angle scattering by coherent chorus waves is 3 orders more rapid than by incoherent chorus waves. Coherent chorus waves can produce particle diffusion, phase trapping and/or phase bunching, which is determined primarily by the competing effects of wave amplitude and ambient magnetic field inhomogeneity at resonance. However, application of coherent wave–particle interaction to the strom-time global evolution of energetic particle distributions has not yet been established so far. We therefore expect the adopted quasi-linear theory here to be a basis for comparison with future developments in nonlinear modelling.
The basic conditions for the quasi-linear theory are that each individual particle randomly moves in velocity space, resonates with a succession of uncorrelated and small amplitude waves, and is scattered in a small amount in pitch angle and energy each time. Those conditions are basically satisfied in Earth's radiation belts for naturally generated MS and chorus waves, where the MS wave bandwidth is generally above the proton gyrofrequency up to the lower hybrid frequency and the chorus wave roughly lies in the frequency range 0.1–0.8 fce (fce being the electron gyrofrequency).
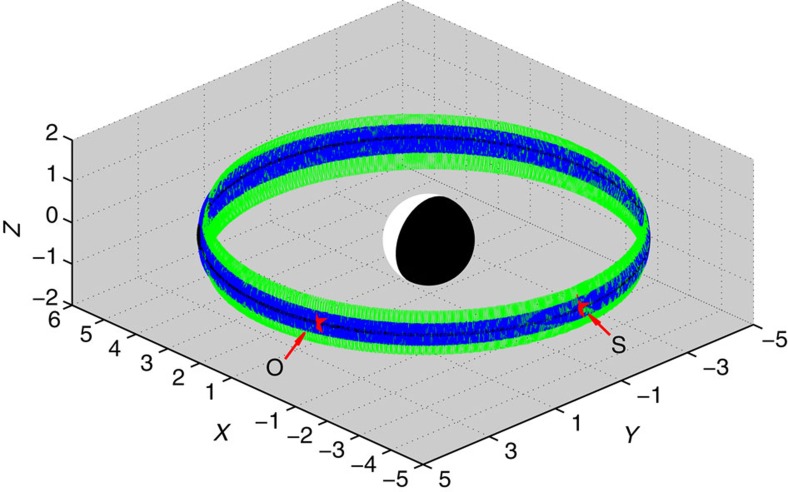
In general, there could be a distorted/stretched geomagnetic field on the nightside during a geomagnetic storm. We have examined the geomagnetic field data from Van Allen Probes and found that the observed data are close to the dipole field model during this storm period. The largest distortion of the dipole field is about 20% in the simulation period. Moreover, we perform a test-particle simulation of trajectories of trapped relativistic (2 MeV) electrons by the TS04 magnetic model44 for different high pitch angles. Simulation results (Fig. 6) show that, starting at the location L=4.8 and MLT=24, relativistic electrons drift eastward around Earth and approach a farthest location L≈5.1 on the dayside. Then they pass the observed location without loss to the magnetopause because the magnetopause locates above L=7.6 in the simulation period. Simulations for different energies or pitch angles (not shown for brevity) indeed show similar results. This indicates that drift shell splitting is unlikely to play a role in the observed butterfly electron distribution in this event.
Figure 6. Trajectories of trapped electrons.
Test-particle simulations of relativistic (2 MeV) electron trajectories by the TS04 magnetic model for different pitch angles 70° (green), 80° (blue) and 90° (black). The input parameters for TS04 magnetic model are based on the observations. Starting at the location (the symbols S): L=4.8 and MLT=24, relativistic electrons drift eastward around Earth and approach a farthest location L≈5.1 on the dayside. Then they pass the observed location (the symbol O) without loss to the magnetopause because the magnetopause locates above L=7.6 in the simulation period.
A basic assumption is adopted here that the cold plasma density remains constant and unchanging during the 9-h simulation period. Using the upper hybrid resonance frequency observation from Van Allen Probes, we infer the ambient electron density at locations along Van Allen Probes' orbits and find that the electron density is comparable to the adopted plasma density and does not change much in 9 h. Analogous to the previous work40, this assumption is probably reasonable in the absence of simultaneous and continuous local time observations of cold plasma density in the 9-h period.
To check whether the plasmaspheric plume exists, we analyse the potential data from the Time History of Events and Macroscale Interactions During Substorms (THEMIS) spacecraft at L=4.8, and find no distinct presence of plasmaspheric plume except a slightly higher electron density in the region around/after MLT=16 in the simulation period. The plasmaspheric plume resulting from time-varying convection generally forms with a more structured distribution of plasma in the dusk region in the storm main phase. Meanwhile, the plume moves eastward (towards later MLTs) in Earth's rotation eastward, and gradually fades/erodes as the strength of convection decreases. As shown in Fig. 1, the simulation period is in the storm recovery phase on 29 June, >24 h after the onset of the storm on 28 June. Hence, the plume probably already faded and moved to the later MLT region. However, further research is still required in the future because there are numerous uncertainties in accurate determination of either the upper hybrid resonance frequency from Van Allen Probes or the THEMIS spacecraft potential.
Methods
Ray tracing of MS waves
We perform the ray tracing of MS waves with wave vector k and frequency ω by the following standard Hamiltonian equations45:
 |
 |
where R is the position vector of a point on the ray path, t is the group time, D represents the standard wave dispersion relation obeying D(R, ω, k)=0 at every point along the ray path. The spatial variation in D can be written:
 |
where B0 is the ambient magnetic field and Nc is the background plasma density. We adopt a dipole magnetic field model and the MLT-dependent plasmatrough density model46. The Earth-centred Cartesian and local Cartesian coordinate systems for the ray-tracing calculation are described in Supplementary Note 1.
Calculation of the global chorus wave amplitude
Recent works34,35 have constructed a global chorus wave model based on the data of low-altitude electron population collected by multiple POES satellites. The Medium Energy Proton and Electron Detector (MEPED) onboard POES has two electron solid-state detector (0° and 90°) telescopes to measure electron fluxes in three energy channels (> 30 keV,> 100 keV and>300 keV)47. The 90° telescope largely measures the trapped flux over the invariant latitude range between 55° and 70°, and the 0° telescope measures precipitating flux inside the bounce loss cone at L>1.4 (ref. 48). Using the electron distribution function near the loss cone33, the chorus wave amplitude can be calculated from the ratio between the measured precipitated and trapped electron fluxes (30–100 keV and 100–300 keV). The electron energy spectrum is assumed to follow a kappa-type function49,50. The basic equation for linking the ratio of electron count rates measured by the 0° and 90° telescopes to chorus wave amplitude is shown in Supplementary Note 2. The ratios of precipitated and trapped electron fluxes measured by multiple POES satellites are used to construct the global chorus wave model over a broad range in L and MLT, and the ratios obtained in four distinct MLT sectors are shown in Supplementary Fig. 2.
Calculation of diffusion coefficients due to chorus and MS waves
We assume that the wave spectral density Bf2 follows a typical Gaussian frequency distribution with a center fm, a half-width δf, a band between f1 and f2 (ref. 51).
 |
here  is the wave amplitude in units of Tesla and erf is the error function. To allow the data modelling to be more reliable, we average the observed wave magnetic field intensity over the indicated time period in this event and then apply the corresponding Gaussian fit for MS waves as shown in Supplementary Fig. 3.
We choose the wave normal angle distribution to also satisfy a standard Gaussian form:
 |
where X=tanθ (θ1≤θ≤θ2, X1,2=tanθ1,2), with a half-width Xω and a peak Xm. Based on the observation, we choose Xm=tan 89°, Xω=tan 86°, X1=Xm−Xω, X2=Xm+Xω; and the maximum latitude for the presence of MS wave λm=10°. Based on the ray-tracing results (Supplementary Fig. 1), we assume the MS wave spectral intensity at L=4.8 and MLT=19 hours to follow the similar Gaussian distribution to that as shown in Supplementary Fig. 3, which are then used to calculate the MS-driven bounce-averaged diffusion coefficients. For the chorus waves, we adopt the wave parameters as shown in Table 1 to calculate the chorus-driven bounce-averaged diffusion coefficients at the location L=4.8.
We consider contribution from harmonic resonances up to n=±5 for both chorus and MS waves. The ambient plasma density is obtained by the MLT-dependent plasmatrough density model46 and further assumed to remain latitudinally constant and unchanged during the 9-h simulation period. Note that there is no realistic data available either in 08–12 or in 16–20 MLT. We assume the chorus wave power in 08–12 MLT to follow the latitude-dependent model36. The corresponding adopted wave amplitude, wave spectrum and latitudinal occurrence of chorus waves, the ambient electron density and the equatorial ratio of plasma frequency to gyrofrequency (fpe/fce) are shown in Table 1.
Evaluation of the relativistic electron PSD evolution
The evolution of the electron PSD ft is calculated by solving the bounce-averaged pitch angle and momentum diffusion equation
 |
here p is the electron momentum, G=p2T(αe)sinαecosαe with αe being the equatorial pitch angle, the normalized bounce time T(αe)≈1.30−0.56sinαe; 〈Dαα〉, 〈Dpp〉, and 〈Dαp〉=〈Dpα〉 denote bounce-averaged diffusion coefficients in pitch angle, momentum and cross pitch angle–momentum. The explicit expressions of those bounce-averaged diffusion coefficients can be found in the previous work.41
The initial condition is modelled by a bi-modal kappa-type distribution function of energetic electrons49,50:
 |
Each component, with variable weighting parameters a1 and a2, is expressed as:
 |
here nh is the number density of energetic electrons, l indicates the loss-cone index, Γ is the gamma function, κ and  are the spectral index and effective thermal energy scaled by the electron rest mass energy mec2 (∼0.5 MeV).
For the pitch angle boundary condition, ft=0 at the loss-cone αe=αL(sinαL=L−3/2(4−3/L)−1/4) to simulate a rapid precipitation of electrons inside the loss cone (Fig. 2e–h), and ∂ft/∂αe=0 at αe=90°. For the energy diffusion boundary conditions,  at the lower boundary 0.2 MeV, and
  at the upper boundary 10 MeV.
Based on the observation, we choose the following values of parameters:  (∼75 keV), κ=4, nh=0.16 cm−3; a1=0.6, l1=0.6; a2=0.4, l2=1.5. We solve the diffusion equation(6) using the recently developed hybrid difference method41, which is efficient, stable and easily parallel programmed. The numerical grid is set to be 91 × 101 and uniform in pitch angle and natural logarithm of momentum. The drifting average is taken 25% for MS wave and 1/6 for chorus wave in each aforementioned MLT sector (Table 1).
Additional information
How to cite this article: Xiao, F. et al. Wave-driven butterfly distribution of Van Allen belt relativistic electrons. Nat. Commun. 6:8590 doi: 10.1038/ncomms9590 (2015).
Supplementary Material
Supplementary Figures 1-3, Supplementary Table 1, Supplementary Notes 1-2 and Supplementary References
Acknowledgments
This work was supported by 973 Program 2012CB825603, the National Natural Science Foundation of China grants 41531072, 41274165, 41204114, the Aid Program for Science and Technology Innovative Research Team in Higher Educational Institutions of Hunan Province and the Construct Program of the Key Discipline in Hunan Province. All the Van Allen Probes data are publicly available at https://emfisis.physics.uiowa.edu/data/index by the EMFISIS suite and at http://www.rbsp-ect.lanl.gov/data_pub/ by the REPT and MagEIS instrument. The OMNI data are obtained from http://omniweb.gsfc.nasa.gov/form/dx1.html. Work at Los Alamos was performed under the auspices of the US Department of Energy and supported by the Los Alamos LDRD program. We would like to thank G.D. Reeves for making available the data used in this work.
Footnotes
Author contributions F.X. led the idea, modelling and was responsible for writing the paper. C.Y. and Z.S. contributed to data analysis, interpretation and the Fokker–Planck simulations. Q.Z. contributed to ray-tracing modelling. Z.H. and Y.H. contributed to data analysis. D.N.B., H.E.S., H.O.F. and J.B.B. provided the RBSP-ECT data.
References
- Roederer J. G. On the adiabatic motion of energetic particles in a model magnetosphere. J. Geophys. Res. 72, 981–992 (1967). [Google Scholar]
- Stone E. C. The physical significance of and application of L, B0 and R0 to geomagnetically trapped particles. J. Geophys. Res. 68, 4157–4166 (1963). [Google Scholar]
- West H. I., Buck R. M. Jr & Walton J. R. Electron pitch angle distributions throughout the magnetosphere as observed on Ogo 5. J. Geophys. Res. 78, 1064–1081 (1973). [Google Scholar]
- Baker D. N., Higbie P. R., Hones E. W. Jr & Belian R. D. High-resolution energetic particle measurements at 6.6 RE. Low-energy electron anisotropies and short-term substorm predictions. J. Geophys. Res. 83, 4863–4868 (1978). [Google Scholar]
- Takahashi K. et al. Drift-shell splitting of energetic ions injected at pseudo-substorm onsets. J. Geophys. Res. 102, 22117–22130 (1997). [Google Scholar]
- Selesnick R. S. & Blake J. B. Relativistic electron drift shell splitting. J. Geophys. Res. 1079, 1265 (2002). [Google Scholar]
- Garcia H. A. & Spjeldvik W. N. Anisotropy characteristics of geomagnetically trapped ions. J. Geophys. Res. 90, 347–358 (1985). [Google Scholar]
- Sibeck D. G., McEntire R. W., Lui A. T. Y., Lopez R. E. & Krimigis S. M. Magnetic field drift shell splitting: Cause of unusual dayside particle pitch angle distributions during storms and substorms. J. Geophys. Res. 92, 13345–13497 (1987). [Google Scholar]
- Horne R. B. et al. Evolution of energetic electron pitch angle distributions during storm time electron acceleration to megaelectronvolt energies. J. Geophys. Res. 108, SMP 11-1–SMP 11-13 (2003). [Google Scholar]
- Gannon J. L., Li X. & Heynderickx D. Pitch angle distribution analysis of radiation belt electrons based on combined release and radiation effects satellite medium electrons A data. J. Geophys. Res. 112, A05212 (2007). [Google Scholar]
- Horne R. B. et al. Timescale for radiation belt electron acceleration by whistler mode chorus waves. J. Geophys. Res. 110, A03225 (2005). [DOI] [PMC free article] [PubMed] [Google Scholar]
- Horne R. B. et al. Electron acceleration in the Van Allen radiation belts by fast magnetosonic waves. Geophys. Res. Lett. 34, L17107 (2007). [Google Scholar]
- Su Z., Xiao F., Zheng H. & Wang S. Combined radial diffusion and adiabatic transport of radiation belt electrons with arbitrary pitch angles. J. Geophys. Res. 115, A10249 (2010). [Google Scholar]
- Su Z., Xiao F., Zheng H. & Wang S. Radiation belt electron dynamics driven by adiabatic transport, radial diffusion, and wave–particle interactions. J. Geophys. Res. 116, A04205 (2011). [Google Scholar]
- Mauk B. H. et al. Science objectives and rationale for the radiation belt storm probes mission. Space Sci. Rev. 179, 3–27 (2012). [Google Scholar]
- Gonzalez W. D., Tsurutani B. T. & Gonzalez A. L. C. Interplanetary origin of geomagnetic storms. Space Sci. Rev. 88, 529–562 (1999). [Google Scholar]
- Gonzalez W. D. et al. What is a geomagnetic storm. J. Geophys. Res. 99, 5771–5792 (1994). [Google Scholar]
- Kletzing C. A. et al. The electric and magnetic field instrument suite and integrated science (EMFISIS) on RBSP. Space Sci. Rev. 179, 127–181 (2013). [DOI] [PMC free article] [PubMed] [Google Scholar]
- Wygant J. R. et al. The electric field and waves (EFW) instruments on the radiation belt storm probes mission. Space Sci. Rev. 179, 183–220 (2013). [Google Scholar]
- Papadopoulos K. Waves and Instabilities in Space Plasmas eds Palmadesso P., Papadopoulos K. D. Reidel Co. (1979). [Google Scholar]
- Xiao F., Zhou Q., Zheng H. & Wang S. Whistler instability threshold condition of energetic electrons by kappa distribution in space plasmas. J. Geophys. Res. 111, A08208 (2006). [Google Scholar]
- Summers D., Tong R. & Thorne R. M. Limit on stably trapped particle fluxes in planetary magnetospheres. J. Geophys. Res. 114, A10210 (2009). [Google Scholar]
- Chen L., Thorne R. M., Jordanova V. K., Thomsen M. F. & Horne R. B. Magnetosonic wave instability analysis for proton ring distributions observed by the LANL magnetospheric plasma analyser. J. Geophys. Res 116, A03223 (2011). [Google Scholar]
- Baker D. N. et al. The relativistic electron-proton telescope (REPT) instrument on board the Radiation Belt Storm Probes (RBSP) spacecraft: Characterization of Earth's radiation belt high-energy particle populations. Space Sci. Rev. 179, 337–381 (2012). [Google Scholar]
- Tsurutani B. T., Verkhoglyadova O. P., Lakhina G. S. & Yagitani S. Properties of dayside outer zone chorus during HILDCAA events: loss of energetic electrons. J. Geophys. Res. 114, A03207 (2009). [Google Scholar]
- Tsurutani B. T. et al. Extremely intense ELF magnetosonicwaves: A survey of polar observations. J. Geophys. Res. Space Phys. 119, 964–977 (2014). [Google Scholar]
- Xiao F., Zhou Q., He Z. & Tang L. Three-dimensional ray tracing of fast magnetosonic waves. J. Geophys. Res. 117, A06208 (2012). [Google Scholar]
- Ma Q., Li W., Thorne R. M. & Angelopoulos V. Global distribution of equatorial magnetosonic waves observed by THEMIS. Geophys. Res. Lett. 40, 1895–1901 (2013). [Google Scholar]
- Horne R. B. Path-integrated growth of electrostatic waves: The generation of terrestrial myriametric radiation. J. Geophys. Res. 94, 8895–8909 (1989). [Google Scholar]
- Xiao F., Chen L., Zheng H. & Wang S. A parametric ray tracing study of superluminous auroral kilometric radiation wave modes. J. Geophys. Res. 112, A10214 (2007). [Google Scholar]
- Meredith N. P. et al. Global models of lower band and upper band chorus from multiple satellite observations. J. Geophys. Res. 117, A10225 (2012). [Google Scholar]
- Li W. et al. Global distribution of whistler-mode chorus waves observed on the THEMIS spacecraft. Geophys. Res. Lett. 36, L09104 (2009). [Google Scholar]
- Kennel C. F. & Petschek H. E. Limit on stably trapped particle fluxes. J. Geophys. Res. 71, 1–28 (1966). [Google Scholar]
- Li W. et al. Constructing the global distribution of chorus wave intensity using measurements of electrons by the POES satellites and waves by the Van Allen Probes. Geophys. Res. Lett. 40, 4526–4532 (2013). [Google Scholar]
- Ni B. et al. A novel technique to construct the global distribution of whistler mode chorus wave intensity using low-altitude POES electron data. J. Geophys. Res. Space Phys. 119, 5685–5699 (2014). [Google Scholar]
- Shprits Y. Y., Meredith N. P. & Thorne R. M. Parameterization of radiation belt electron loss timescales due to interactions with chorus waves. Geophys. Res. Lett. 34, L11110 (2007). [Google Scholar]
- Lam M. M. et al. Origin of energetic electron precipitation >30 keV into the atmosphere. J. Geophys. Res. 115, A00F08 (2010). [Google Scholar]
- Tsurutani B. T. et al. Quasi-coherent chorus properties: 1. Implications for wave–particle interactions. J. Geophys. Res. 116, A09210 (2011). [Google Scholar]
- Tsurutani B. T., Lakhina G. S. & Verkhoglyadova O. P. Energetic electron (>10 keV) microburst precipitation, ∼5-15 s X-ray pulsations, chorus, and wave–particle interactions: A review. J. Geophys. Res. Space Phys. 118, 2296–2312 (2013). [Google Scholar]
- Thorne R. M. et al. Rapid local acceleration of relativistic radiation-belt electrons by magnetospheric chorus. Nature 504, 411–414 (2013). [DOI] [PubMed] [Google Scholar]
- Xiao F., Su Z., Zheng H. & Wang S. Modelling of outer radiation belt electrons by multidimensional diffusion process. J. Geophys. Res. 114, A03201 (2009). [Google Scholar]
- Horne R. B. et al. Wave acceleration of electrons in the Van Allen radiation belts. Nature 437, 227–230 (2005). [DOI] [PubMed] [Google Scholar]
- Lakhina G. S., Tsurutani B. T., Verkhoglyadova O. P. & Pickett J. S. Pitch angle transport of electrons due to cyclotron interactions with the coherent chorus subelements. J. Geophys. Res. 115, A00F15 (2010). [Google Scholar]
- Tsyganenko N. A. & Sitnov M. I. Modelling the dynamics of the inner magnetosphere during strong geomagnetic storms. J. Geophys. Res. 110, A03208 (2005). [Google Scholar]
- Suchy K. Real Hamilton equations of geomagnetic optics for media with moderate absorption. Radio Sci. 16, 1179–1182 (1981). [Google Scholar]
- Sheeley B. W., Moldwin M. B., Rassoul H. K. & Anderson R. R. An empirical plasmasphere and trough density model: CRRES observations. J. Geophys. Res. 106, 25631–25641 (2001). [Google Scholar]
- Evans D. S. & Greer M. S. NOAA Technical Memorandum. 93, Space Weather Prediction Center: Boulder, (2004). [Google Scholar]
- Rodger C. J., Clilverd M. A., Green J. C. & Lam M. M. Use of POES SEM-2 observations to examine radiation belt dynamics and energetic electron precipitation into the atmosphere. J. Geophys. Res. 115, A04202 (2010). [Google Scholar]
- Xiao F., Shen C., Wang Y., Zheng H. & Wang S. Energetic electron distributions fitted with a relativistic kappa-type function at geosynchronous orbit. J. Geophys. Res. 113, A05203 (2008). [Google Scholar]
- Vasyliunas V. M. A survey of low-energy electrons in the evening sector of the magnetosphere with ogo 1 and ogo 3. J. Geophys. Res. 73, 2839–2884 (1968). [Google Scholar]
- Lyons L. R., Thorne R. M. & Kennel C. F. Pitch angle diffusion of radiation belt electrons within the plasmasphere. J. Geophys. Res. 77, 3455–3474 (1972). [Google Scholar]
Associated Data
This section collects any data citations, data availability statements, or supplementary materials included in this article.
Supplementary Materials
Supplementary Figures 1-3, Supplementary Table 1, Supplementary Notes 1-2 and Supplementary References


