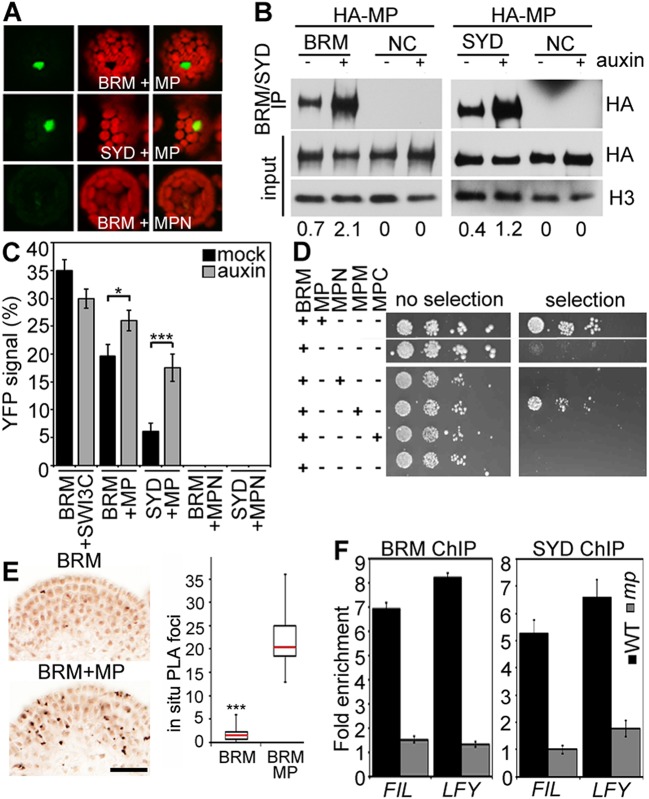
Figure 4. MP physically interacts with and recruits BRM and SYD to target loci.
(A) Bimolecular fluorescence complementation (BiFC) test of MP and BRM or SYD protein interaction in plant cells. Green: BiFC signal in the nucleus, red: chloroplast auto-fluorescence. MPN: N-terminal domain of MP. (B) Co-immunoprecipitation using anti-FLAG antibody in plant cells expressing HA-MP with or without FLAG-BRM or FLAG-SYD. Western blot is probed with anti-HA or anti-histone H3 antibody. Below: Amount of precipitated HA-MP (% of input). See also Figure 4—figure supplement 1. (C) Quantification of BiFC events in the absence or presence of auxin. The error bars are proportional to the standard error of the pooled percentage computed using binomial distribution. n = 3. p-value; Mann–Whitney U test. SWI3C: BRM chromatin remodeling complex component (positive control). (D) Yeast-two-hybrid test of interaction between BRM and MP or MP domains: N: N-terminus, M: middle region, C: C-terminus. See Figure 4—figure supplement 2 for domains of the MP protein. Growth was assayed minus (left) or plus (right) 3-amino-1,2,4-triazole. Thin white line: cropped image from one plate. (E) In situ proximity ligation assay (PLA) with anti-GFP and anti-HA antibodies in pBRM:BRM-GFP or pMP:MP-HA pBRM:BRM-GFP shoot apices. Left: individual sections, right: quantification of interaction foci. n > 12. p-value: Student's t-test. (F) BRM and SYD ChIP enrichment at the FIL and LFY loci relative to the control locus (Ta3 retrotransposon) in wild-type and mp-S319 mutant inflorescences.
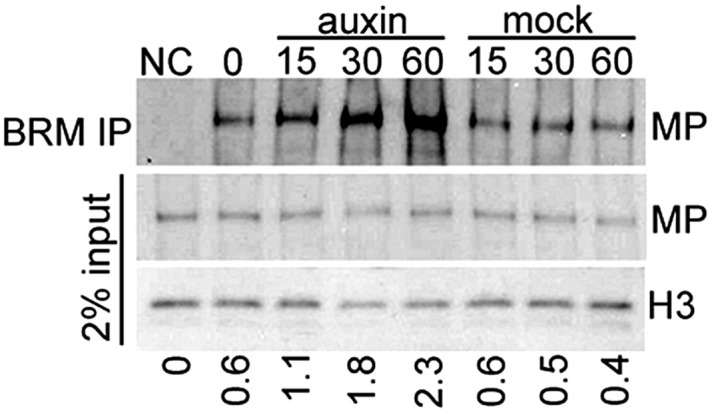
Figure 4—figure supplement 1. Auxin treatment enhanced the physical interaction between BRM and MP.

Figure 4—figure supplement 2. Domains of MONOPTEROS.


