

Abstract
Background
bvFTD patients display an impairment in the attribution of cognitive and affective states to others, reflecting GM atrophy in brain regions associated with social cognition, such as amygdala, superior temporal cortex and posterior insula. Distinctive patterns of abnormal brain functioning at rest have been reported in bvFTD, but their relationship with defective attribution of affective states has not been investigated.
Objective
To investigate the relationship among resting-state brain activity, gray matter (GM) atrophy and the attribution of mental states in the behavioral variant of fronto-temporal degeneration (bvFTD).
Methods
We compared 12 bvFTD patients with 30 age- and education-matched healthy controls on a) performance in a task requiring the attribution of affective vs. cognitive mental states; b) metrics of resting-state activity in known functional networks; and c) the relationship between task-performances and resting-state metrics. In addition, we assessed a connection between abnormal resting-state metrics and GM atrophy.
Results
Compared with controls, bvFTD patients showed a reduction of intra-network coherent activity in several components, as well as decreased strength of activation in networks related to attentional processing. Anomalous resting-state activity involved networks which also displayed a significant reduction of GM density. In patients, compared with controls, higher affective mentalizing performance correlated with stronger functional connectivity between medial prefrontal sectors of the default-mode and attentional/performance monitoring networks, as well as with increased coherent activity in components of the executive, sensorimotor and fronto-limbic networks.
Conclusions
Some of the observed effects may reflect specific compensatory mechanisms for the atrophic changes involving regions in charge of affective mentalizing. The analysis of specific resting-state networks thus highlights an intermediate level of analysis between abnormal brain structure and impaired behavioral performance in bvFTD, reflecting both dysfunction and compensation mechanisms.
Abbreviations: bvFTD, behavioral variant of frontotemporal dementia; FTLD, frontotemporal lobar degeneration; AD, Alzheimer's disease; ToM, theory of mind; BOLD, blood-oxygen-level-dependent; GM, gray matter; SPM, statistical parametric mapping; FDR, false discovery rate; MANCOVAN, multivariate analysis of covariance; VBM, voxel based morphometry; RSNs, resting-state networks; rs-fMRI, resting-state fMRI; aDMN, anterior default mode network; pDMN, posterior default mode network; MMSE, Mini-Mental State Examination; SET, story-based empathy task; EA, emotion attribution; IA, intention attribution; CI, causal inferences; gICA, group independent component analysis; PCA, principal component analysis
Keywords: Behavioral variant of frontotemporal dementia, Affective mentalizing, Resting state functional MRI, Default mode network, Executive functioning network
Highlights
-
•
bvFTD patients are impaired in the attribution of mental states to others (theory of mind, ToM).
-
•
bvFTD patients' ToM deficit involves mainly the attribution of affective states.
-
•
Affective ToM deficits in bvFTD reflect gray matter atrophy in frontolimbic areas.
-
•
Affective ToM deficits in bvFTD reflect altered frontomedial resting-state activity.
-
•
Brain activity at rest reflects both dysfunction and compensation mechanisms in bvFTD.
1. Introduction
The behavioral variant of frontotemporal dementia (bvFTD) is the most common clinical syndrome within the frontotemporal lobar degeneration (FTLD) spectrum, accounting for about half of all FTLD cases (Piguet et al., 2011). Along with Alzheimer's disease (AD), it is the most common cause of early-onset neurodegenerative dementia (Piguet et al., 2011). Neuropathological and imaging studies suggest that specific neural systems are affected by dementias (Zhou and Seeley, 2014). In bvFTD, the neurodegenerative process specifically targets brain regions associated with the processing of social and affective stimuli (Seeley et al., 2008; Irish et al., 2011). Crucial clinical manifestations, indeed, are changes in personality, interpersonal conduct and emotional control, associated, in the early stages of the disease, with a relative preservation of cognitive performance on standard neuropsychological measures (Cerami and Cappa, 2013). In particular, loss of sympathy and/or empathy is a key feature for the differential diagnosis of bvFTD (Rascovsky et al., 2011). Several studies provided behavioral evidence of early impairments of social cognition, involving emotion recognition, empathy, as well as the correct attribution of mental states to other individuals (i.e. mentalizing, or “theory of mind” (ToM); Elamin et al., 2012). The objective assessment of socio-affective abilities may thus provide crucial cues to the diagnosis of this dementia subtype (Torralva et al., 2009; Gleichgerrcht et al., 2010).
At the neural level, the impairment of social cognition in bvFTD reflects a selective vulnerability of limbic and fronto-insular networks (Kim et al., 2012), characterizing the disease since its earliest stage (Seeley et al., 2008) (see Ibañez and Manes (2012) for a recent proposal on the role of these networks in processing social contextual effects). Only a few studies, however, have directly investigated the connection between the multiple facets of social cognition and the underlying neural impairment in bvFTD (Elamin et al., 2012). At the structural brain level, we have recently shown that, in bvFTD patients, a selective deficit in the ability to attribute affective states (as compared to cognitive states such as intentions) reflects gray matter atrophy in key nodes of the “social brain” (Adolphs, 2009; Frith, 2007; Lieberman, 2007)”, such as amygdala, superior temporal cortex and posterior insula (Cerami et al., 2014a). Here we aim to complement this neuro-anatomical evidence by relating the empathic deficit displayed by bvFTD patients to possible abnormal patterns in their resting-state brain activity.
Starting from the observation of synchronous, low-frequency, fluctuations of BOLD activity shown by specific regions at rest (Biswal et al., 1995), the investigation of so-called resting-state networks (RSNs) has provided critical information on intrinsic (i.e. task-free) brain activity, both in health and in pathological conditions (e.g. Biswal et al., 2010). Abnormalities in such an intrinsic functional brain architecture (i.e. connectome; Smith et al., 2013), and their relationship with impaired cognition and behavior, have been also investigated in dementia (Seeley et al., 2009), and particularly in AD. The phenotypical characterization of dementia may greatly benefit from non-invasive measures of intrinsic brain activity at rest, which, complementing research on the neuropathology and genetics of different types of dementia, may provide an additional biomarker of specific neurodegenerative disease, endowed with prognostic potentialities (Greicius and Kimmel, 2012; Pievani et al., 2014). In the last years, several studies have taken advantage of resting-state fMRI (rs-fMRI) to investigate a relationship between intrinsic brain activity and performance in tasks which require extensive patient cooperation (Khanna et al., 2015). This is a powerful method to assess patients with behavioral disorders, which may have difficulty in performing a task within an MR scanner.
Compared with a wide literature on rs-fMRI in AD, bvFTD has been less frequently investigated (Agosta et al., 2013; Filippi et al., 2013; Rytty et al., 2013; Whitwell et al., 2011; Zhou et al., 2010). The available studies highlighted distinctive patterns of abnormal brain functioning at rest, in particular altered activity and reduced connectivity within the attentional “salience” network and the anterior components of the default mode network (aDMN) (Seeley et al., 2007a), including key structures for socio-affective processing such as limbic and fronto-insular regions, alongside increased functional connectivity within the posterior default mode network (pDMN) (Zhou and Seeley, 2014). This pattern, opposite to that typically observed in AD dementia subtype (i.e. disrupted connectivity in the pDMN alongside increased connectivity in the salience network; Zhou et al., 2010), is consistent with the impairments in self-projection, insight and meta-cognition observed in bvFTD patients (Irish et al., 2011; Rankin et al., 2006). To date, however, no study has directly related anomalous resting-state metrics to impaired affective mentalizing in bvFTD patients.
To fill this gap, in the present study we compared resting-state brain activity, as well as its relationship with the ability to attribute affective vs. cognitive mental states to others, between bvFTD patients and age/education-matched healthy controls. Based on our previous data (Cerami et al., 2014a) we predicted that the bvFTD deficit in the attribution of affective vs. cognitive states would be specifically related to anomalous resting-state brain activity, involving in particular fronto-medial and fronto-limbic RSNs. In addition, we also investigated the relationship between functional (resting-state) and morphometric (GM density) levels of analysis, under the hypothesis that anomalous resting-state activity in specific networks, related to specific social cognition deficits, may reflect the presence of gray matter atrophy.
2. Materials and methods
2.1. Subjects
Within a larger sample (Cerami et al., 2014a) of patients fulfilling clinical criteria for probable bvFTD (Rascovsky et al., 2011), 12 patients (9 men, 3 women; mean age = 63.11 years; standard deviation (SD) = 7.17; Clinical Dementia Rating (CDR) scale ≤ 1) were enrolled for this rs-fMRI study. Patients were consecutively recruited from the Neurorehabilitation Unit (Department of Clinical Neurosciences) at San Raffaele Hospital (Milan, Italy), and evaluated by a team of experienced behavioral neurologists and neuropsychologists. Their resting-state brain activity and task-performance (see below) were compared with those obtained in 30 age- and education-matched healthy controls (18 men, 12 women; mean age = 58.84 years; SD = 7.30) (see Table 1).
Table 1.
Demographic and clinical features of the sample.
| Controls (n = 30) | bvFTD (n = 12) | U statistics | p-Value | Effect-size (r) | Cohen's d | |
|---|---|---|---|---|---|---|
| Age in years | 58.84 (7.30) | 63.11 (7.17) | 115 | 0.70 | 0.2566 | 0.5926 |
| Education in years | 13.56 (3.65) | 12.08 (4.29) | 145 | 0.32 | −0.1717 | −0.3858 |
| MMSE | 29.18 (0.95) | 25.33 (3.52) | 44.5 | <0.0001* | −0.6533 | −1.9103 |
| FBI | – | 23.09 (7.02) | – | – | – | – |
| NPI | – | 25.72 (16.71) | – | – | – | – |
| FTLD-CDR sum of boxes | – | 5.72 (3.48) | – | – | – | – |
| IA score | 5.27 (0.98) | 3.67 (2.01) | 82.5 | 0.008* | −0.4735 | −1.1902 |
| CI score | 4.77 (1.17) | 4.08 (1.62) | 135.5 | .20 | −0.2316 | −0.527 |
| EA score | 5.00 (1.29) | 3.00 (1.41) | 56.5 | <0.0001* | −0.5636 | −1.5105 |
For each variable, the mean (and standard-deviation in brackets), Mann–Whitney U statistics and p-value of group comparisons, as well as effects sizes, are reported. The asterisk in the “p-value” column denotes the statistics reported as significant.
bvFTD: behavioral variant of frontotemporal dementia; MMSE: Mini Mental State Examination; FBI: Frontal Behavioral Inventory; NPI: Neuropsychiatric Inventory; FTLD-CDR: FTLD-modified Clinical Dementia Rating scale; IA: intention attribution; CI: causal inference; EA: emotion attribution.
Besides the main experimental task, all subjects underwent a structured clinical interview, a full neurological examination, a standard neuropsychological battery including measures of logical-reasoning, attention and executive functioning (i.e. Digit Span forward and backward, Raven's Progressive Matrices, Attentional Matrices) and a neurobehavioral assessment (i.e. Neuropsychiatric Inventory and Frontal Behavioral Inventory). Instrumental data, including neurophysiological (i.e. EEG) and neuroimaging (i.e. conventional brain MRI and/or brain [18F]FDG-PET), were also collected for each patient to support the clinical diagnosis. The exclusion criteria were a Mini-Mental State Examination (MMSE) raw score below 21/30 and a Clinical Dementia Rating (CDR) scale global score above 1.
Healthy controls were recruited at local senior community centers. Their inclusion criteria were the absence of any neuropsychiatric disorder, a normal neurological examination, a CDR = 0, MMSE raw score ≥28/30, and verbal and visuo-spatial delayed memory performance ≥25th percentile. There were no significant differences between bvFTD and controls in age or educational level (Table 1). A chi-square test confirmed that the distribution of males and females was not significantly different across patients and controls (Chi2(1) = 0.162, p = 0.688).
All subjects, or their informants/caregivers, gave informed consent to the experimental procedure, which was approved by the local Ethical Committee.
2.2. Experimental task
Participants were administered a non-verbal cartoon task (Story-based Empathy Task, SET; Cerami et al., 2014a,b; Dodich et al., 2015) assessing the correct attribution of mental states to other individuals, and namely their intentions vs. affective states (see Fig. 1). The task lasts 15/20 min and includes two main experimental conditions, i.e. identifying affective states (emotion attribution, EA) or intentions (intention attribution, IA). A third “control” condition, devoid of social components, is aimed to assess the ability to infer physical causal relationships based on knowledge about the physical properties of objects or human bodies (causal inferences, CI). Every condition includes six trials, each requiring to identify the correct ending of a comic strip composed of three vignettes presented in the top half of the screen (see Fig. 1). In order to ensure the understanding of instructions, subjects are first asked to describe the story and to formulate a possible story ending. Three possible endings are then shown in the bottom half of the screen, and subjects are asked to select the correct one. A score of 1 is assigned only in case of selection of the correct ending, i.e. maximum score per condition = 6 and maximum global score = 18 (see Dodich et al., 2015) for further details about the task and the experimental procedure).
Fig. 1.
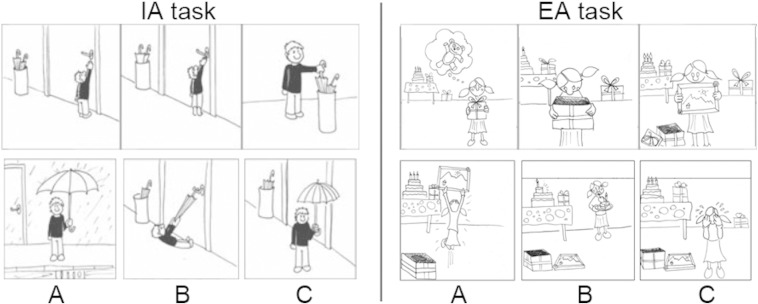
Experimental task. Examples of the stimuli used in the intention attribution (IA, left) and emotion attribution (EA, right) conditions of the story-based empathy task (SET) (Dodich et al., 2015). Subjects are first asked to verbally report the intention (IA) or emotion (EA) of the main character of the story depicted by the sequence of cartoons at the top. Then, they are asked to select the correct ending of the story among the three shown at the bottom (A, B or C).
2.3. Neuroimaging study
2.3.1. MRI data acquisition
Anatomical T1-weighted and functional T2*-weighted MR images were collected with a 3 Tesla Philips Achieva scanner (Philips Medical Systems, Best, NL), using an 8-channel Sense head coil (sense reduction factor = 2). The MR session included a 3D T1-weighted image (TR = 25 ms, TE = 4.6 ms, flip angle = 30°, in-plane resolution = 0.89 mm × 0.89 mm, slice thickness = 1 mm, 220 contiguous axial slices) and a “resting-state” fMRI scan (200 functional volumes including 30 contiguous axial slices, parallel to the AC–PC plane; T2*-weighted echo-planar imaging (EPI) pulse sequence; TR = 3000 ms, TE = 35 ms, slice thickness = 4 mm). The latter lasted 10 min during which participants lied quietly, awake but with their eyes closed, with the head fixed by foam pads to reduce movements.
2.3.2. rs-fMRI data pre-processing
Image pre-processing was performed using SPM8 (http://www.fil.ion.ucl.ac.uk/spm), implemented in Matlab v7.4 (Mathworks, Inc., Sherborn, MA) (Worsley and Friston, 1995). The 200 volumes from each subject underwent a standard spatial pre-processing including slice-timing correction with the middle slice in time as a reference, spatial realignment to the first volume and unwarping, spatial normalization into the standard Montreal Neurological Institute (MNI) space (Friston et al., 1995) and resampling in 2 × 2 × 2 mm3 voxels, as well as spatial smoothing with an 8 mm full-width half-maximum (FWHM) isotropic Gaussian kernel. We used the Motion Fingerprint toolbox (http://www.medizin.uni-tuebingen.de/kinder/en/research/neuroimaging/software/) to compute, for each subject, a comprehensive indicator of scan-to-scan head motion. This procedure highlighted in some participants increasing head movements in the last minute of the scanning session. Therefore, for all participants we removed the last 20 volumes (corresponding to 1 min) and repeated the whole pre-processing on the first 180 volumes, corresponding to 9 min of resting-state brain activity per subject. No significant group difference in scan-to-scan head motion was observed after such selection (t(40) = −1.47, p > 0.05) (see Table 2). We divided the time series of each voxel by its average intensity, in order to convert them to percent signal change units. This procedure of “intensity normalization” has been shown to improve the accuracy and test-retest reliability of the output components of Independent Component Analysis (ICA) (Allen et al. 2010, 2011).
Table 2.
Morphometric features and nuisance predictors related to head motion and quality of spatial normalization.
| Controls | bvFTD | T statistics | p-Value | Effect-size (r) | Cohen's d | |
|---|---|---|---|---|---|---|
| GM (ml) | 426.52 (56.82) | 363.22 (56.89) | 3.259 | 0.002288* | −0.4494 | −1.1137 |
| WM (ml) | 726.10 (86.22) | 718.59 (88.63) | 0.253 | 0.801589 | −0.039 | −0.0864 |
| CSF (ml) | 219.24 (30.48) | 286.21 (57.99) | −4.904 | 0.000016* | 0.6034 | 1.6751 |
| TIV (ml) | 1371.86 (135.34) | 1368.03 (110.07) | 0.087 | 0.931028 | −0.0134 | −0.0297 |
| GM/TIV percentage (%) | 31.06 (2.45) | 26.54 (3.46) | 4.77 | 0.000024* | −0.5941 | −1.6349 |
| Average scan-to-scan head motion (mm) | 0.063 (0.03) | 0.079 (0.03) | −1.47 | 0.147 | 0.2342 | 0.5333 |
| Quality of normalization (smoothed) | 0.963 (0.005) | 0.961 (0.006) | 0.880553 | 0.383820 | −0.1682 | −0.3778 |
| Quality of normalization (unsmoothed) | 0.923 (0.007) | 0.920744 (0.009) | 1.061066 | 0.295025 | −0.1329 | −0.2967 |
For each variable, the mean (and standard-deviation in brackets), T statistics and p-value of group comparisons, as well as effects sizes, are reported. The asterisk in the “p-value” column denotes the statistics reported as significant.
bvFTD: behavioral variant of frontotemporal dementia; ml: milliliters; GM: gray matter; WM: white matter; CSF: cerebrospinal fluid; TIV: total intracranial volume.
For every subject, we assessed the quality and consistency of spatial normalization by computing the Spearman correlation between the SPM EPI template and the mean image of either the unsmoothed normalized or the smoothed normalized functional volumes. Neither for unsmoothed normalized (patients' mean = 0.919, controls' mean = 0.922; t(40) = 1.06, p > 0.05) nor for smoothed normalized (patients' mean = 0.961, controls' mean = 0.962; t(40) = 0.88, p > 0.05) images we observed significant group differences on the resulting correlation index (see Table 2). Moreover, there was no significant interaction between “image type” (smoothed/unsmoothed) and group on the quality of normalization (F(1) = 0.88, p > 0.05).
2.3.3. Group independent component analysis (gICA)
We used multivariate spatial gICA, as implemented in the GIFT toolbox (http://icatb.sourceforge.net; Allen et al., 2011; Calhoun et al., 2001a), to extract temporally coherent and maximally independent spatial sources, i.e. functional networks or “spatial maps”, from resting-state time courses.
The independent component analysis was preceded by a data-reduction stage, based on a principal component analysis (PCA) retaining 100 principal components from single subjects' time courses (Erhardt et al., 2011). Subsequent gICA retained 75 components through a neural network algorithm (Infomax) that attempts to minimize the mutual information of the network outputs to identify naturally grouping and maximally independent sources (Bell and Sejnowski, 1995). ICA was repeated 250 times in Icasso (http://www.cis.hut.fi/jhimberg/icasso). The resulting components were clustered to ensure the consistency and reliability of the decomposition, which are quantified using a quality index Iq ranging from 0 to 1, reflecting the difference between intra-cluster and extra-cluster similarity (Himberg et al., 2004). Subject-specific spatial maps and time courses were estimated with GICA3 back-reconstruction (Calhoun et al., 2001a; Erhardt et al., 2011; Calhoun et al., 2001b).
We applied this procedure both on the whole sample of participants (bvFTD and controls; main analysis), and in the bvFTD group only. Given the small size of the patient sample, the latter is an explorative analysis aimed to assess the predicted involvement of the dorsomedial prefrontal cortex in EA performance (Lamm et al., 2011; Fan et al., 2011). Unless otherwise specified (i.e. Section 3.2.2), indeed, all the subsequent results refer to the main analysis.
2.3.4. RSNs selection and identification
One of the desirable properties of the ICA framework, particularly when studying patients, is that it allows to mitigate the impact of non-neural factors such as those associated with head motion or physiological artifacts (e.g. cardiac and respiratory rhythms). ICA, indeed, segregates these sources of physiological noise in specific components, which are then excluded from subsequent analyses (McKeown et al., 2003; Kochiyama et al., 2005). Besides the Iq index we used the spectral characteristics of component time courses to discriminate reliable RSNs from physiological artifacts. Based on the notion that normal resting-state time courses are dominated by slow (i.e. low frequency) fluctuations (Cordes et al., 2000), following Allen et al. (2011) we focused on the average power spectrum of components to evaluate “dynamic range” (i.e. the difference between peak power and minimum power at frequencies to the right of the peak) and “low frequency to high frequency power ratio” (i.e. fALLF, the ratio of the integral of spectral power below 0.0667 Hz to the integral of power between 0.01 and 0.1667 Hz). In line with the conservative approach pursued by Allen et al. (2011), we excluded the components associated with at least one of the following metrics: Iq < 0.8, dynamic range < 0.25, fALLF < 4. This procedure retained 37 components, whose spatial maps then underwent a visual inspection aiming to reject those encompassing white matter, ventricles or brainstem structures. The latter stage resulted in the exclusion of further 5 components, thus resulting in a final set of 32 genuine RSNs (see the Results section; Fig. 2). Such a robust selection is aimed to rule out any interpretation of results in terms of possible confounds resulting from physiological artifacts. We anatomically labeled the selected RSNs based on the largest spatial correlation between the spatial maps of each component and the RSNs template provided with the GIFT toolbox. This template includes maps of the main brain functional networks (see Allen et al., 2011 for details). Additionally, we used the SPM Anatomy toolbox v2.0 (Eickhoff et al., 2005) to provide a detailed anatomical localization and functional characterization of each network (Supplementary Table 1). We considered three complementary outcome variables for the selected components:
-
1)
the power spectra of RSN time course, i.e. a measure of the contribution of each frequency bin to the spontaneous fluctuations of BOLD signal, reflecting the level of coherent activity within a network (which is maximal for high power spectra at low frequencies). We estimated spectra on the detrended subject-specific time courses, after removal of the mean, slope, and period π and 2π sines and cosines over each time course.
-
2)
the intensity of RSN spatial maps, related to the connectivity and degree of coactivation within a network. Component spatial maps were thresholded based on the distribution of voxelwise t-statistics (i.e. mean + 4SD), in order to identify voxels with strong and consistent activation across subjects and thus focus subsequent analyses on the most representative sectors of each network.
-
3)
functional network connectivity (FNC), i.e. the temporal correlation (Pearson's correlation coefficient) between the despiked and detrended time courses of each pair of networks.
Fig. 2.

Resting-state networks. Spatial maps of the 32 independent components identified as RSNs.
2.3.5. RSNs statistical analysis
Following Allen et al.'s (2011) procedure, in the main analysis we assessed the effects of group (bvFTD and controls), task performance (i.e. emotion attribution-EA, intention attribution-IA and causal inference-CI), as well as the interaction between task performance and group, by using a backward multivariate model selection strategy for each of the aforementioned 3 outcome variables. This procedure first employs a multivariate analysis of covariance (MANCOVAN) to select which factors explain variability in the outcome measures. Then, univariate tests corrected for multiple comparisons are carried out on a reduced design matrix (thus decreasing the number of statistical tests performed), to highlight the direction and strength of the relationship between these factors and RSN outcome variables.
The covariates of interest in the design-matrix were group (bvFTD and controls), task-performance (IA, EA, and CI) and their interaction, as well as two nuisance predictors reflecting the quality of spatial normalization (for smoothed normalized images) and average head motion. Following Allen et al. (2011), we included such nuisance predictors even though preliminary control analyses had shown no significant group difference (Section 2.3.2), nor a significant relationship between any of these variables and the three task scores (EA, IA, CAU; all p > 0.05) (Supplementary Table 2). None of the nuisance predictors was retained in subsequent univariate tests, supporting the effectiveness of high model order ICA in segregating physiological noise in specific components (McKeown et al., 2003; Kochiyama et al., 2005). Predictors were not significantly correlated with each other (variance inflation factor (VIF) < 4).
In subsequent univariate analyses, partial correlation coefficients measured the strength of the linear relationship between each outcome variable and each retained predictor (e.g. power spectra and EA score) after adjusting for the effect of other predictors included in the design-matrix. This procedure thus highlighted which spectral bins, spatial map voxels or FNC correlations were specifically associated with group, task performance or their interaction.
All the reported results survived a statistical threshold of p < 0.05 corrected for multiple comparisons using false discovery rate (FDR; Genovese et al., 2002). In GIFT, the FDR corrects for the univariate tests performed on each column of the response data matrix, i.e. for the number of a) voxels retained in spatial maps (see Section 2.3.4), b) FNC correlations, and c) spectral bins in power spectra. In the latter case, only frequency bins that passed such threshold in contiguous clusters of at least 3 bins were considered significant. For each component, the statistical significance of the reported effects were further assessed via post-hoc tests (unequal N Tukey HSD) following an ANOVA including group and bin as between- and within-subjects factors, respectively.
2.3.6. Voxel-based morphometry (VBM) pre-processing and statistical analysis
VBM spatial pre-processing was performed using SPM8 along with the VBM8 (http://dbm.neuro.uni-jena.de) and Diffeomorphic Anatomical Registration Through Exponentiated Lie algebra (DARTEL; Ashburner, 2007) toolboxes. VBM entailed 4 main steps (Ashburner and Friston, 2000): a) bias correction of intensity non-uniformity; b) spatial normalization of images to the standard MNI space to remove differences in overall size, position, and global shape; c) extraction of GM from the normalized images; and d) smoothing (8 mm FWHM) of the GM images, which then entered statistical analyses.
In order to test the hypothesis of a connection between the functional (rs-fMRI) and structural (morphometric) levels of analysis, we assessed the reduction of GM density in bvFTD compared with controls, as well as the relationship between GM density and task performances in patients, in the RNSs highlighted by gICA (see Section 3.2). To this purpose, we used the SPM-toolbox Marsbar (http://marsbar.sourceforge.net) to convert the gICA maps into binary regions-of-interests (ROIs), and the toolbox REX (http://web.mit.edu/swg/software.htm) to extract, from the resulting masks, average GM density values for subsequent off-line statistical analyses. For each resulting map we used a Mann–Whitney U test to compare GM density in patients vs. controls, and a Spearman correlation to assess, in patients only, a relationship between GM density and task-specific performance.
All the reported results survived a statistical threshold of p < 0.05 corrected for multiple comparisons using false discovery rate (FDR; Genovese et al., 2002).
3. Results
3.1. Behavioral analysis
We used a Mann–Whitney U test to assess group effects on performance in the 3 conditions of the SET task. In line with our previous results (Cerami et al., 2014a), this analysis highlighted a significant reduction of EA and IA, but not CI, scores in patients compared with controls (see Table 1). We performed a logistic regression analysis, including age and gender as covariates, to evaluate which of the three SET sub-condition scores distinguished better patients from controls. To this purpose, we used a bootstrapping approach in which the logistic regression analysis was reiterated 1000 times using random-split resampling. In line with our previous data, the final model highlighted the EA condition as the best predictor of the grouping variable (Exp(β) = 0.235; CI 95% = 0.080–0.688, p < 0.005).
3.2. Neuroimaging results: resting-state networks (RSNs)
70 out of the 75 extracted components had a quality index Iq greater than 0.8 after 250 repetitions of ICASSO, indicating a highly stable ICA decomposition. Based on both visual inspection and the analysis of the spectral profiles, we selected 32 components as RSNs (Fig. 2). We then used the SPM anatomy toolbox v2.0 (Eickhoff et al., 2005) to localize them in the stereotaxic space and, based on their anatomical and functional properties, to assign them to known RSNs (Supplementary Table 1).
The Default Mode Network (Buckner et al., 2008) comprises anterior (aDMN in the ventro- and dorso-medial prefrontal cortex; components 6, 12, 14) and posterior (pDMN in the dorsal precuneus, posterior cingulate cortex and temporo-parietal junction; components 27, 44, 62) sectors.
The attentional network includes several sub-components. Namely, fronto-parietal regions encompassing both the ventral and dorsal attentional networks (Corbetta and Shulman, 2002) (components 37, 46, 58, 61, 66), an “anterior salience” (Seeley et al., 2007b) component involving the dorsal sector of anterior cingulate cortex (dACC) alongside anterior ventral insula (components 25 and 52), as well as a “posterior salience” component involving also the inferior parietal cortex bilaterally (component 50). All the components belonging to the salience network encompassed the dACC region that is typically associated with performance monitoring, conflict processing and cognitive control (Ridderinkhof et al., 2004).
Distinct frontal networks included regions belonging to the fronto-parietal networks of executive functioning (components 39 and 64), as well as fronto-temporal and fronto-limbic regions associated with linguistic and affective processing (components 4, 20, 31, 35). In particular, component 20 encompassed the ventral sector of the anterior temporal cortex and the adjacent temporal pole, i.e. the endpoint of the visual stream implicated in affective processing of visual inputs (Olson et al., 2007), while component 4 involved the amygdala and cerebellum bilaterally.
We identified both primary visual networks in the occipital cuneus (components 23, 55, 70), as well as higher visual networks involving the occipito-temporal (Genovese et al., 2002; Ashburner, 2007; Olson et al., 2007) and occipito-parietal (component 56) cortex. An additional visual network (component 53) encompassed the well-known “hub” of social perception (Allison et al., 2000) in the left middle/superior temporal cortex, extending into the rolandic operculum and posterior insula, associated with higher-level perceptual analyses including social perception and affective processing of visual stimuli.
The sensorimotor network was represented by three components encompassing the postcentral and precentral gyri bilaterally (components 29 and 33), as well as paracentral lobule and middle cingulate cortex (component 2). The auditory network included one component (Cordes et al., 2000) involving the superior temporal cortex bilaterally.
3.2.1. Neuroimaging results: group effects on resting-state metrics and GM density
The initial MANCOVAN (see Section 2.3.5) retained group, EA score and “group by EA” interaction as the only significant predictors of resting-state outcome variables, thus strongly reducing the number of tests performed in subsequent univariate analyses. The latter highlighted significant group effects on power spectra of time courses (Fig. 3, Table 3), as well as on intensity of spatial maps and functional network connectivity (Supplementary Figs. 1–2).
Fig. 3.

Resting-state metrics in bvFTD patients.The figure reports the components displaying a significant difference between bvFTD patients (red) and healthy controls (CTR; in blue) in terms of either a) power spectra of resting-state network (RSN) time course, and b) average gray-matter (GM) volume. Compared with controls, patients typically display reduced GM volume and a relative shift towards higher frequencies in the spontaneous fluctuations of the BOLD signal at rest. The only exception is represented by the right frontal component 64 (bottom of the figures), which displays higher intensity of activation in patients vs. controls as well as no significant group difference in GM volume or resting state power spectra.
Table 3.
Statistical effects associated with resting-state spectral power at low vs. high frequencies.
| Low frequency (<0.05 Hz) |
High frequency (>0.1 Hz) |
|||||
|---|---|---|---|---|---|---|
| Group comparisons | p-Value | Effect-size (r) | Cohen's d | p-Value | Effect-size (r) | Cohen's d |
| C12 | Bin21 | Bin89 | ||||
| Group effect | 0.005140* | −0.4156 | −1.0113 | 0.000057* | 0.5705 | 1.5377 |
| C14 | Bin102 | |||||
| Group effect | – | – | – | 0.000071* | 0.5642 | 1.5125 |
| C50 | Bin108 | |||||
| Group effect | – | – | – | 0.000477* | 0.5062 | 1.2992 |
| C58 | Bin27 | |||||
| Group effect | 0.000357* | −0.5158 | −1.3326 | – | – | – |
| Correlation with EA (bvFTD only) | p-Value | Correlation | p-Value | Correlation | ||
| Bin08 | Bin108 | |||||
| C37 | 0.013950* | 0.685091 | 0.001260* | −0.814355 | ||
| Interaction analyses | p-Value | Partial eta-squared | Observed power | p-Value | Partial eta-squared | Observed power |
| C64 | Bin02 | Bin108 | ||||
| Interaction group × EA | 0.015433* | 0.197110 | 0.751193 | 0.001698* | 0.285174 | 0.927805 |
| C33 | Bin28 | Bin97 | ||||
| Interaction group × EA | 0.006283* | 0.234203 | 0.843163 | 0.000177* | 0.365420 | 0.985926 |
| C53 | Bin15 | Bin107 | ||||
| Interaction group × EA | 0.000267* | 0.351437 | 0.980471 | 0.006720* | 0.231487 | 0.837325 |
| C20 | Bin15 | Bin107 | ||||
| Interaction group × EA | 0.284352 | 0.064044 | 0.264230 | 0.000408* | 0.336863 | 0.973083 |
For each component/bin, the p-value and effects sizes of the statistical test performed are reported. The asterisk in the “p-value” columns denotes the statistics reported as significant after an FDR correction for multiple comparisons. bvFTD: behavioral variant of frontotemporal dementia; EA: emotion attribution.
Supplementary Fig. 1.
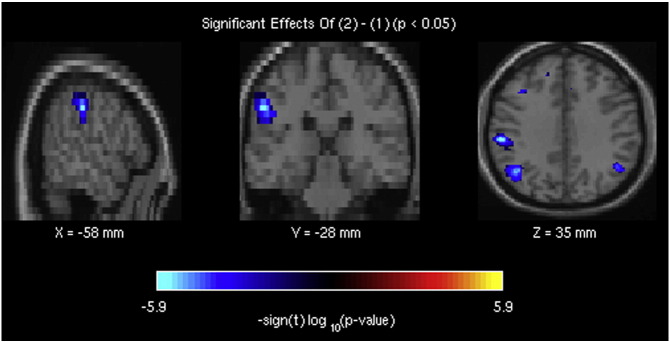
The brain regions, belonging to component 37 of the attentional fronto-parietal network, showing decreased resting-state brain activity in bvFTD patients compared with healthy controls.
Supplementary Fig. 2.
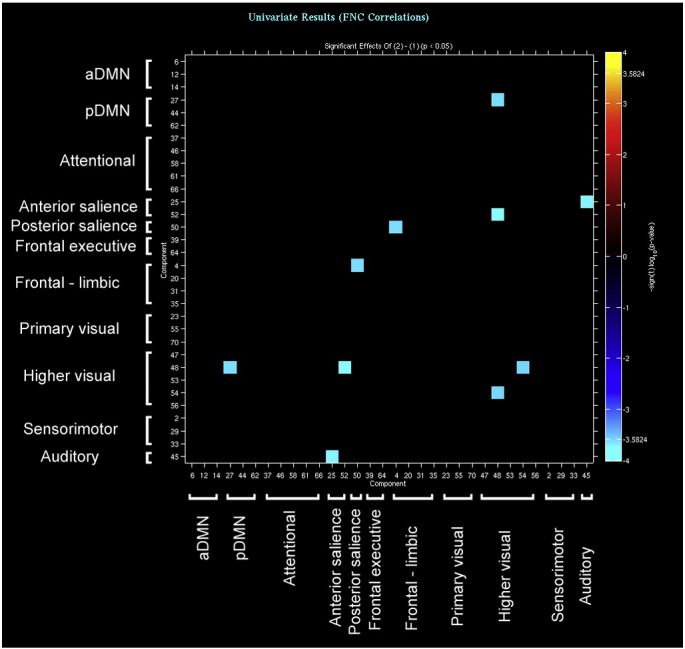
The brain networks showing reduced functional connectivity (i.e. temporal correlation between resting-state time courses) in bvFTD patients compared with healthy controls.
Compared with controls, bvFTD displayed both decreased power spectra at low (<0.1 Hz) and very-low (<0.05 Hz) frequencies, and increased power spectra at high frequencies (>0.1 Hz), in the dorsomedial prefrontal sector of the aDMN (component 12; Fig. 3, top left). In other components, also outside the DMN, we observed only one of such changes in power spectra, indicating a reduction of coherent activity in patients compared with controls (Allen et al., 2011). Namely, one of the fronto-parietal attentional networks (right-hemispheric component 58; Fig. 3, middle right) displayed reduced power spectra at low frequencies in the absence of increased power spectra at high frequencies. An opposite trend, i.e. increased power spectra at high frequencies in the absence of reduced power spectra at low frequencies, was present in two components encompassing the medial frontopolar sector of the aDMN (component 14; Fig. 3, top right) as well as the “posterior salience” attentional network in the inferior parietal cortex (component 50; Fig. 3, middle left). All these regions also displayed a significant reduction of GM density in bvFTD compared with controls. Moreover, GM density in the aDMN (component 14) was positively correlated with EA score.
Reduced intensity of activation was also present in bvFTD in some of these networks, particularly in fronto-parietal regions encompassing attentional ones (Supplementary Fig. 1). Compared with controls, patients displayed reduced activity in the “posterior salience” network (components 50 and 62), as well as in one of the fronto-parietal attentional networks (component 58). GM density was also significantly reduced in bvFTD, compared with controls, in all these networks. In contrast, increased intensity of resting-state activity was present, in patients, in a different component (Cauda et al., 2009) of the right frontal executive network, displaying no significant GM density reduction (Fig. 3, bottom).
Finally, compared with controls bvFTD displayed decreased functional connectivity between several pairs of components. In this case, group comparisons highlighted a widespread pattern of long-distance reduced connectivity between components belonging to the attentional, pDMN, sensorimotor and visual networks (see Supplementary Fig. 2). Within each pair of such components, at least one had reduced GM density in patients compared with controls.
3.2.2. Neuroimaging results: resting-state metrics and task performance in bvFTD patients
We aimed to address the relationship between resting-state metrics and task-specific differences in SET performance between patients and controls. As a first exploratory step we identified the networks whose metrics reflected the strongest behavioral impairment in patients, under the hypothesis that reduced EA performance would be related to decreased coherent activity in the dmPFC (Lamm et al., 2011; Fan et al., 2011). To this purpose, we repeated the whole gICA in the bvFTD group only, testing for a correlation between EA performance and coherent activity in the dmPFC (see Section 3.1). This analysis confirmed that lower EA scores reflected in reduced coherent activity (i.e. reduced power at low frequencies (<0.05 Hz) and increased power at high frequencies (>0.1 Hz)) in the dorsomedial prefrontal sector of the aDMN (Fig. 4, bottom right, Table 3). The latter closely mirrored the analogue component (12; dorsal aDMN) resulting from the main analysis in terms of anatomical localization (Fig. 4, top left), spectral properties (Fig. 4, top right) and GM reduction (t(40) = 4.69; p < 0.0001; Fig. 4, bottom left). We observed no further significant correlation between any of the resting-state metrics and the other SET sub-conditions (i.e. IA or CI) in this component, nor other significant correlations with task performance in any of the other components.
Fig. 4.

Affective mentalizing in bvFTD patients.The dorsomedial sector of the anterior DMN (top-left) is the only component displaying, in bvFTD patients, a significant relationship with EA performance, which is positively related to low-frequency power spectra and negatively related to high frequency ones (bottom-right). This component corresponds to the aDMN highlighted by group comparisons (see component 12 in Fig. 3, top left) in terms of spatial location, GM reduction (bottom left) and resting-state metrics (top right: the red and light-blue temporal profiles are those resulting from the main analysis, while the green profile is that resulting from the analysis in patients only).
The second step was the analysis of task by group interactions. In line with behavioral results, which highlighted EA performance as the most defective in patients (see also Cerami et al., 2014a), only this sub-condition displayed a significant interaction with the group factor (Fig. 5, Table 3). We observed such interaction in two out of the three outcome variables examined, namely power spectra of time courses and functional network connectivity.
Fig. 5.

Task by group interaction.In patients, compared with controls, higher emotion attribution (EA) performance was more strongly associated with internal coherent activity (i.e. higher loading on low frequency power spectra and/or lower loading on high frequency spectra) in different components. Two of them, involving the anterior inferotemporal cortex (component 20) and the middle/superior temporal cortex alongside posterior insular cortex (component 53) also displayed a significant gray matter reduction (bottom half of the figure).
In the former case we found a significant task by group interaction in the right frontal executive (component 64) and sensorimotor (component 33) networks, as well as in a higher visual network implicated in social perception (component 53 in the left middle/superior temporal cortex and posterior insular cortex; Allison et al., 2000; Pelphrey et al., 2005) and in a fronto-limbic network associated with affective processing (component 20 in the anterior inferotemporal cortex, bilaterally; Olson et al., 2007). This interaction was characterized by an opposite relationship between EA performance and spectral power at low vs. high frequencies, in bvFTD vs. controls (see left vs. right panels in Fig. 5). Compared with controls, in patients higher performance in the EA condition reflected in lower power spectra at high frequencies (>0.1 Hz) in all these networks, as well as in higher power at very low frequencies (<0.05 Hz) in the right frontal executive (Cauda et al., 2009), sensorimotor (Friston et al., 1995) and higher visual (Ridderinkhof et al., 2004) components. Healthy controls generally displayed an opposite relationship between EA performance and spectral power in these networks, with EA performance being either uncorrelated with power spectra (components 64 and 20), or negatively related to power spectra at low frequencies (components 33 and 53) and positively related to power spectra at high frequencies (component 33) (Fig. 5). GM density in the fronto-limbic and higher visual components (20 and 53, respectively) was both reduced in patients compared with controls and related to EA (but not to other SET sub-conditions) score (Fig. 5). There were no significant morphometric effect in the other two components.
Finally, also FNC analyses displayed a significant task by group interaction, which once again was limited to EA. In patients, compared with controls, higher performance in this task reflected in a stronger functional connectivity between two medial prefrontal components, i.e. the aDMN (component 14) and attentional/performance monitoring (component 25 in the dACC) networks. Both these components displayed a significant GM reduction in patients compared with controls, and GM density in the aDMN component was also positively correlated with EA score.
3.2.3. Neuroimaging results: the assessment of potential confounds
Resting-state metrics, particularly power spectra, suffer from the influence of non-neural factors related with different physiological variables (Schölvinck et al., 2010). While this influence hampers a full interpretation of age-related findings (Allen et al., 2011; D'Esposito et al., 2003; Birn et al., 2006; Ances et al., 2009), several considerations speak against an account of our results in terms of physiological noise. First, we matched patients and controls with respect to relevant clinical and demographic variables other than the disease of interest, including age. Second, post-processing inspections of fMRI volumes showed no significant group difference concerning the quality of spatial normalization or head motion (Table 2), thus ruling out the possible role of stronger artifacts in patients', compared with controls', data. Moreover, the ICA approach employed here segregates physiological noise in components that are then dismissed using conservative criteria which, in our case, led to select only 32 out of 75 components (approximately as many as those selected by Allen et al. (2011), McKeown et al. (2003) and Kochiyama et al. (2005). Finally, statistical analyses showed no significant effects of either the quality of spatial normalization or head motion on resting-state metrics. All the significant effects, instead, consistently involved networks displaying a) a significant GM atrophy in VBM analyses, and/or b) a relationship between resting-state metrics and performance in the EA task (Cerami et al., 2014a).
4. Discussion
The aim of this study was to investigate the relationship among resting-state brain activity, GM atrophy and performance in the attribution of mental states in bvFTD. To this purpose, we compared 12 bvFTD patients with 30 age- and education-matched healthy controls on: a) performance in a task requiring the attribution of affective vs. cognitive states; b) different metrics of resting-state activity in known functional networks; and c) the relationship between task performance and such resting-state metrics. We also examined the presence of GM atrophy within resting-state networks, in order to assess whether the atrophic/non-atrophic segregation maps onto an informative distinction in terms of brain-behavior relationship, i.e. on networks displaying either group- or task-related (or both) effects.
As previously reported (Cerami et al., 2014a), the behavioral data confirmed that bvFTD patients are impaired in both tasks, and particularly in the attribution of affective states. This specific impairment has been shown to reflect a reduction of GM density in brain regions associated with social cognition, such as amygdala, superior temporal cortex and posterior insula (Cerami et al., 2014a). The present results provide novel complementary evidence based on what is considered an intermediate level of analysis between abnormal brain structure and impaired cognitive-affective processing (Barkhof et al., 2014). Increasing evidence, indeed, shows that a number of behavioral and psychological variables reflect in distinctive patterns of brain activity at rest, both in health (e.g. Zhou et al., 2014) and disease (Greicius, 2008). Such patterns can be described by different resting-state metrics of specific brain networks, namely their power spectra (i.e. the contribution of specific frequency bins to the slow synchronous fluctuations of their BOLD signal), functional connectivity (i.e. the temporal correlation between such fluctuations) and intensity of activation.
In a preliminary assessment of the main effect of the pathology (regardless of task-performance), all these outcome variables highlighted abnormal resting-state activity in bvFTD patients (Fig. 3, Table 3). The analysis of spectral power displayed specific group differences in the contribution of different frequency bins to the slow fluctuation of BOLD signal at rest. Compared with controls, patients showed three different markers of a relative displacement towards higher frequencies in several RNSs, suggestive of reduced intra-network coherent activity (Allen et al., 2011). Namely, either reduced power spectra at low frequencies (fronto-parietal attentional network), increased power spectra at high frequencies (ventral portion of the anterior DMN and parietal “salience” network), or both (dorsal portion of the aDMN). Such an increase in the frequency of resting-state activity has been previously shown in ageing (Allen et al., 2011) and in different neuro-psychiatric diseases (e.g. Cauda et al., 2009; Otti et al., 2013), with the reduction of intra-network coherent activity likely reflecting defective connectivity among the key nodes of RSNs (Garrity et al., 2007). Indeed, patients also displayed decreased strength of activation in a subset of these networks (all related to attentional processing), as well as a widespread pattern of decreased functional connectivity between several pairs of networks. These results support previous evidence on the neural alterations associated with bvFTD, i.e. abnormal resting-resting activity in fronto-medial and fronto-insular structures in charge of affective processing (Craig, 2002, 2009), as well as loss of hubs in frontal areas highlighted by graph connectivity analyses (Agosta et al., 2013), with a relative sparing of the posterior components of DMN (Zhou and Seeley, 2014).
All the above components displayed both anomalous resting-state activity and a significant reduction of GM density in bvFTD patients. This first set of results thus highlights an additional explanatory level, in which intrinsic brain activity may represent an intermediate level of analysis (Meyer-Lindenberg and Weinberger, 2006) between behavioral (“core” executive and socio-affective impairments present in bvFTD) and neurostructural changes (fronto-lateral and fronto-limbic cortical atrophy and fiber tract changes; Filippi et al., 2013; Seeley et al., 2007a,b; Neary et al., 1998, 2005; Rosen et al., 2002). In particular, the assessment of intrinsic brain activity may thus unveil novel facets of the disease (e.g. in terms of brain-behavior relationship), as well as possible compensatory mechanisms in regions spared from neurodegeneration. Previous studies highlighted, in bvFTD, potential compensatory mechanisms which may vicariate the functions associated with damaged regions, e.g. increased functional connectivity at rest in regions close to the atrophic areas (Rytty et al., 2013). In line with this evidence, we observed stronger activity, in bvFTD vs. controls, in a right frontal component (Cauda et al., 2009) of the executive network, which additionally showed no reduction in GM density (Fig. 3, bottom). We thus assessed whether this network may support the functions of damaged regions, and accordingly patients' residual mentalizing abilities.
In line with behavioral data, only the EA task was significantly related to resting-state outcome variables. Namely, patients' worse EA performance reflected in reduced coherent activity (i.e. decreased power at low frequencies and increased power at high frequencies) in the dorsomedial prefrontal component of the aDMN (Fig. 4, Table 3). The latter encompasses the so-called “dorsomedial prefrontal cortex subsystem”, previously associated with self-reflection on one's own mental states (Andrews-Hanna et al., 2010) and the processing of social interactions (Iacoboni et al., 2004), as well as with cognitive regulation of emotional behavior (Ochsner et al., 2004) and mentalizing on other's affective states (Ochsner et al., 2005). Recent meta-analytic evidence confirmed the role of this brain region as a critical hub for the perception of complex social stimuli (Eickhoff et al., 2014), including affective stimuli generating empathic responses (Fan et al., 2011; Lamm et al., 2011). Noteworthy, alongside decreased coherent activity this component also displays reduced GM density, and both these metrics of brain damage relate to EA performance. The anatomo-functional impairment of this region is thus likely to play a role in the socio-affective deficits characterizing bvFTD (Gleichgerrcht et al., 2011; Gregory et al., 2002; Kipps, and Hodges, 2006; Lough et al., 2006; Mendez, 2006; Mendez and Shapira, 2009; Torralva et al., 2007).
Consistent with this hypothesis, a task by group interaction confirmed the exclusive role of the EA task in differentiating the two groups, and its specific relationship with two abnormal resting-state metrics (Fig. 5, Table 3). In bvFTD patients (vs. controls) higher EA scores were associated with stronger functional connectivity between medial prefrontal sectors of the DMN (component 14 in the medial frontopolar cortex) and the attentional network (component 25 in the dACC). Moreover, in patients higher EA scores reflected in increased coherent activity (i.e. higher contribution of low frequencies, and/or lower contribution of high frequencies) in structures belonging to the right frontal executive (component 64) and sensorimotor (component 33) networks, as well as to higher-order visual networks implicated in social perception (component 53 encompassing the middle/superior temporal cortex and posterior insular cortex (Zilbovicius et al., 2006) and affective processing (component 20 in the anterior inferotemporal cortex (Olson et al., 2007)) (see Fig. 5). These results, indicating a different relationship between EA scores and the functional properties of specific RSNs across patients and controls, are compatible with two underlying processes supporting task performance in bvFTD.
The properties of the latter two components, involving portions of the temporal cortex associated with the affective processing of social stimuli (van de Riet et al., 2009; Said et al., 2011), closely mirror the neuro-cognitive impairment characterizing bvFTD: besides displaying a relationship between EA performance and the degree of their coherent activity, indeed, GM density in these regions is positively correlated with EA performance, and reduced in patients compared with controls. Therefore, in line with our previous findings in the same regions (Cerami et al., 2014a), these data may highlight the residual functionality of the neural mechanisms in charge of the attribution of affective states to other individuals in normal conditions. That is, higher performance by those patients in whom coherent activity in brain networks underlying EA performance is still partially spared by neurodegeneration. These findings are in line with the “nexopathy” model of neurodegenerative disease (Warren et al., 2013). According to this model, functional and structural connectivity changes are already present in the pre-symptomatic stages of familial FTD (Dopper et al., 2013), and changes in neural structures subserving social cognition abilities, i.e. uncinate fasciculus and cingulum bundle (Mahoney et al., 2014, 2015) connecting frontomedial and temporo-limbic regions, are correlated with their impairment (Downey et al., 2015).
Moreover, in patients more than controls, EA performance is also supported by coherent activity in right frontal executive (component 64) and sensorimotor (component 33) networks in which GM density was neither related to EA performance, nor reduced in patients (Fig. 5, Table 3). This evidence may represent the outcome of a compensatory process, whereby alternative neural pathways support the ability to attribute affective states to others, undermined by the functional/structural impairments in the related networks. In line with this hypothesis, previous studies have shown a role of the somatosensory cortex in the simulation of others' feelings underlying the empathic ability (Bastiaansen et al., 2009), as well as of the right frontal cortex in affective ToM (Couto et al., 2013) and intention understanding (Iacoboni et al., 2005). These regions, in conjunction with executive control, may thus provide an alternative route to the direct mapping of affective states by limbic regions in charge of an empathic resonance, such as medial temporal cortex and posterior insula. The success of this re-modeling of functions would thus depend on the efficiency of such mechanisms, so that — in line with the present results — higher EA scores would reflect stronger coherent activity within compensatory networks spared from neurodegeneration. The frontal component of the executive network is the only one in which preserved GM density and resting-state metrics couple with both increased strength of activation, and a stronger relationship between coherent activity and EA performance in patients compared with controls. This unique conjunction of features suggests that this network may play a leading role in compensatory mechanism supporting affective mentalizing in bvFTD.
5. Conclusions
The present results suggest that, in bvFTD, a specific impairment in the attribution of affective states to other individuals reflects both early structural vulnerability of fronto-limbic and fronto-insular cortex (see Cerami et al., 2014a), and anomalous resting-state activity in medial prefrontal and limbic networks underpinning the affective facets of mentalizing (Fan et al., 2011; Lamm et al., 2011). These data support previous evidence showing both global hypoconnectivity and local hyperconnectivity of specific regions in bvFTD (García-Cordero et al., 2015) and other neurodegenerative conditions (Pasquini et al., 2015). In line with our interpretation of the present results, hypoconnectivity has been associated with gray matter atrophy in bvFTD (García-Cordero et al., 2015), while increased connectivity without atrophy has been suggested to reflect protein aggregation, possibly activating compensatory mechanisms (Ibañez, and Manes, 2012; Pievani et al., 2014; García-Cordero et al., 2015). Some of the observed functional changes may actually represent compensatory mechanisms relying on alternative neural pathways for the understanding of other's affective states. The residual mentalizing abilities associated with superior temporal, posterior insular and anterior inferotemporal cortex may thus be supported by an interaction between more resilient mechanisms of executive control and somatosensory affective resonance.
A limitation of the study is the relatively small size of patient sample. It must be underlined, however, that the results are in full agreement with previous evidence (Cerami et al., 2014a; Baez et al., 2014; Gleichgerrcht et al., 2011), as different analyses consistently highlighted an association between impaired affective mentalizing and abnormal fronto-limbic intrinsic brain activity paralleling the early clinical profile and pattern of gray matter atrophy in bvFTD patients (Cerami et al., 2014a). Besides confirming the relative specificity of the empathic deficit in bvFTD, and therefore the diagnostic potential of social cognition abilities in this type of dementia, the analysis of resting-state activity unveils a neural signature of such impairment as well as a possible functional compensation, suggesting residual mechanisms of neural plasticity in neurodegenerative disorders.
The following are the supplementary data related to this article.
Anatomical localization of each network/component.
Correlation between experimental and nuisance predictors.
Supplementary material.
Acknowledgments
This work was supported by a MIUR grant (PRIN 2010XPMFW4_008; I meccanismi neurocognitivi alla base delle interazioni sociali) to SFC. The authors declare no conflict of interest. Dr. Cerami was funded by Fondazione Eli-Lilly (Eli-Lilly grant 2011 "Imaging of neuroinflammation and neurodegeneration in prodromal and presymptomatic Alzheimer's disease phases").
References
- Allen E., Erhardt E., Eichele T., Mayer A.R., Calhoun V. Comparison of pre-normalization methods on the accuracy and reliability of group ICA results; 16th Annual Meeting of the Organization of Human Brain Mapping; 2010. [Google Scholar]
- Allen E.A., Erhardt E.B., Damaraju E., Gruner W., Segall J.M., Silva R.F., Havlicek M., Rachakonda S., Fries J., Kalyanam R., Michael A.M., Caprihan A., Turner J.A., Eichele T., Adelsheim S., Bryan A.D., Bustillo J., Clark V.P., Feldstein Ewing S.W., Filbey F., Ford C.C., Hutchison K., Jung R.E., Kiehl K.A., Kodituwakku P., Komesu Y.M., Mayer A.R., Pearlson G.D., Phillips J.P., Sadek J.R., Stevens M., Teuscher U., Thoma R.J., Calhoun V.D. A baseline for the multivariate comparison of resting-state networks. Front. Syst. Neurosci. 2011;5(February):2. doi: 10.3389/fnsys.2011.00002. [DOI] [PMC free article] [PubMed] [Google Scholar]
- Allison T. Social perception from visual cues: role of the STS region. Trends Cogn. Sci. (Regul. Ed.) 2000;4(7):267–278. doi: 10.1016/s1364-6613(00)01501-1. 10859571 [DOI] [PubMed] [Google Scholar]
- Adolphs R. The social brain: neural basis of social knowledge. Annu. Rev. Psychol. 2009;60:693–716. doi: 10.1146/annurev.psych.60.110707.163514. 18771388 [DOI] [PMC free article] [PubMed] [Google Scholar]
- Agosta F., Sala S., Valsasina P., Meani A., Canu E., Magnani G., Cappa S.F., Scola E., Quatto P., Horsfield M.A., Falini A., Comi G., Filippi M. Brain network connectivity assessed using graph theory in frontotemporal dementia. Neurology. 2013;81(2):134–143. doi: 10.1212/WNL.0b013e31829a33f8. 23719145 [DOI] [PubMed] [Google Scholar]
- Ances B.M., Liang C.L., Leontiev O., Perthen J.E., Fleisher A.S., Lansing A.E., Buxton R.B. Effects of aging on cerebral blood flow, oxygen metabolism, and blood oxygenation level dependent responses to visual stimulation. Hum. Brain Mapp. 2009;30(4):1120–1132. doi: 10.1002/hbm.20574. 18465743 [DOI] [PMC free article] [PubMed] [Google Scholar]
- Andrews-Hanna J.R., Reidler J.S., Sepulcre J., Poulin R., Buckner R.L. Functional-anatomic fractionation of the brain's default network. Neuron. 2010;65(4):550–562. doi: 10.1016/j.neuron.2010.02.005. 20188659 [DOI] [PMC free article] [PubMed] [Google Scholar]
- Ashburner J. A fast diffeomorphic image registration algorithm. Neuroimage. 2007;38(1):95–113. doi: 10.1016/j.neuroimage.2007.07.007. 17761438 [DOI] [PubMed] [Google Scholar]
- Ashburner J., Friston K.J. Voxel-based morphometry—the methods. Neuroimage. 2000;11(6 Pt 1):805–821. doi: 10.1006/nimg.2000.0582. 10860804 [DOI] [PubMed] [Google Scholar]
- Baez S., Manes F., Huepe D., Torralva T., Fiorentino N., Richter F., Huepe-Artigas D., Ferrari J., Montañes P., Reyes P., Matallana D., Vigliecca N.S., Decety J., Ibanez A. Primary empathy deficits in frontotemporal dementia. Front. Aging Neurosci. 2014;6:262. doi: 10.3389/fnagi.2014.00262. 25346685 [DOI] [PMC free article] [PubMed] [Google Scholar]
- Barkhof F., Haller S., Rombouts S.A.R.B. Resting-state functional MR imaging: a new window to the brain. Radiology. 2014;272(1):29–49. doi: 10.1148/radiol.14132388. 24956047 [DOI] [PubMed] [Google Scholar]
- Bastiaansen J.A.C.J., Thioux M., Keysers C. Evidence for mirror systems in emotions. Philos. Trans. R. Soc. Lond., B, Biol. Sci. 2009;364(1528):2391–2404. doi: 10.1098/rstb.2009.0058. 19620110 [DOI] [PMC free article] [PubMed] [Google Scholar]
- Bell A.J., Sejnowski T.J. An information-maximization approach to blind separation and blind deconvolution. Neural Comput. 1995;7(6):1129–1159. doi: 10.1162/neco.1995.7.6.1129. 7584893 [DOI] [PubMed] [Google Scholar]
- Birn R.M., Diamond J.B., Smith M.A., Bandettini P.A. Separating respiratory-variation-related fluctuations from neuronal-activity-related fluctuations in fMRI. Neuroimage. 2006;31(4):1536–1548. doi: 10.1016/j.neuroimage.2006.02.048. 16632379 [DOI] [PubMed] [Google Scholar]
- Biswal B., Yetkin F.Z., Haughton V.M., Hyde J.S. Functional connectivity in the motor cortex of resting human brain using echo-planar mri. Magn. Reson. Med. 1995;34(4):537–541. doi: 10.1002/mrm.1910340409. 8524021 [DOI] [PubMed] [Google Scholar]
- Biswal B.B., Mennes M., Zuo X.-N., Gohel S., Kelly C., Smith S.M., Beckmann C.F., Adelstein J.S., Buckner R.L., Colcombe S., Dogonowski A.M., Ernst M., Fair D., Hampson M., Hoptman M.J., Hyde J.S., Kiviniemi V.J., Kötter R., Li S.J., Lin C.P., Lowe M.J., Mackay C., Madden D.J., Madsen K.H., Margulies D.S., Mayberg H.S., McMahon K., Monk C.S., Mostofsky S.H., Nagel B.J., Pekar J.J., Peltier S.J. Toward discovery science of human brain function. Proc. Natl. Acad. Sci. U. S. A. 2010;107(10):4734–4739. doi: 10.1073/pnas.0911855107. 20176931 [DOI] [PMC free article] [PubMed] [Google Scholar]
- Buckner R.L., Andrews-Hanna J.R., Schacter D.L. The brain's default network: anatomy, function, and relevance to disease. Ann. N. Y. Acad. Sci. 2008;1124(1):1–38. doi: 10.1196/annals.1440.011. 18400922 [DOI] [PubMed] [Google Scholar]
- Calhoun V.D., Adali T., Pearlson G.D., Pekar J.J. Spatial and temporal independent component analysis of functional MRI data containing a pair of task-related waveforms. Hum. Brain Mapp. 2001;13(1):43–53. doi: 10.1002/hbm.1024. 11284046 [DOI] [PMC free article] [PubMed] [Google Scholar]
- Calhoun V.D., Adali T., Pearlson G.D., Pekar J.J. A method for making group inferences from functional MRI data using independent component analysis. Hum. Brain Mapp. 2001;14(3):140–151. doi: 10.1002/hbm.1048. 11559959 [DOI] [PMC free article] [PubMed] [Google Scholar]
- Cauda F., Sacco K., Duca S., Cocito D., D'Agata F., Geminiani G.C., Canavero S. Altered resting state in diabetic neuropathic pain. PLOS One. 2009;4(2):e4542. doi: 10.1371/journal.pone.0004542. 19229326 [DOI] [PMC free article] [PubMed] [Google Scholar]
- Cerami C., Cappa S.F. The behavioral variant of frontotemporal dementia: linking neuropathology to social cognition. Neurol. Sci. 2013;34(8):1267–1274. doi: 10.1007/s10072-013-1317-9. 23377232 [DOI] [PubMed] [Google Scholar]
- Cerami C., Dodich A., Canessa N., Crespi C., Iannaccone S., Corbo M., Lunetta C., Consonni M., Scola E., Falini A., Cappa S.F. Emotional empathy in amyotrophic lateral sclerosis: a behavioural and voxel-based morphometry study. Amyotroph. Lateral Scler. Frontotemporal Degener. 2014;15(1–2):21–29. doi: 10.3109/21678421.2013.785568. 23586919 [DOI] [PubMed] [Google Scholar]
- Cerami C., Dodich A., Canessa N., Crespi C., Marcone A., Cortese F., Chierchia G., Scola E., Falini A., Cappa S.F. Neural correlates of empathic impairment in the behavioral variant of frontotemporal dementia. Alzheimers Dement. 2014;10(6):827–834. doi: 10.1016/j.jalz.2014.01.005. 24589435 [DOI] [PubMed] [Google Scholar]
- Corbetta M., Shulman G.L. Control of goal-directed and stimulus-driven attention in the brain. Nat. Rev. Neurosci. 2002;3(3):201–215. doi: 10.1038/nrn755. 11994752 [DOI] [PubMed] [Google Scholar]
- Cordes D., Haughton V.M., Arfanakis K., Wendt G.J., Turski P.A., Moritz C.H., Quigley M.A., Meyerand M.E. Mapping functionally related regions of brain with functional connectivity MR imaging. A.J.N.R. Am. J. Neuroradiol. 2000;21(9):1636–1644. 11039342 [PMC free article] [PubMed] [Google Scholar]
- Couto B., Manes F., Montañés P., Matallana D., Reyes P., Velasquez M., Yoris A., Baez S., Ibáñez A. Structural neuroimaging of social cognition in progressive non-fluent aphasia and behavioral variant of frontotemporal dementia. Front. Hum. Neurosci. 2013;7:467. doi: 10.3389/fnhum.2013.00467. 23966929 [DOI] [PMC free article] [PubMed] [Google Scholar]
- Craig A.D. How do you feel? Interoception: the sense of the physiological condition of the body. Nat. Rev. Neurosci. 2002;3(8):655–666. doi: 10.1038/nrn894. 12154366 [DOI] [PubMed] [Google Scholar]
- Craig A.D. How do you feel—now? the anterior insula and human awareness. Nat. Rev. Neurosci. 2009;10(1):59–70. doi: 10.1038/nrn2555. 19096369 [DOI] [PubMed] [Google Scholar]
- D'Esposito M., Deouell L.Y., Gazzaley A. Alterations in the BOLD fMRI signal with ageing and disease: a challenge for neuroimaging. Nat. Rev. Neurosci. 2003;4(11):863–872. doi: 10.1038/nrn1246. 14595398 [DOI] [PubMed] [Google Scholar]
- Dodich A., Cerami C., Canessa N., Crespi C., Iannaccone S., Marcone A., Realmuto S., Lettieri G., Perani D., Cappa S.F. A novel task assessing intention and emotion attribution: Italian standardization and normative data of the story-based empathy task. Neurol. Sci. 2015:1–6. doi: 10.1007/s10072-015-2281-3. [DOI] [PubMed] [Google Scholar]
- Dopper E.G.P., Rombouts S.A.R.B., Jiskoot L.C., den Heijer T.d, de Graaf J.R.A., de Koning I.d, Hammerschlag A.R., Seelaar H., Seeley W.W., Veer I.M., van Buchem M.A., Rizzu P., van Swieten J.C. Structural and functional brain connectivity in presymptomatic familial frontotemporal dementia. Neurology. 2013;80(9):814–823. doi: 10.1212/WNL.0b013e31828407bc. 23390180 [DOI] [PMC free article] [PubMed] [Google Scholar]
- Downey L.E., Mahoney C.J., Buckley A.H., Golden H.L., Henley S.M., Schmitz N., Schott J.M., Simpson I.J., Ourselin S., Fox N.C., Crutch S.J., Warren J.D. White matter tract signatures of impaired social cognition in frontotemporal lobar degeneration. Neuroimage Clin. 2015;8:640–651. doi: 10.1016/j.nicl.2015.06.005. 26236629 [DOI] [PMC free article] [PubMed] [Google Scholar]
- Eickhoff S.B., Laird A.R., Fox P.T., Bzdok D., Hensel L. Functional segregation of the human dorsomedial prefrontal cortex. Cereb. Cortex. 2014:1–18. doi: 10.1093/cercor/bhu250. 25331597 [DOI] [PMC free article] [PubMed] [Google Scholar]
- Eickhoff S.B., Stephan K.E., Mohlberg H., Grefkes C., Fink G.R., Amunts K., Zilles K. A new SPM toolbox for combining probabilistic cytoarchitectonic maps and functional imaging data. Neuroimage. 2005;25(4):1325–1335. doi: 10.1016/j.neuroimage.2004.12.034. 15850749 [DOI] [PubMed] [Google Scholar]
- Elamin M., Pender N., Hardiman O., Abrahams S. Social cognition in neurodegenerative disorders: a systematic review. J. Neurol. Neurosurg. Psychiatry. 2012;83(11):1071–1079. doi: 10.1136/jnnp-2012-302817. 22869923 [DOI] [PubMed] [Google Scholar]
- Erhardt E.B., Rachakonda S., Bedrick E.J., Allen E.A., Adali T., Calhoun V.D. Comparison of multi-subject ICA methods for analysis of fMRI data. Hum. Brain Mapp. 2011;32(12):2075–2095. doi: 10.1002/hbm.21170. 21162045 [DOI] [PMC free article] [PubMed] [Google Scholar]
- Fan Y., Duncan N.W., de Greck M., Northoff G. Is there a core neural network in empathy? An fMRI based quantitative meta-analysis. Neurosci. Biobehav. Rev. 2011;35(3):903–911. doi: 10.1016/j.neubiorev.2010.10.009. 20974173 [DOI] [PubMed] [Google Scholar]
- Filippi M., Agosta F., Scola E., Canu E., Magnani G., Marcone A., Valsasina P., Caso F., Copetti M., Comi G., Cappa S.F., Falini A. Functional network connectivity in the behavioral variant of frontotemporal dementia. Cortex. 2013;49(9):2389–2401. doi: 10.1016/j.cortex.2012.09.017. 23164495 [DOI] [PubMed] [Google Scholar]
- Friston K.J., Holmes A.P., Poline J.B., Grasby P.J., Williams S.C., Frackowiak R.S., Turner R. Analysis of fMRI time-series revisited. Neuroimage. 1995;2(1):45–53. doi: 10.1006/nimg.1995.1007. 9343589 [DOI] [PubMed] [Google Scholar]
- Frith C.D. The social brain? Philosophical Transactions of the Royal Society B: Biological Sciences. 2007;362(1480):671–678. doi: 10.1098/rstb.2006.2003. [DOI] [PMC free article] [PubMed] [Google Scholar]
- García-Cordero I., Sedeño L., Fraiman D., Craiem D., de la Fuente L.A., Salamone P., Serrano C., Sposato L., Manes F., Ibañez A. Stroke and neurodegeneration induce different connectivity aberrations in the insula. Stroke. 2015 doi: 10.1161/STROKEAHA.115.009598. 26185182 [DOI] [PubMed] [Google Scholar]
- Garrity A.G., Pearlson G.D., McKiernan K., Lloyd D., Kiehl K.A., Calhoun V.D. Aberrant ‘default mode’ functional connectivity in schizophrenia. Am J Psychiatry. 2007;164(3):450–457. doi: 10.1176/ajp.2007.164.3.450. 17329470 [DOI] [PubMed] [Google Scholar]
- Genovese C.R., Lazar N.A., Nichols T. Thresholding of statistical maps in functional neuroimaging using the false discovery rate. Neuroimage. 2002;15(4):870–878. doi: 10.1006/nimg.2001.1037. 11906227 [DOI] [PubMed] [Google Scholar]
- Gleichgerrcht E., Ibáñez A., Roca M., Torralva T., Manes F. Decision-making cognition in neurodegenerative diseases. Nat. Rev. Neurol. 2010;6(11):611–623. doi: 10.1038/nrneurol.2010.148. 21045795 [DOI] [PubMed] [Google Scholar]
- Gleichgerrcht E., Torralva T., Roca M., Pose M., Manes F. The role of social cognition in moral judgment in frontotemporal dementia. Soc. Neurosci. 2011;6(2):113–122. doi: 10.1080/17470919.2010.506751. 20706963 [DOI] [PubMed] [Google Scholar]
- Gregory C., Lough S., Stone V., Erzinclioglu S., Martin L., Baron-Cohen S., Hodges J.R. Theory of mind in patients with frontal variant frontotemporal dementia and Alzheimer's disease: theoretical and practical implications. Brain. 2002;125(4):752–764. doi: 10.1093/brain/awf079. 11912109 [DOI] [PubMed] [Google Scholar]
- Greicius M. Resting-state functional connectivity in neuropsychiatric disorders. Curr. Opin. Neurol. 2008;21(4):424–430. doi: 10.1097/WCO.0b013e328306f2c5. 18607202 [DOI] [PubMed] [Google Scholar]
- Greicius M.D., Kimmel D.L. Neuroimaging insights into network-based neurodegeneration. Curr. Opin. Neurol. 2012;25(6):727–734. doi: 10.1097/WCO.0b013e32835a26b3. 23108250 [DOI] [PubMed] [Google Scholar]
- Himberg J., Hyvärinen A., Esposito F. Validating the independent components of neuroimaging time series via clustering and visualization. Neuroimage. 2004;22(3):1214–1222. doi: 10.1016/j.neuroimage.2004.03.027. 15219593 [DOI] [PubMed] [Google Scholar]
- Iacoboni M., Lieberman M.D., Knowlton B.J., Molnar-Szakacs I., Moritz M., Throop C.J., Fiske A.P. Watching social interactions produces dorsomedial prefrontal and medial parietal BOLD fMRI signal increases compared to a resting baseline. Neuroimage. 2004;21(3):1167–1173. doi: 10.1016/j.neuroimage.2003.11.013. 15006683 [DOI] [PubMed] [Google Scholar]
- Iacoboni M., Molnar-Szakacs I., Gallese V., Buccino G., Mazziotta J.C., Rizzolatti G. Grasping the intentions of others with one's own mirror neuron system. PLOS Biol. 2005;3(3):e79. doi: 10.1371/journal.pbio.0030079. 15736981 [DOI] [PMC free article] [PubMed] [Google Scholar]
- Ibañez A., Manes F. Contextual social cognition and the behavioral variant of frontotemporal dementia. Neurol. 2012;78(17):1354–1362. doi: 10.1212/WNL.0b013e3182518375. 22529204 [DOI] [PMC free article] [PubMed] [Google Scholar]
- Irish M., Piguet O., Hodges J.R. Self-projection and the default network in frontotemporal dementia. Nat. Rev. Neurol. 2011;8(3):152–161. doi: 10.1038/nrneurol.2012.11. 22331029 [DOI] [PubMed] [Google Scholar]
- Khanna N., Altmeyer W., Zhuo J., Steven A. Functional neuroimaging: fundamental principles and clinical applications. Neuroradiol J. 2015;28(2):87–96. doi: 10.1177/1971400915576311. 25963153 [DOI] [PMC free article] [PubMed] [Google Scholar]
- Kim E.J., Sidhu M., Gaus S.E., Huang E.J., Hof P.R., Miller B.L., DeArmond S.J., Seeley W.W. Selective frontoinsular von Economo neuron and fork cell loss in early behavioral variant frontotemporal dementia. Cereb. Cortex. 2012;22(2):251–259. doi: 10.1093/cercor/bhr004. 21653702 [DOI] [PMC free article] [PubMed] [Google Scholar]
- Kipps C.M., Hodges J.R. Theory of mind in frontotemporal dementia. Soc. Neurosci. 2006;1(3–4):235–244. doi: 10.1080/17470910600989847. 18633790 [DOI] [PubMed] [Google Scholar]
- Kochiyama T., Morita T., Okada T., Yonekura Y., Matsumura M., Sadato N. Removing the effects of task-related motion using independent-component analysis. Neuroimage. 2005;25(3):802–814. doi: 10.1016/j.neuroimage.2004.12.027. 15808981 [DOI] [PubMed] [Google Scholar]
- Lamm C., Decety J., Singer T. Meta-analytic evidence for common and distinct neural networks associated with directly experienced pain and empathy for pain. Neuroimage. 2011;54(3):2492–2502. doi: 10.1016/j.neuroimage.2010.10.014. 20946964 [DOI] [PubMed] [Google Scholar]
- Lieberman M.D. Social cognitive neuroscience: a review of core processes. Annu. Rev. Psychol. 2007;58:259–289. doi: 10.1146/annurev.psych.58.110405.085654. 17002553 [DOI] [PubMed] [Google Scholar]
- Lough S., Kipps C.M., Treise C., Watson P., Blair J.R., Hodges J.R. Social reasoning, emotion and empathy in frontotemporal dementia. Neuropsychologia. 2006;44(6):950–958. doi: 10.1016/j.neuropsychologia.2005.08.009. 16198378 [DOI] [PubMed] [Google Scholar]
- Mahoney C.J., Ridgway G.R., Malone I.B., Downey L.E., Beck J., Kinnunen K.M., Schmitz N., Golden H.L., Rohrer J.D., Schott J.M., Rossor M.N., Ourselin S., Mead S., Fox N.C., Warren J.D. Profiles of white matter tract pathology in frontotemporal dementia. Hum. Brain Mapp. 2014;35(8):4163–4179. doi: 10.1002/hbm.22468. 24510641 [DOI] [PMC free article] [PubMed] [Google Scholar]
- Mahoney C.J., Simpson I.J.A., Nicholas J.M., Fletcher P.D., Downey L.E., Golden H.L., Clark C.N., Schmitz N., Rohrer J.D., Schott J.M., Zhang H., Ourselin S., Warren J.D., Fox N.C. Longitudinal diffusion tensor imaging in frontotemporal dementia. Ann. Neurol. 2015;77(1):33–46. doi: 10.1002/ana.24296. 25363208 [DOI] [PMC free article] [PubMed] [Google Scholar]
- McKeown M.J., Hansen L.K., Sejnowsk T.J. Independent component analysis of functional MRI: what is signal and what is noise? Curr. Opin. Neurobiol. 2003;13(5):620–629. doi: 10.1016/j.conb.2003.09.012. 14630228 [DOI] [PMC free article] [PubMed] [Google Scholar]
- Mendez M.F. What frontotemporal dementia reveals about the neurobiological basis of morality. Med. Hypotheses. 2006;67(2):411–418. doi: 10.1016/j.mehy.2006.01.048. 16540253 [DOI] [PubMed] [Google Scholar]
- Mendez M.F., Shapira J.S. Altered emotional morality in frontotemporal dementia. Cogn. Neuropsychiatry. 2009;14(3):165–179. doi: 10.1080/13546800902924122. 19499384 [DOI] [PubMed] [Google Scholar]
- Meyer-Lindenberg A., Weinberger D.R. Intermediate phenotypes and genetic mechanisms of psychiatric disorders. Nat. Rev. Neurosci. 2006;7(10):818–827. doi: 10.1038/nrn1993. 16988657 [DOI] [PubMed] [Google Scholar]
- Neary D., Snowden J., Mann D. Frontotemporal dementia. Lancet Neurol. 2005;4(11):771–780. doi: 10.1016/S1474-4422(05)70223-4. 16239184 [DOI] [PubMed] [Google Scholar]
- Neary D., Snowden J.S., Gustafson L., Passant U., Stuss D., Black S., Freedman M.F., Kertesz A., Robert P.H., Albert M., Boone K., Miller B.L., Cummings J., Benson D.F. Frontotemporal lobar degeneration: a consensus on clinical diagnostic criteria. Neurology. 1998;51(6):1546–1554. doi: 10.1212/wnl.51.6.1546. 9855500 [DOI] [PubMed] [Google Scholar]
- Ochsner K.N., Beer J.S., Robertson E.R., Cooper J.C., Gabrieli J.D.E., Kihsltrom J.F., D'Esposito M. The neural correlates of direct and reflected self-knowledge. Neuroimage. 2005;28(4):797–814. doi: 10.1016/j.neuroimage.2005.06.069. 16290016 [DOI] [PubMed] [Google Scholar]
- Ochsner K.N., Knierim K., Ludlow D.H., Hanelin J., Ramachandran T., Glover G., Mackey S.C. Reflecting upon feelings: an fMRI study of neural systems supporting the attribution of emotion to self and other. Cogn. Neurosci. J. 2004;16(10):1746–1772. doi: 10.1162/0898929042947829. 15701226 [DOI] [PubMed] [Google Scholar]
- Olson I.R., Plotzker A., Ezzyat Y. The enigmatic temporal pole: a review of findings on social and emotional processing. Brain. 2007;130(7):1718–1731. doi: 10.1093/brain/awm052. 17392317 [DOI] [PubMed] [Google Scholar]
- Otti A., Guendel H., Wohlschläger A., Zimmer C., Noll-Hussong M. Frequency shifts in the anterior default mode network and the salience network in chronic pain disorder. B.M.C. Psychiatry. 2013;13(1):84. doi: 10.1186/1471-244X-13-84. 23497482 [DOI] [PMC free article] [PubMed] [Google Scholar]
- Pasquini L., Scherr M., Tahmasian M., Meng C., Myers N.E., Ortner M., Mühlau M., Kurz A., Förstl H., Zimmer C., Grimmer T., Wohlschläger A.M., Riedl V., Sorg C. Link between hippocampus' raised local and eased global intrinsic connectivity in AD. Alzheimers Dement. 2015;11(5):475–484. doi: 10.1016/j.jalz.2014.02.007. 25043909 [DOI] [PubMed] [Google Scholar]
- Pelphrey K.A., Morris J.P., Michelich C.R., Allison T., McCarthy G. Functional anatomy of biological motion perception in posterior temporal cortex: an fMRI study of Eye, mouth and hand movements. Cereb. Cortex. 2005;15(12):1866–1876. doi: 10.1093/cercor/bhi064. 15746001 [DOI] [PubMed] [Google Scholar]
- Pievani M., Filippini N., van den Heuvel M.P., Cappa S.F., Frisoni G.B. Brain connectivity in neurodegenerative diseases—from phenotype to proteinopathy. Nat. Rev. Neurol. 2014;10(11):620–633. doi: 10.1038/nrneurol.2014.178. 25287597 [DOI] [PubMed] [Google Scholar]
- Piguet O., Hornberger M., Mioshi E., Hodges J.R. Behavioural-variant frontotemporal dementia: diagnosis, clinical staging, and management. Lancet Neurol. 2011;10(2):162–172. doi: 10.1016/S1474-4422(10)70299-4. 21147039 [DOI] [PubMed] [Google Scholar]
- Rankin K.P., Gorno-tempini M.L., Allison S.C., Stanley C.M., Glenn S., Weiner M.W., Miller B.L. Structural anatomy of empathy in neurodegenerative disease. Brain. 2006;129(11):2945–2956. doi: 10.1093/brain/awl254. 17008334 [DOI] [PMC free article] [PubMed] [Google Scholar]
- Rascovsky K., Hodges J.R., Knopman D., Mendez M.F., Kramer J.H., Neuhaus J., van Swieten J.C., Seelaar H., Dopper E.G., Onyike C.U., Hillis A.E., Josephs K.A., Boeve B.F., Kertesz A., Seeley W.W., Rankin K.P., Johnson J.K., Gorno-Tempini M.L., Rosen H., Prioleau-Latham C.E., Lee A., Kipps C.M., Lillo P., Piguet O., Rohrer J.D., Rossor M.N., Warren J.D., Fox N.C., Galasko D., Salmon D.P., Black S.E., Mesulam M. Sensitivity of revised diagnostic criteria for the behavioural variant of frontotemporal dementia. Brain. 2011;134(9):2456–2477. doi: 10.1093/brain/awr179. 21810890 [DOI] [PMC free article] [PubMed] [Google Scholar]
- Ridderinkhof K.R., Ullsperger M., Crone E.A., Nieuwenhuis S. The role of the medial frontal cortex in cognitive control. Science. 2004;306(5695):443–447. doi: 10.1126/science.1100301. 15486290 [DOI] [PubMed] [Google Scholar]
- Rosen A.C., Prull M.W., O'Hara R., Race E.A., Desmond J.E., Glover G.H., Yesavage J.A., Gabrieli J.D.E. Variable effects of aging on frontal lobe contributions to memory. Neuroreport. 2002;13(18):2425–2428. doi: 10.1097/00001756-200212200-00010. 12499842 [DOI] [PubMed] [Google Scholar]
- Rytty R., Nikkinen J., Paavola L., Abou Elseoud A., Moilanen V., Visuri A., Tervonen O., Renton A.E., Traynor B.J., Kiviniemi V., Remes A.M. Group ICA dual regression analysis of resting state networks in a behavioral variant of frontotemporal dementia. Front. Hum. Neurosci. 2013;7(August):461. doi: 10.3389/fnhum.2013.00461. [DOI] [PMC free article] [PubMed] [Google Scholar]
- Said C.P., Haxby J.V., Todorov A. Brain systems for assessing the affective value of faces. Philos. Trans. R. Soc. Lond., B, Biol. Sci. 2011;366(1571):1660–1670. doi: 10.1098/rstb.2010.0351. 21536552 [DOI] [PMC free article] [PubMed] [Google Scholar]
- Schölvinck M.L., Maier A., Ye F.Q., Duyn J.H., Leopold D.A. Neural basis of global resting-state fMRI activity. Proc. Natl. Acad. Sci. U. S. A. 2010;107(22):10238–10243. doi: 10.1073/pnas.0913110107. 20439733 [DOI] [PMC free article] [PubMed] [Google Scholar]
- Seeley W.W., Allman J.M., Carlin D.A., Crawford R.K., Macedo M.N., Greicius M.D., DeArmond S.J., Miller B.L. Divergent social functioning in behavioral variant frontotemporal dementia and Alzheimer disease: reciprocal networks and neuronal evolution. Alzheimer Dis. Assoc. Disord. 2007;21(4):S50–S57. doi: 10.1097/WAD.0b013e31815c0f14. 18090425 [DOI] [PubMed] [Google Scholar]
- Seeley W.W., Crawford R., Rascovsky K., Kramer J.H., Weiner M., Miller B.L., Gorno-Tempini M.L. Frontal paralimbic network atrophy in very mild behavioral variant frontotemporal dementia. Arch. Neurol. 2008;65(2):249–255. doi: 10.1001/archneurol.2007.38. 18268196 [DOI] [PMC free article] [PubMed] [Google Scholar]
- Seeley W.W., Crawford R.K., Zhou J., Miller B.L., Greicius M.D. Neurodegenerative diseases target large-scale human brain networks. Neuron. 2009;62(1):42–52. doi: 10.1016/j.neuron.2009.03.024. 19376066 [DOI] [PMC free article] [PubMed] [Google Scholar]
- Seeley W.W., Menon V., Schatzberg A.F., Keller J., Glover G.H., Kenna H.K., Reiss A.L., Greicius M.D. Dissociable intrinsic connectivity networks for salience processing and executive control. J. Neurosci. 2007;27(9):2349–2356. doi: 10.1523/JNEUROSCI.5587-06.2007. 17329432 [DOI] [PMC free article] [PubMed] [Google Scholar]
- Smith S.M., Beckmann C.F., Andersson J., Auerbach E.J., Bijsterbosch J., Douaud G., Duff E., Feinberg D.A., Griffanti L., Harms M.P., Kelly M., Laumann T., Miller K.L., Moeller S., Petersen S., Power J., Salimi-khorshidi G., Snyder A.Z., Vu A.T., Woolrich M.W., Xu J., Yacoub E., Uğurbil K., Van Essen D.C., Glasser M.F., WU-Minn HCP Consortium Resting-state fMRI in the human connectome project. NeuroImage. 2013;80:144–168. doi: 10.1016/j.neuroimage.2013.05.039. 23702415 [DOI] [PMC free article] [PubMed] [Google Scholar]
- Torralva T., Kipps C.M., Hodges J.R., Clark L., Bekinschtein T., Roca M., Calcagno M.L., Manes F. The relationship between affective decision-making and theory of mind in the frontal variant of fronto-temporal dementia. Neuropsychologia. 2007;45(2):342–349. doi: 10.1016/j.neuropsychologia.2006.05.031. 16893555 [DOI] [PubMed] [Google Scholar]
- Torralva T., Roca M., Gleichgerrcht E., Bekinschtein T., Manes F. A neuropsychological battery to detect specific executive and social cognitive impairments in early frontotemporal dementia. Brain. 2009;132(5):1299–1309. doi: 10.1093/brain/awp041. 19336463 [DOI] [PubMed] [Google Scholar]
- van de Riet W.A.C., Grèzes J., de Gelder B. Specific and common brain regions involved in the perception of faces and bodies and the representation of their emotional expressions. Soc. Neurosci. 2009;4(2):101–120. doi: 10.1080/17470910701865367. 19255912 [DOI] [PubMed] [Google Scholar]
- Warren J.D., Rohrer J.D., Schott J.M., Fox N.C., Hardy J., Rossor M.N. Molecular nexopathies: a new paradigm of neurodegenerative disease. Trends Neurosci. 2013;36(10):561–569. doi: 10.1016/j.tins.2013.06.007. 23876425 [DOI] [PMC free article] [PubMed] [Google Scholar]
- Whitwell J.L., Josephs K.A., Avula R., Tosakulwong N., Weigand S.D., Senjem M.L., Vemuri P., Jones D.T., Gunter J.L., Baker M., Wszolek Z.K., Knopman D.S., Rademakers R., Petersen R.C., Boeve B.F., Jack C.R. Altered functional connectivity in asymptomatic MAPT subjects: a comparison to bvFTD. Neurology. 2011;77(9):866–874. doi: 10.1212/WNL.0b013e31822c61f2. 21849646 [DOI] [PMC free article] [PubMed] [Google Scholar]
- Worsley K.J., Friston K.J. Analysis of fMRI time-series revisited — again. Neuroimage. 1995;2(3):173–181. doi: 10.1006/nimg.1995.1023. 9343600 [DOI] [PubMed] [Google Scholar]
- Zhou J., Greicius M.D., Gennatas E.D., Growdon M.E., Jang J.Y., Rabinovici G.D., Kramer J.H., Weiner M., Miller B.L., Seeley W.W. Divergent network connectivity changes in behavioural variant frontotemporal dementia and Alzheimer's disease. Brain. 2010;133(5):1352–1367. doi: 10.1093/brain/awq075. 20410145 [DOI] [PMC free article] [PubMed] [Google Scholar]
- Zhou J., Seeley W.W. Network dysfunction in Alzheimer's disease and frontotemporal dementia: implications for psychiatry. Biol. Psychiatry. 2014;75(7):565–573. doi: 10.1016/j.biopsych.2014.01.020. 24629669 [DOI] [PubMed] [Google Scholar]
- Zhou Y., Li S., Dunn J., Li H., Qin W., Zhu M., Rao L.-L., Song M., Yu C., Jiang T. The neural correlates of risk propensity in males and females using resting-state fMRI. Front. Behav. Neurosci. 2014;8:2. doi: 10.3389/fnbeh.2014.00002. 24478649 [DOI] [PMC free article] [PubMed] [Google Scholar]
- Zilbovicius M., Meresse I., Chabane N., Brunelle F., Samson Y., Boddaert N. Autism, the superior temporal sulcus and social perception. Trends Neurosci. 2006;29(7):359–366. doi: 10.1016/j.tins.2006.06.004. 16806505 [DOI] [PubMed] [Google Scholar]
Associated Data
This section collects any data citations, data availability statements, or supplementary materials included in this article.
Supplementary Materials
Anatomical localization of each network/component.
Correlation between experimental and nuisance predictors.
Supplementary material.