Abstract
Homogenous protein assays, despite the potential for mix-and-read workflows, have eluded widespread acceptance due to interferences in biological matrices and limited multiplexability. Here, we employ standard qPCR instrumentation for thermofluorimetric analysis of bivalent probe (TFAB) assemblies, allowing protein levels to be quantitatively translated into multiplexable DNA melting transitions within 30 min. As protein-bound bivalent probes are thermodynamically more stable than unbound probes, differential thermal analysis can remove background analytically, without physical separation. Using either antibody-oligonucleotides or aptamers as probes, TFAB is validated for protein quantification in buffer, human serum, and human plasma and for assaying hormone secretions from endocrine cells. The direct optical method exhibits superior scalability, allowing detection of only 1 amol of protein in microfluidic channels of 100 pL volume. Overall, we demonstrate TFAB as a robust and generalizable homogeneous protein assay with superior performance in biological matrices.

Dual-probe enzyme-linked immunosorbent assay (ELISA) is the most widely used immunoassay platform owing to its high sensitivity and selectivity. Nonetheless, complex workflow, high expense, and the large sample volumes still remain as hampering factors for even more widespread adoption. Modern variations on ELISA have seen success,1,2 yet these methods still require expensive instrumentation and consumables while retaining the same basic workflow developed more than 30 years ago.
On the basis of simple workflow, scalability, rapidity, and low cost, homogeneous protein assays3,4 hold promise for quantification of an arbitrary protein in real time over a wide concentration range, long sought-after qualities in bioanalysis.5 These also utilize pairs of probes that exploit target-dependent proximity for signal generation. However, to avoid autofluorescence in biological samples, readout usually requires instrumentation for either time-resolved fluorescence or chemiluminescence, both being nonstandard or specialized. One successful option is to translate protein amount into a nucleic acid reporter.6–8 This technique lends itself to multiplexability and high sensitivity, since nucleic acid output sequences can encode target identities and are amplifiable.
With heterogeneous assays (e.g., enzyme linked immunosorbent assay, ELISA), surface bound probe–target complexes can be washed for near complete removal of interferences by physical separation. In contrast, homogeneous assays often exhibit indistinguishable output from signal and background components. Thus, despite their high potential in bioanalysis, homogeneous assays are plagued by suboptimal signal-to-background ratios and interferences. Herein, we introduce an analytical tool that exploits thermofluorimetric analysis of bivalent probes (TFAB) for robust yet facile protein quantification. First, high signal is ensured by sample incubation with bivalent probes at low temperature, without regard for nonspecific background. A qPCR instrument, with capability to thermally scan samples during fluorescence readout, is leveraged to efficiently distinguish between protein-bound and unbound probes, without physical separation. Quantitative and multiplexed protein detection is demonstrated with TFAB; the method is shown to be functional in human serum, human plasma, and cell secretion samples and is miniaturized to the picoliter scale. On the basis of its success with bivalent antibody-oligonucleotide and aptamer probes, we expect that this TFAB methodology will be generally applicable for mix-and-read assays of a variety of protein analytes in the future.
RESULTS AND DISCUSSION
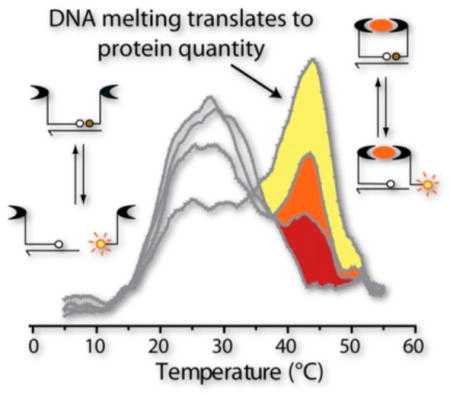
To enable readout of protein levels using DNA-based probe assemblies, target-driven probe proximity (referred to herein as “signal”) is assessed by quantifying the hybridization of oligonucleotide tails present on a paired bivalent probe at equilibrium. Target-independent DNA annealing (referred to as “background”) will be inevitable at equilibrium and will be indistinguishable from signal via isothermal readout. Figure 1A shows a schematic of signal and background complexes in TFAB, where complex assembly promotes fluorescence quenching. Rather than minimizing background, as in optimization studies of isothermal assays,6,9 a key aspect of TFAB is that both complexes (signal and background) are further stabilized by a longer DNA connector. This creates a noncovalent assembly that can serve as a bivalent probe, an advantage since multivalency is known to impart significantly higher affinity toward protein analytes through entropic stabilization.10,11 As shown in Figure 1B, thermofluorimetric analysis enables facile analytical separation of signal and background complexes in a homogeneous manner. It is noteworthy that there is a strong signal peak with 20 nM thrombin, even though the Kd values of the aptamers are higher at 26 and 128 nM,12 an effect of the enhanced stability of the bivalent probes.
Figure 1.
Thermofluorimetric assay with bivalent probes (TFAB). (A) Schematic of TFAB. (B) Fluorescence and dF/dT in the presence of 20 nM thrombin. dF/dT heat maps are also shown for (C) thrombin and (D) insulin TFABs with varying connector lengths. Blue arrows = background melting transitions; black arrows = signal melting transitions.
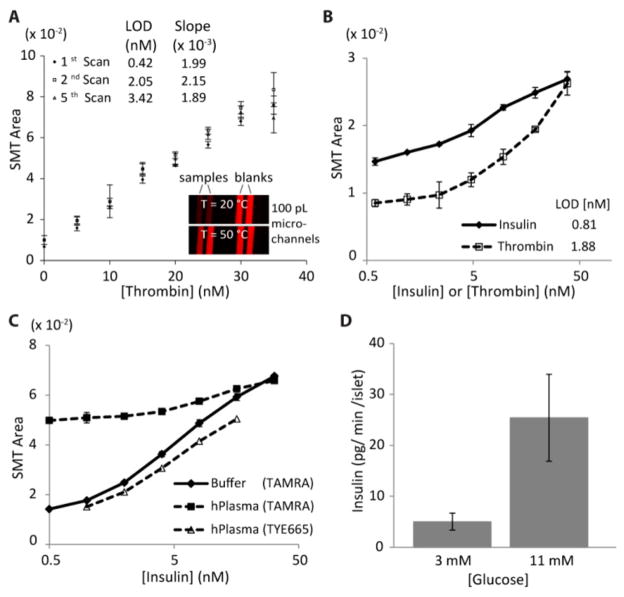
Since enthalpy-driven DNA hybridization is more temperature sensitive, DNA connectors were customized for tunable complex stability, as shown in heat maps in Figure 1C, D. The protein-dependent “proximity effect” is clearly observed in these dF/dT maps, with signal peaks located diagonally down and to the right compared to background. Even without exhaustive studies of complex formation, it is clear that these maps should be excellent tools for optimizing conditions of many DNA-driven proximity assays. For example, with the isothermal fluorescence proximity assay for thrombin detection at room temperature, C8–12 can be chosen as the optimal connector length, since background complexes are unstable yet signal complexes are stable at this temperature (Figure 1C, middle). With protein-dependent signal peaks clearly distinguishable from background peaks, we next demonstrate that signal peak area and height are proportional to protein quantity. The heat maps in Figure 1C, D show this effect clearly with increased intensity with protein concentration (see also Figure S-1). Through nonlinear least-squares fitting of the data to a sum of two Gaussian peaks, it was possible to deconvolute contributions of background and signal complexes. This postprocessing made it possible to extract true, protein-driven signal from total output and to essentially reduce background contributions to zero. In Figure 2A, deconvoluted signal melt transition (SMT) areas are plotted as a function of thrombin concentration in buffer. To confirm protein and probe stability during TFAB, the temperature was repeatedly scanned above and below the signal melting transition. The data shows that assay sensitivity was maintained through at least five scans. Slight increases in the limit of detection (LOD) suggest mild thermal degradation, but these effects were minimal. Notably, the LOD in scan 1 was subnanomolar, at 0.42 nM. Since it relies merely on direct fluorescence readout in solution (without any immobilized materials like beads), the assay also shows superior scalability through successful assaying of only 1 amol of thrombin in 100 pL microchannels (Figure 2A inset, Figure S-2). TFAB was then proven functional for direct fluorescence readout in 10-fold diluted human serum (Figure 2B). While isothermal versions of the same assay are nonresponsive in serum due to autofluorescence interferences (Figure S-3), TFAB is capable of analytically separating signal melt transitions from slowly varying autofluorescence background. Control over DNA connector sequences also allows multiplexed protein detection; insulin and thrombin were simultaneously quantified in serum with LODs of 0.81 and 1.88 nM (Figure 2B), without compromising performance from the respective singleplex assay (Figure S-4). The assay is functional in even more complex human plasma samples, where near complete recovery of sensitivity is possible using a red fluorescent tag (Figure 2C). Finally, we demonstrate that TFAB is useful for hormone secretion quantification from murine pancreatic islets in cell media (Figure 2D), where release of insulin is quantified from only 7 islets under physiologically relevant glucose concentrations. This application could find use in screening of islet function for transplantation or more generally for drug screening applications with various cell types.
Figure 2.
Performance of TFAB. (A) SMT peak area was proportional to protein concentration, and repeated thermal scanning confirmed protein stability. Inset image shows microfluidic TFAB in 100 pL channels. (B) Duplex TFAB for insulin and thrombin quantification in 10-fold diluted human serum. (C) Insulin TFAB in 10-fold diluted human plasma (filtered); longer wavelength fluorescence emission (TYE665) was shown to reduce autofluorescence effects as well. (D) Insulin TFAB in cell media. 1 h of insulin secretion is directly quantified from only 7 murine pancreatic islets at low and high glucose.
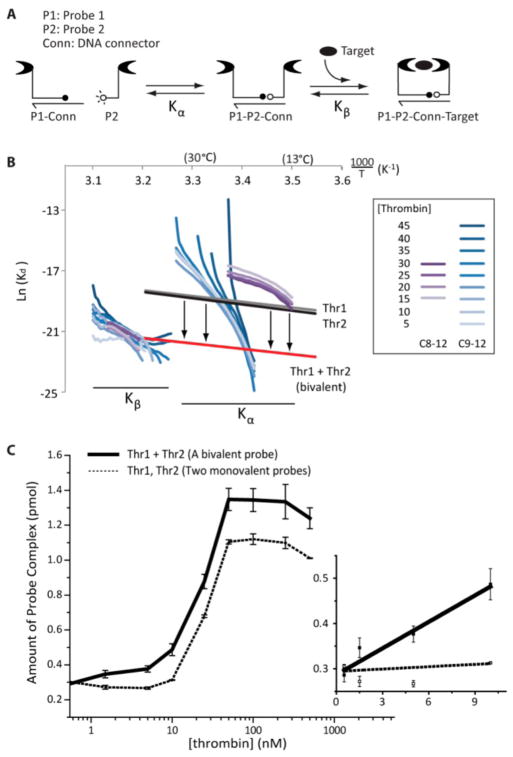
To confirm our hypotheses and improve our understanding of the TFAB mechanism, a model was devised (Figure 3A). To simplify the analytical solution of the model, we decoupled the background melting transition, represented by a dissociation constant, Kα, from the signal melting transition with a characteristic dissociation constant, Kβ. Further details on this model are included in Figure S-5. The thrombin TFAB data was processed with these model assumptions, giving the Van’t Hoff plot presented in Figure 3B. Blue traces represent melting transitions of signal (Kβ) and background (Kα) complexes using a longer connector oligo (C9–12), while purple traces show similar data collected with a shorter connector (C8–12). Despite its simplicity, this model impressively recapitulated the effects of probe bivalency. While protein-independent DNA melting transitions (labeled with Kα) showed an obvious dependence on connector hybridization energy (blue and purple traces well-separated), the protein-dependent signal melting transitions (Kβ) were independent of connector length (overlapping traces). Published thermodynamic parameters11 from individual thrombin aptamers (Thr1, Thr2; gray and black traces) and the covalently linked, bivalent aptamer (Thr1 + Thr2; red trace) were also added to Figure 3B. Remarkably, the temperature dependent trace from the covalently linked bivalent aptamer (red) closely overlapped with data from our bivalent TFAB probe (blue and purple traces; Kβ transition). This correlation confirmed that measured signal transitions in TFAB were dominated by our predesigned DNA melting events and helped to confirm our mechanistic assertions in Figure 1.
Figure 3.
Modeling and exploitation of bivalency in TFAB. (A) The TFAB model consisted of two consecutive binding events that were decoupled, represented by Kα and Kβ. (B) A Van’t Hoff plot showing thrombin TFAB processed through the model system. (C) Comparison of novel isothermal bivalent assay (solid line) with its monovalent counterpart (dotted line) showed an order-of-magnitude improvement in dynamic range with bivalent probes.
Finally, with this enhanced understanding, we created an isothermal mimic of TFAB that again leveraged probe bivalency for maximizing signal and removing background. In stepwise fashion, we (1) further stabilized the bivalent probe with a longer DNA connector at room temperature, (2) added protein analyte, and (3) destabilized the complexes by enzymatically shortening the connector. This way, we reasoned that protein-stabilized signal complexes would remain intact while the background complexes would melt. To achieve selective destabilization of the connector/probe hybridization, we strategically placed cleavable deoxyuridines (dU) into the connector oligonucleotide. A long connector (C15–15) could thus be digested into a shorter connector (C8–12) through enzymatic cleavage of dUs with Uracil-DNA Excision Mix. A schematic of this assay is given in Figure S-6 alongside kinetic characterization of the cleavage reaction. Figure 3C compares this isothermal bivalent assay and its monovalent counterpart. Indeed, the bivalent assay exhibited higher total amounts of signal complexes at all protein concentrations as well as higher sensitivity at low protein concentrations (<10 nM).
CONCLUSIONS
In conclusion, we have introduced the thermofluorimetric assay with bivalent probes (TFAB), methodology that addresses an unmet need in the bioanalytical realm. Although TFAB employs simple, direct-readout fluorescence optics, thermal analysis permits analytical removal of background, including autofluorescence in biological matrices. It is expected that optical systems used in high-resolution melting analysis will permit further enhancements in both thermal control and fluorescence detection sensitivity. Additionally, a greater number of fluorescent labels with higher quantum yield may improve the system several fold, assuming that probe self-quenching is avoided. Overall, these results and the coincident potential for improvement suggest that TFAB is a valuable new protein assay platform, bearing a host of advantages: robustness, speed, cost-effectiveness, multiplexing capability, scalability, versatility of readout, and a mix-and-read workflow.
Supplementary Material
Acknowledgments
Funding for this work was provided by the National Science Foundation, CBET-1403495 (C.J.E.), and the National Institutes of Health, R01 DK093810 (C.J.E.). The authors would like to thank Prof. Steven Mansoorabadi for helpful discussions on assay modeling. Further thanks go to Prof. Dawn Boothe at the Auburn University Department of Anatomy, Physiology and Pharmacology for use of qPCR instrumentation and to Prof. Michael W. Greene at the Auburn University Department of Nutrition, Dietetics, and Hospitality Management for providing the mouse serum used as background matrix in assay optimization studies.
Footnotes
Notes
The authors declare the following competing financial interest(s): Authors J.K., J.H., M.D.H., and C.J.E. are co-authors on an invention disclosure related to portions of the work reported herein.
The Supporting Information is available free of charge on the ACS Publications website at DOI: 10.1021/acs.anal-chem.5b03432.
Experimental details and supporting figures and tables (PDF)
References
- 1.Fulton RJ, McDade RL, Smith PL, Kienker LJ, Kettman JR., Jr Clin Chem. 1997;43:1749–1756. [PubMed] [Google Scholar]
- 2.Rissin DM, Kan CW, Campbell TG, Howes SC, Fournier DR, Song L, Piech T, Patel PP, Chang L, Rivnak AJ, Ferrell EP, Randall JD, Provuncher GK, Walt DR, Duffy DC. Nat Biotechnol. 2010;28:595–599. doi: 10.1038/nbt.1641. [DOI] [PMC free article] [PubMed] [Google Scholar]
- 3.Mathis G. Clin Chem. 1993;39:1953–1959. [PubMed] [Google Scholar]
- 4.Ullman EF, Kirakossian H, Singh S, Wu ZP, Irvin BR, Pease JS, Switchenko AC, Irvine JD, Dafforn A, Skold CN, et al. Proc Natl Acad Sci U S A. 1994;91:5426–5430. doi: 10.1073/pnas.91.12.5426. [DOI] [PMC free article] [PubMed] [Google Scholar]
- 5.Plaxco KW, Soh HT. Trends Biotechnol. 2011;29:1–5. doi: 10.1016/j.tibtech.2010.10.005. [DOI] [PMC free article] [PubMed] [Google Scholar]
- 6.Fredriksson S, Gullberg M, Jarvius J, Olsson C, Pietras K, Gustafsdottir SM, Ostman A, Landegren U. Nat Biotechnol. 2002;20:473–477. doi: 10.1038/nbt0502-473. [DOI] [PubMed] [Google Scholar]
- 7.Heyduk E, Dummit B, Chang YH, Heyduk T. Anal Chem. 2008;80:5152–5159. doi: 10.1021/ac8004154. [DOI] [PMC free article] [PubMed] [Google Scholar]
- 8.Zhang H, Li F, Dever B, Wang C, Li XF, Le XC. Angew Chem, Int Ed. 2013;52:10698–10705. doi: 10.1002/anie.201210022. [DOI] [PubMed] [Google Scholar]
- 9.Kim J, Hu J, Sollie RS, Easley CJ. Anal Chem. 2010;82:6976–6982. doi: 10.1021/ac101762m. [DOI] [PubMed] [Google Scholar]
- 10.Kim Y, Cao Z, Tan W. Proc Natl Acad Sci U S A. 2008;105:5664–5669. doi: 10.1073/pnas.0711803105. [DOI] [PMC free article] [PubMed] [Google Scholar]
- 11.Rakhmetova S, Radko SP, Gnedenko OV, Bodoev NV, Ivanov AS, Archakov AI. Biomed Khim. 2010;56:72–81. doi: 10.18097/pbmc20105601072. [DOI] [PubMed] [Google Scholar]
- 12.Hu J, Easley CJ. Analyst. 2011;136:3461–3468. doi: 10.1039/c0an00842g. [DOI] [PubMed] [Google Scholar]
Associated Data
This section collects any data citations, data availability statements, or supplementary materials included in this article.


