

Abstract
The formation of the vascular network requires a tightly controlled balance of pro-angiogenic and stabilizing signals. Perturbation of this balance can result in dysregulated blood vessel morphogenesis and drive pathologies including cancer. Here, we have identified a novel gene, ARHGAP18, as an endogenous negative regulator of angiogenesis, limiting pro-angiogenic signaling and promoting vascular stability. Loss of ARHGAP18 promotes EC hypersprouting during zebrafish and murine retinal vessel development and enhances tumor vascularization and growth. Endogenous ARHGAP18 acts specifically on RhoC and relocalizes to the angiogenic and destabilized EC junctions in a ROCK dependent manner, where it is important in reaffirming stable EC junctions and suppressing tip cell behavior, at least partially through regulation of tip cell genes, Dll4, Flk-1 and Flt-4. These findings highlight ARHGAP18 as a specific RhoGAP to fine tune vascular morphogenesis, limiting tip cell formation and promoting junctional integrity to stabilize the angiogenic architecture.
Keywords: angiogenesis, cell junctions, ARHGAP18, SENEX, sprouting
Abbreviations
- AJ
Adherens junctions
- DLL4
Delta-like ligand 4
- EC
Endothelial cell
- GAP
GTPase activating protein
- GDI
Guanine nucleotide dissociation inhibitor
- GEF
Guanine nucleotide exchange factor
- hpf
Hours post fertilization
- HUVEC
Human umbilical vein endothelial cell
- ISV
Intersegmental vessel
- MO
Morpholino
- SC
Stalk cell
- Sp
Splice
- TC
Tip cell
- Tr
Translational
- WT
Wildtype
Introduction
The vascular network expands predominantly through angiogenesis, the formation of new blood vessels from pre-existing vessels.1 Angiogenesis involves a series of processes including sprouting and proliferation of endothelial cells (EC), and vessel anastamatosis, maturation and remodeling and requires a tight coordination of positive and negative signals.1,2 Importantly, dysregulation of angiogenesis contributes to pathologies such as cancer2,3 and ischemic diseases.4-6
The cellular and molecular mechanisms inducing sprouting angiogenesis in response to guidance cues, such as vascular endothelial growth factor (VEGF), are quite well understood and have been comprehensively reviewed.1,2,7 EC first loosen the cell-cell contacts then the leading tip cell (TC) migrates and extends filopodia toward the growth factor gradient while supported by the trailing stalk cell (SC) in a process regulated by VEGF-Notch-Delta-like ligand 4 (Dll4) signaling.8-10 Recently, it has been shown that these TC and SC phenotypes are in fact transient states and the cells are constantly reshuffling positions.9,11 Dynamic transitioning of TC and SC fates and positions is essential for effective patterning and expansion of the vascular network and is dependent on differential Dll4 expression and reorganization of the cell-cell junctions.2,9,11 Under physiological conditions, the angiogenic response is tightly controlled suggesting the existence of negative regulators that limit or restrict tip cell formation.
The Rho family of GTPases consists of 20 different members that each regulate different aspects of the actin-myosin cytoskeleton, including the cell-cell adherens junctions (AJ) (RhoA, RhoC), lamellipodia (Rac1) and filopodia (Cdc42).12 Coordinated spatiotemporal activation of RhoGTPases by signals, such as VEGF and integrins, is required to control processes including cell-cell attachment, migration, and proliferation, all of which are important in angiogenesis.13 Regulation of RhoGTPase activation is mediated by interaction with 3 sets of proteins: guanine nucleotide exchange factors (GEFs), GTPase-activating proteins (GAPs), and guanine nucleotide-dissociation inhibitors (GDIs), which respectively regulate its activation, inactivation and sequestration.12 Importantly, aberrant Rho signaling is associated with many pathologies, including cancer and vascular diseases, and is thought to be a promising target for novel therapies.14-18 However, the RhoGTPases, unlike the Ras superfamily counterparts, are rarely mutated in cancers.15,18 Instead, RhoGTPases are aberrantly activated by other mechanisms, including constitutively active splice variants of RhoGTPases, altered localization mediated by GDIs, and altered expression and function of the regulatory GEF and GAP proteins.18,19 One such RhoGAP is DLC-1, a tumor suppressor that is frequently mutated and lost in liver, breast and many other cancers.20-22 Loss of DLC-1 results in RhoA hyperactivation that drives tumorigenesis20 and therefore highlights the importance of Rho signaling and regulatory RhoGAP proteins in disease.
We previously identified a novel RhoGAP, ARHGAP18 (alias SENEX), in a microarray screen of genes regulated during in vitro tube formation, as a model of angiogenesis.23,24 Relative to other RhoGAPs, ARHGAP18 is highly expressed in EC.25 More importantly, ARHGAP18 was found to be downregulated in the early migration phase and upregulated in the later stabilization phase of tube formation. Consistent with this, knockdown of ARHGAP18 resulted in the inability to form stable tubes.23 Interestingly, overexpression of ARHGAP18 in EC results in the induction of premature senescence, although this is through a GAP-independent mechanism,23 but dependent on caveolae formation (Powter et al., in press). Here, we describe ARHGAP18 as a novel negative regulator of sprouting by acting dualistically to limit TC formation and to maintain junctional integrity.
Results
Knockdown of ARHGAP18 promotes EC migration and sprouting
Gene silencing was performed to determine the effect of ARHGAP18 on EC function. ARHGAP18 exists as 2 isoforms, with the smaller isoform originating from a downstream start codon.23,26 Knockdown of ARHGAP18 with siRNAs resulted in the reduced expression of both isoforms (Fig. S1A). Maeda et al. previously reported that silencing of ARHGAP18 in epithelial cell lines induces a contracted phenotype with reduced spreading and pronounced stress fibers and focal adhesions.26 Silencing of ARHGAP18 with the different siRNAs in EC did not result in gross morphological changes with the exception of siRNA-2, where significant cell elongation (Fig. S1B) was observed. Interestingly, this was the siRNA used in the Maeda et al. study. Because of this gross change in EC morphology, all subsequent gene silencing experiments were performed using a combination of siRNA-1 and siRNA-3, and routinely resulted in ∼90% knockdown (Fig. S1C).
In an in vitro wound healing assay, control knockdown EC had migrated predominantly as a uniform front within the first 5 h (Fig. 1A). In contrast, ARHGAP18 knockdown resulted in a irregular and protruded migratory front and an overall 16% increase in wound recovery at this early time point (Fig. 1A and B). Notably, while the protrusive lamellipodium were unchanged, the proximal edge of the leading cell at the migratory front had disrupted cell-cell junctions (Fig. 1C). The increased migratory phenotype was also observed in a 3D spheroid sprouting assay although with a more pronounced effect. Knockdown of ARHGAP18 resulted in a significant increase in both the number of sprouts and the cumulative sprout length of the spheroids (Fig. 1D-F). We confirmed this using individual siRNAs targeting ARHGAP18, whereby knockdown of ARHGAP18 by each of these siRNAs resulted in a hypersprouting phenotype compared to control (Fig. S1D). In contrast, ARHGAP18 knockdown had no effect on cell proliferation (Fig. S1E).
Figure 1.

Knockdown of ARHGAP18 promotes migration and spheroid sprouting in vitro and Zebrafish ISV sprouting. (A-C) 2D scratch wound assay. (A) Representative brightfield images of the scratch wounds at 0 h and 5 h from Ctrl and ARHGAP18 knockdown EC. ARHGAP18 knockdown EC migrate in a relatively irregular fashion compared to the uniform migration in the ctrl EC. Bar 200 μm. (B) Quantification of wound recovery. Data represents mean ± SEM. *, P < 0.05, n = 5 independent experiments, paired t-test. (C) High magnification of the wound front following 5 h scratch wounding. ARHGAP18 knockdown EC at the migratory front have disrupted proximal cell-cell junctions (arrows). Bar 20 μm. (D-F). Spheroid sprouting assay. (D) Representative brightfield images of Ctrl and ARHGAP18 knockdown spheroid sprouts following 20 h VEGF (25 ng/mL) stimulation. Bar 100 μm. Quantification of (E) the number of sprouts per spheroid and (F) cumulative sprout length. Data represents mean ± SEM. **, P < 0.01, n = 4 independent experiments, paired t-test. (G) Representative images of zebrafish embryos injected with control MO, ARHGAP18 SpMO or TrMO or uninjected at 48 hpf. Arrows indicate the observable hindbrain, yolk and heart edema. Bar 500 μm. (H) Representative GFP confocal images of intersegmental vessels (ISV) in fli1-GFP zebrafish embryos injected with control, ARHGAP18 SpMO or ARHGAP18 TrMO at 24 hpf. ISV from ARHGAP18 MO injected zebrafish embryos have increased length and filopodial extensions. Red = dorsal aorta (DA) diameter, blue = posterior cardinal vein (PCV) diameter. Bar 100 μm. (I) Quantification of ISV lengths. Data represents mean ± SEM. *, P < 0.05; ***, P < 0.001, n = 134 control, 306 SpMO, 105 TrMO ISV, unpaired t-test.
Knockdown of ARHGAP18 promotes angiogenic sprouting in zebrafish embryos
Gene silencing of ARHGAP18 in zebrafish embryos supported the hypersprouting phenotype seen in vitro. A translational (Tr)- and a splice (Sp)-mediated morpholino (MO) targeting ARHGAP18 were used. Injection of the SpMO resulted in retention of intron 3 in the mRNA (Fig. S2A) thus confirming the efficacy of the injection and the morpholino. Both injection of the ARHGAP18 TrMO and SpMO resulted in gross hindbrain, pericardial and yolk edema (Fig. 1G). We showed that this was not due to non-specific apoptotic effects induced by the MO by the absence of TUNEL staining in injected embryos (Fig. S2B). At 24 hours post fertilization (hpf), both the ARHGAP18 TrMO and SpMO resulted in a significant increase in intersegmental vessel (ISV) lengths compared to control morphants (Fig. 1H and I). The sprouting EC also had increased filopodial extensions further confirming the hypersprouting phenotype. We also observed that the lumen diameter of the dorsal aorta (DA) at 24 hpf was noticeably reduced in the SpMO and trending in the TrMO (P = 0.09), whereas the lumen diameter of the posterior cardinal vein (PCV) in both MO remained unchanged (Fig. S2C and D). ARHGAP18 knockdown had no effect on the development of lymphatic vessels (Fig. S2E and F) thus suggesting that the phenotype is vascular specific.
ARHGAP18−/− mice have increased aortic ring sprouting and altered retinal vasculature development
To determine whether ARHGAP18 is important for mammalian vascular development we generated a global knockout mouse using the KOMP repository. The mice are phenotypically normal and display no changes in rate of pregnancy or litter size. Immunoblotting of mouse lung lysates confirmed the absence of ARHGAP18 in the knockout mouse (Fig. 2A). The endothelial protein, VE-cadherin, was used as a loading control for the lung endothelium, confirming the absence of ARHGAP18 in the endothelial population. Using an ex vivo aortic ring assay, loss of ARHGAP18 resulted in a hypersprouting phenotype, with earlier onset and increased expansion of the sprouts (Fig. 2B and C). Strikingly, while wildtype (WT) cells formed mainly linear sprouts, the EC from the ARHGAP18−/− mice had an increased propensity to form branches (Fig. 2B iii, iv).
Figure 2.

ARHGAP18−/− mice have increased aortic ring sprouting and post-natal retinal angiogenesis. (A) Western blot of mouse lung lysates from WT and ARHGAP18−/− mice blotted for ARHGAP18, and the loading controls VE-cadherin and actin. (B-C) ex vivo aortic ring assay. (B) Representative brightfield images of aortic rings embedded in Matrigel at low magnification (i and ii) and high magnification (iii and iv) showing extensive branching in the ARHGAP18−/− rings. Red outline = sprouted area, yellow outline = aortic ring area. Bar (i) 500 μm, (iii) 100 μm. (C) Quantification of the sprouted area. Data represents mean ± SEM. *, P < 0.05, n = 7 independent experiments, paired t-test. (D and E) Radial extension. (D) Representative fluorescence images of WT and ARHGAP18−/− P6 retinas stained for isolectin B4. Yellow dotted circle = radial extension in WT. Bar 1 mm. (E) Quantification of radial extension. Data represents mean ± SEM. ****, P < 0.0001, n = 32 WT and 24 ARHGAP18−/− mice, unpaired t-test. (F-H) Quadrant Plexus. (F) Representative confocal quadrant plexus images of WT and ARHGAP18−/− P6 retinas stained for isolectin B4. The analyzed plexus area is indicated by the red box. Bar 250 μm. Quantification of the (G) vessel density and (H) number of branch points per plexus field. Data represents mean ± SEM. *, P < 0.05; **, P < 0.01, n = 32 WT and 24 ARHGAP18−/− mice, unpaired t-test. (I and J) Sprouts. (I) Representative confocal angiogenic front images of WT and ARHGAP18−/− P6 retinas stained for isolectin B4. Sprouts are indicated by the red dot. Bar 200 μm. (J) Quantification of sprouts per mm of vessel length. Data represents mean ± SEM. ****, P < 0.0001, n = 32 WT and 24 ARHGAP18−/− mice, unpaired t-test.
Retinal vascularization occurs post-natally and begins with sprouting angiogenesis and radial expansion of the superficial layer followed by remodeling of the vascular plexus and invasion into the deeper retinal layers.27 The adult retina of the ARHGAP18−/− mice did not show any major defects (unpublished data). In P6 mice, we observed a significant (10%) decrease in radial extension in ARHGAP18−/− mice (Fig. 2D and E). This was coupled with significant increases in vessel density (6%) and the number of branch points (13%) in the plexus field, defined as between an artery and vein (Fig. 2F-H). Furthermore, ARHGAP18 deletion resulted in an increase (23%) in the formation of sprouts/tip cells (Fig. 2I and J), consistent with the aortic ring phenotype (Fig. 2B).
Loss of ARHGAP18 promotes VEGF hyper-responsiveness and a TC phenotype
The in vitro and in vivo observations indicated that the loss of ARHGAP18 promotes hypersprouting and TC-like behavior. To determine whether this was due to hyper-responsiveness to VEGF, the activation of downstream MAPK/ERK and Akt pathways were assessed. While ARHGAP18 knockdown EC displayed a similar response in ERK activation, there was higher maximal and prolonged activation of Akt (Fig. 3A). TC initiate sprouting angiogenesis in response to guidance cues by migrating and extending filopodial extensions2 and are characterized by an upregulation of genes including Pdgfb, Dll4, Unc5b, Flk1, and Flt4.28 Knockdown of ARHGAP18 was confirmed (Fig. 3B) and resulted in an increase in the mRNA levels of Dll4 (Fig. 3C), Flk1 (Fig. 3D) and Flt4 (Fig. 3E), but not the inhibitory VEGF receptor gene Flt1 (Fig. 3F). To determine whether this translates to a preference for the TC position, a chimeric spheroid sprouting assay was performed using a 1:1 mix of labeled control and ARHGAP18 knockdown cells. ARHGAP18 knockdown cells showed significantly greater preference for sprouts and the TC position (Fig. 3G-I) confirming that loss of ARHGAP18 promotes a TC phenotype.
Figure 3.

ARHGAP18 knockdown promotes Akt activation, expression of TC genes and TC preference. (A) HUVEC transfected with ctrl or ARHGAP18 siRNAs were starved, stimulated with VEGF (50 ng/mL) and whole cell lysates collected at the indicated time points. Western blot of lysates for p-Akt, total Akt, p-ERK1/2, ARHGAP18 and the loading control tubulin. Representative blots of 3 independent experiments. (B-F) mRNA expression of tip cell genes. HUVEC transfected with ctrl (□) or ARHGAP18 (▪) siRNAs were starved, stimulated with or without VEGF (50 ng/mL) for 6 h. Total RNA was isolated, reverse transcribed and the mRNA level of (B) ARHGAP18, (C) Dll4, (D) Flk1, (E) Flt4 and (F) Flk1 relative to the normalizing gene ACTB determined by quantitative PCR. Data represents mean ± SEM. *, P < 0.05; **, P < 0.01; ns, non-significant; n = 3–4 independent experiments, paired t-test. (G-I). Tip cell preference. (G) HUVEC were transfected with ctrl or ARHGAP18 siRNAs and stained with CellTracker Red or Green dyes, respectively, and nuclei counterstained with Hoescht 33342 (blue). Spheroids were established with 1:1 sictrl and siARHGAP18 EC and stimulated with VEGF (25 ng/mL) for 24 h and imaged by confocal. Bar 100 μm. (H) Quantification of the percentage contribution of sictrl (red) and siARHGAP18 (green) cells in (H) sprouts and in (I) the TC position. **, P < 0.01; ****, P < 0.001; n = 4 independent experiments, unpaired t-test.
ARHGAP18 is localized to angiogenic EC junctions
The localization of ARHGAP18 was next assessed using a monoclonal antibody raised against ARHGAP18 peptide. The specificity of the antibody staining was confirmed by the markedly reduced staining in the ARHGAP18 knockdown EC (Fig. S3A) and absence of staining in ARHGAP18−/− retinas (Fig. S3D, compared to Fig. 4C and Fig. S3C). In monolayers of normal EC, ARHGAP18 is abundantly expressed and predominantly cytosolic (Fig. 4A). However, ARHGAP18 was localized to the junctional areas in spheroid sprouts stimulated by VEGF (Fig. S3B) or FGF-2 (Fig. 4B). In the mouse retina, we observed highest expression of ARHGAP18 in the EC, but could also see expression in the retinal axons and astrocytes (Fig. S3C). We also observed differential expression of ARHGAP18 among the different vessel subtypes with higher expression of ARHGAP18 in the arteries and angiogenic front compared to the veins. Importantly, we observed abundant expression of ARHGAP18 in the VE-cadherin expressing EC junctions (Fig. 4C) that was more predominant in EC in the capillary network and close to the angiogenic front in comparison to the larger arterial and venous vessels (Fig. S3C).
Figure 4.

ARHGAP18 localizes to EC junctions during angiogenesis. (A) Confocal images of monolayer HUVEC stained for ARHGAP18 (green) and β-cateninin (red) and nuclei counterstained with DAPI (blue). ARHGAP18 has predominantly cytosolic localization and is absent from the EC junctions. Bar 25 μm. (B) Confocal images of 48 h FGF-2 (25 ng/mL)-stimulated spheroid sprouts fixed and stained for ARHGAP18 (red) and PECAM-1 (green) and nuclei counterstained with DAPI (blue). ARHGAP18 colocalizes with the EC junctions as indicated by the arrows. Bar 50 μm. (C) Confocal images of capillary EC from WT P6 retinas fixed and stained for ARHGAP18 (red) and VE-cadherin (green). ARHGAP18 colocalized with the EC junctions as indicated by the arrows. Bar, main 50 μm, inset 10 μm.
The above results suggested that the localization of ARHGAP18 might be regulated differently in vessels of different stability. To investigate this possibility we assessed the localization of ARHGAP18 in EC monolayers stimulated with thrombin, where junctions are dynamically remodeled over 60 min29 (Fig. 5A). ARHGAP18 translocated from the cytosol to the fine filopodial extensions within 2 min of thrombin stimulation. At 10 min, a time where the junctions are disrupted (also termed active) and the monolayer is highly permeable,30 ARHGAP18 was distinctly localized to junctional edges of cell contacts. By 60 min however, where the junctions are straight and mature (also termed inactive), ARHGAP18 was absent from the junctional edges and returned to the cytosol. Thrombin signals via Rho/ROCK to disrupt cell-cell junctions and induce cell contraction.31 Pretreatment with the ROCK inhibitor, Y27632, inhibited thrombin-induced stress fiber formation and junctional disruption (Fig. 5B) and prevented thombin-induced ARHGAP18 relocalisation to the EC junctions (Fig. 5C).
Figure 5.

ARHGAP18 relocalizes to the junctions of EC monolayers following thrombin destabilization in a ROCK-dependent manner. (A) Confocal images of monolayer HUVEC stained for ARHGAP18 (green), β-catenin (red) and nuclei counterstained with DAPI following stimulation with thrombin (1 U/mL) for indicated times. ARHGAP18 relocalizes to the retracting EC extensions at 2 min, to the EC junctional periphery at 10 min and returns to the cytosol at 60 min following thrombin stimulation. Bar 25 μm. (B) Confirmation of ROCK inhibitor efficiency. HUVEC were pre-treated with or without 2.5 μM Y27632 for 30 min, stimulated with thrombin for 30 min or left untreated and stained for VE-cadherin (green), F-actin (red), and nuclei counterstained with DAPI (blue) and imaged by confocal. ROCK inhibition prevented thrombin-induced stress fibers and junctional disruption. Bar 25 μm. (C) ARHGAP18 relocalization to the junctional periphery is dependent on ROCK activity. HUVEC were pre-treated with or without 2.5 μM Y27632 for 30 min, stimulated with thrombin for 10 min or left untreated and stained for ARHGAP18 (green), and nuclei counterstained with DAPI (blue) and imaged by confocal. ROCK inhibition prevented ARHGAP18 translocation to the EC junctions. Bar 25 μm.
ARHGAP18 is a RhoC GAP and promotes junctional integrity
Active RhoGTPases localize at the cell membrane and are inactivated by recruitment of RhoGAPs.12 We next assessed whether ARHGAP18 inhibts RhoGTPase activation by examining the levels of active RhoGTPases in basal and thrombin-stimulated control or ARHGAP18 knockdown EC. Surprisingly, knockdown of ARHGAP18 in EC did not alter RhoA activation (Fig. 6A), which has been previously reported in epithelial cell lines.26 ARHGAP18 silencing also did not alter Rac-1 (lamellipodia), Cdc42 (filopodia), or RhoJ, the EC-specific RhoGTPase (Fig. S4A-C). However, ARHGAP18 knockdown did have a small but reproducible and significant effect on RhoC activation in both basal and thrombin stimulated EC (Fig. 6B). To confirm this, we show that overexpression of ARHGAP18 did not alter RhoA activation (Fig. 6C), but significantly reduced RhoC activation (Fig. 6D). Confirmation of ARHGAP18 overexpression is shown in Figure S4D. Consistent with RhoC regulating cell contractility and junctional stability, ARHGAP18 knockdown in EC displayed an increased amount of stress fibers (Fig. 6E, yellow arrows) and had more open zipper-like VE-cadherin staining at the cell junctions (Fig. 6E, red arrows and Fig. S3A), which is characteristic of weak remodeling junctions.32,33 Furthermore, the post-natal retinal capillaries of the ARHGAP18−/− mouse also displayed more serrated staining of VE-cadherin at the EC junctions compared to the WT mouse (Fig. 6F). Consistent with this junctional phenotype, ARHGAP18 knockdown EC displayed increased basal and thrombin-induced FITC-dextran permeability (Fig. 6G). To validate that this contractile junctional phenotype was mediated through RhoC hyperactivation and not the previously reported RhoA, we assessed whether this phenotype could be rescued by the knockdown of RhoC. EC were transfected with ARHGAP18 siRNAs followed by RhoA or RhoC siRNAs and the knockdown of each protein confirmed (Fig. S4E). While ARHGAP18 knockdown in combination with control or RhoA siRNAs resulted in the typical contractile phenotype, knockdown of RhoC resulted in a more stable phenotype, with less serrated staining of VE-cadherin staining at the junctions and more cortical localization of F-actin that resembles the non-ARHGAP18 knockdown EC (Fig. 6H).
Figure 6.

ARHGAP18 is a RhoC GAP that regulates EC junctional integrity. (A and B) ARHGAP18 silencing promotes RhoC activation. HUVEC transfected with ctrl (□) or ARHGAP18 (▪) siRNAs were starved, stimulated with or without thrombin (1 U/mL), and lysed. (A) RhoA and (B) RhoC activation were determined by GLISA. Data represents mean ± SEM. *, P < 0.05; n = 5 independent experiments, paired t-test. (C and D) ARHGAP18 overexpression reduces RhoC activation. HUVEC transduced with empty vector (AdEV) (□) or ARHGAP18 (▪) adenoviruses were starved, stimulated with or without thrombin (1 U/mL), and lysed. (C) RhoA and (D) RhoC activation were determined by GLISA. Data represents mean ± SEM. *, P < 0.05; n = 3 independent experiments, paired t-test. (E) ARHGAP18 silencing induces stress fiber formation and junctional disruption in vitro. Confocal images of HUVEC transfected with ctrl or ARHGAP18 siRNAs and stained for VE-cadherin (green) and F-actin (red) and nuclei counterstained with DAPI (blue). Relative to ctrl, ARHGAP18 knockdown EC display more pronounced stress fibers (yellow arrows) and zippered appearance of VE-cadherin (red arrows). Bar 25 μm. (F) Loss of ARHGAP18 alters junctional VE-cadherin distribution in retinal capillary EC. Confocal images of retinal capillary EC from P6 WT and ARHGAP18−/− retinas fixed and stained for VE-cadherin. Relative to the tight distribution of VE-cadherin at the WT EC junctions, ARHGAP18 loss resulted in more diffuse distribution of VE-cadherin (red arrows). Bar 10 μm. (G) ARHGAP18 silencing promotes basal and thrombin-induced vascular leak. HUVEC were transfected with ctrl (□) or ARHGAP18 (▪) siRNAs, seeded on transwells and stimulated with or without thrombin (0.3 U/mL) in the presence of 2 μg FITC-dextran. The FITC-dextran from the bottom chamber was measured at 40 min and expressed relative to the basal sictrl-transfected HUVEC. Data represents mean ± SEM. *, P < 0.05; **, P < 0.01; n = 8 independent experiments, paired t-test. (H) RhoC, but not RhoA knockdown rescues the disrupted AJs induced by ARHGAP18 knockdown. HUVEC were transfected with ctrl or ARHGAP18 siRNAs then transfected with ctrl, RhoA or RhoC siRNAs stained for VE-cadherin (green) and F-actin (red) and nuclei counterstained with DAPI (blue) and imaged by confocal microscopy. Bar 25 μm.
Loss of ARHGAP18 promotes tumor growth and vascularization
The above results suggested that ARHGAP18 is important to limit the angiogenic phenotype. To confirm this, the effects of ARHGAP18 deletion on the growth of subcutaneous B16F10 melanoma tumors were assessed. ARHGAP18−/− animals developed tumors more rapidly compared to WT mice (Fig. 7A). Furthermore, tumors were more highly vascularized in the ARHGAP18−/− mice (Fig. 7B and C) consistent with the effect of ARHGAP18 regulating angiogenesis.
Figure 7.
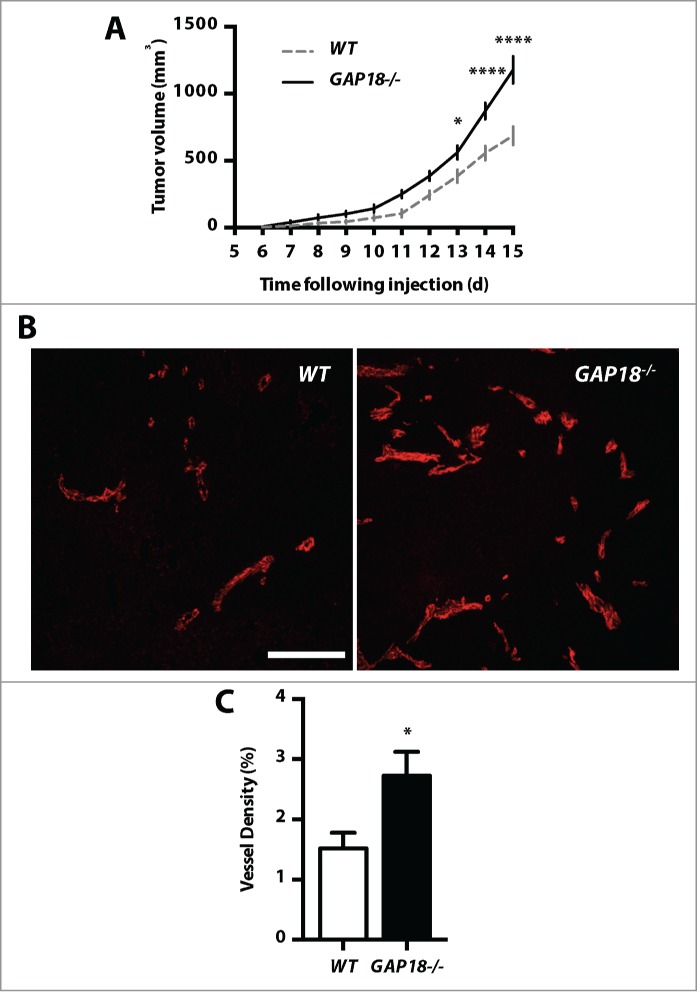
ARHGAP18 loss promotes tumor growth and vascularization. (A) Loss of ARHGAP18 promotes tumor growth. Tumor volumes in WT and ARHGAP18−/− mice were determined following subcutaneous injection of B16F10 melanoma cells. Data represents mean ± SEM. *, P < 0.05; ****, P < 0.0001, n = 5 mice per group, 2-way ANOVA, Sidak post-test. (B) Loss of ARHGAP18 promotes tumor vascularization. Representative confocal images of tumor sections stained for CD31 (red). Bar 50 μm. (C) Quantification of tumor microvascular density. Data represents mean ± SEM. *, P < 0.05, n = 8 WT and 7 ARHGAP18−/− mice, unpaired t-test.
Discussion
Tight regulation of angiogenesis is important in establishing and maintaining normal tissue vascularization, as over- or under-regulation contributes to pathologies, such as cancer and ischemic diseases, respectively. Here, we have identified ARHGAP18 as a negative regulator of the initial steps of sprouting angiogenesis, maintaining junctional homeostasis and suppressing EC sprouting. Loss of ARHGAP18 results in activation of RhoC and active serrated EC junctions and promotes a TC-like, hypersprouting and migratory phenotype. In pathogenesis, this results in a profound increase in tumor vessels and significant enhancement of tumor growth.
TC initiate sprouting angiogenesis by first loosening cell-cell contacts then extending filopodia toward to growth factor-enriched microenvironment. Here we have identified ARHGAP18 as negative regulator of the first 2 steps of sprouting angiogenesis; it is necessary to maintain junctional homeostasis and in limiting EC sprouting. This is demonstrated by 3 different methods. Firstly in ARHGAP18−/− animals there is increased retinal TC and serrated junctions and in explanted aortic rings from these mice there is increased sprouting and branching. Secondly in zebrafish embryos, where ARHGAP18 is depleted by morpholinos, there is increased hyperspouting and migratory phenotype in the vasculature. Finally, knockdown of ARHGAP18 in EC in vitro results in increases in the expression of TC-enriched genes including Dll4, Flk1, and Flt4, an increase in the propensity to occupy the tip cell position and active serrated cell junctions. During sprouting, VEGF stimulation results in VEGFR2-PI3K-Akt-dependent upregulation of Dll4 to transactivate Notch signaling in the adjacent cells to inhibit TC behavior.10,34 Consistent with the pro-sprouting phenotype, we observe increased VEGFR2 and Dll4 levels and hyperactivation of Akt in ARHGAP18-depleted EC. Recently, it has been demonstrated that EC in sprouts are in fact constantly rearranging and competing for the TC position.9,11 This process is regulated by differential levels of Dll4 and VE-cadherin dynamics in TC and SC, such that high Dll4 expressing cells exhibit serrated AJ, characteristic of motile cells, and frequently occupy the leading position.9,11 Consistent with this, in the absence of ARHGAP18, we observe more serrated localization of VE-cadherin in vitro and in angiogenic retinal EC, enhanced Dll4 expression and increased propensity to occupy the tip position. Thus, we would predict that there would be dynamic changes in ARHGAP18 expression or localization in individual cells during sprout formation that associate with the patterning of Dll4 expression and VE-cadherin distribution.
Many different RhoGTPases have been implicated in angiogenesis. However, ARHGAP18 is specific for RhoC in this setting as knockdown and overexpression of ARHGAP18 only regulated RhoC activation and not that of RhoA, Rac1, Cdc42 or RhoJ. Interestingly ARHGAP18 displays RhoA and Rho1 (Drosophila RhoA homolog) GAP activity in epithelial cell lines and Drosophila S2 cells, respectively.26,35 Such epithelial-endothelial differences in RhoGAP specificity have also been demonstrated in other RhoGAP family members, such as ARHGAP24/VasGAP/FliGAP.36-38 RhoC belongs to the Rho subfamily and shares 92% sequence similarity but is functionally distinct as RhoC promotes, whereas RhoA inhibits tumor cell invasion and migration.12,39-43 These functional differences are due to the activation of different downstream effectors such as ROCK, Dia,44 and formins.45,46 In particular, RhoC demonstrates higher affinity for ROCK than RhoA and overexpression of RhoC, but not RhoA, results in ROCK-dependent disruption of the AJs.44 Consistent with this we observe that RhoC, but not RhoA, knockdown rescues the disrupted AJs induced following ARHGAP18 loss, suggesting that ARHGAP18 maintains junctional stability through inhibition of RhoC-ROCK signaling.
The localized recruitment of GEFs and GAPs is also important in regulating the spatial activation and inactivation of the RhoGTPases respectively.12,39 ARHGAP18 and the Drosophila ARHGAP18 ortholog, Conu, have been previously shown to translocate to the lamellipodia of migrating epithelial cells26 and to the cortex of Drosophila epithelium,35 respectively. We observed localization of ARHGAP18 to the junctions of sprouting and angiogenic EC. Notably, this was more pronounced in EC at the relatively unstable capillary plexi and angiogenic front in comparison to larger arterial and venous vessels. Further, ARHGAP18 dynamically relocalized to the remodeling EC junctions following thrombin stimulation in a ROCK-dependent manner. Although the mechanism underlying ARHGAP18 recruitment has not been elucidated, we observed time-dependent thrombin-induced Ser/Thr phosphorylation of a ROCK RXXS/T phosphorylation motif on ARHGAP18 that correlates with its localization and is suppressed following ROCK inhibition (Fig. S5A). Thrombin and VEGF are 2 powerful factors that induce breakdown of the integrity of EC junctions. The fact that ARHGAP18 is also recruited to the junctions following junctional disruption, suggest a negative feedback loop operates with ARHGAP18 acting to restrict the degree or extent of junctional breakdown induced by Rho-ROCK signaling. Consistent with this notion of a feedback-induced stabilizer, ARHGAP18 has been shown to be upregulated in the angiogenic TC47,48 and we observe upregulation of ARHGAP18 12–24 h following VEGF stimulation (Fig. S5B).
These early studies around ARHGAP18 suggest pathological implications. Chronic activation mutations of RAS and TIE2, which are associated with hemangiomas and venous malformations respectively, result in downregulation of ARHGAP18 (Fig. S5C and D)49 Further, ARHGAP18 has been identified as a breast cancer risk locus50,51 and shows loss of copy number in 30–56% of breast, lung and ovarian cancers (Catalog of Somatic Mutations in Cancer).52 Here we show that ARHGAP18 is important in tumorigenesis through action on the endothelium, since deletion results in increased tumor vascularization and excessive tumor growth. Thus, at a time when targeting the RhoGTPases is a therapeutic possibility, it becomes important to understand the complexity of action of the regulatory proteins in the angiogenic process. Since the ARHGAP18 knockout mice are phenotypically normal, our work described here suggests that ARHGAP18 is an important negative regulator in pathological angiogenesis.
Materials and Methods
Cell culture
Human umbilical vein endothelial cells (HUVEC) were isolated by collagenase digestion and cultured in M199 media (Sigma-Aldrich) supplemented with 15% (v/v) FCS (Hyclone), 15 μg/mL endothelial cell growth supplement (BD Biosciences, MA, USA) and 15 μg/mL heparin (Sigma Aldrich) as previously described.23 EC were routinely passaged every 3–4 d and used between passages 2–4.
siRNA-mediated gene silencing
HUVEC were seeded at 2 × 10⁴ cells/cm2 overnight. Volumes mentioned are for 10 cm2. Prior to transfection, the cell media was aspirated, washed and replaced with 1.5 mL EGM-2 media. Lipofectamine-siRNA complexes were formed by mixing 2.5 μL of Lipofectamine RNAiMax (Life Technologies) and 5 nM of siRNA, in 500 μL OptiMEM, for 10 min. The complexes were added drop-wise to cells and incubated for 4 h after which the media was changed to HUVEC culture media. Cells were routinely used at 3 d following transfection. For double knockdown experiments, EC were first transfected with ctrl or ARHGAP18 siRNAs for 1 d then transfected with RhoA/C or ctrl siRNAs on the next day and cells used 3 d following RhoA/C siRNA transfection. The validated ARHGAP18 siRNAs were from Life Technologies and Sigma Aldrich and the sequences are: siGAP18–1: UGGCAAAGAUUCUUGAUUCUAAUGG, siGAP18–2: UACAAUGGCUUUGACUUUAUAACCC, siGAP18–3: UUUACAAUAAACUUGGGAAUUGUCC, siGAP18–4: GG- CAAUACAGCUAACUGAA, siGAP18–5: CUAUUGGAUAGAACUAGAA, siGAP18–6: GAUGAUGCCACAUUACCUA, siGAP18–7: GCCAUUUAGCCCUAAUUGA, siCtrl-1: Stealth siRNA negative control Lo GC (Life Technologies), siCtrl-2: Mission siRNA universal negative control #1 (Sigma-Aldrich). The siRNAs for RhoA and RhoC were from Dharmacon: SMARTpool ON-TARGETplus RHOA siRNA (L-003860), SMARTpool ON-TARGETplus RHOC siRNA (L-008555), ON-TARGETplus Non-targeting Pool (D-001810).
ARHGAP18 adenoviral overexpression
Recombinant adenoviral particles expressing empty vector (EV) or ARHGAP18 were produced as previously described.23 HUVECs were seeded at 1.8 × 10⁶ cells in 10 cm dishes overnight and transduced with adenoviral particles in 2% (v/v) FCS media containing 8 μg/mL polybrene (Sigma-Aldrich) for 2 h. EC were used following 1 d transduction.
Cell stimulation
HUVEC were starved with culture media containing 2% FCS for 2 h prior to stimulation with recombinant human VEGF (Sigma-Aldrich) or thrombin (Sigma-Aldrich). ROCK inhibitor experiments were performed with Y-27632 (Sigma-Aldrich).
Scratch wound assay
HUVEC transfected with control or ARHGAP18 siRNAs for 3 d were scratch wounded using a cell scraper (Nunc), washed twice and cultured for 5 h. Brightfield images of the scratch wounds were captured at 0 h and 5 h on the Nikon Eclipse Ti using Nikon PL FL 4×/0.13 NA and 20×/0.45 NA objectives and wound sizes determined using Fiji (version 1.48).53
Spheroid sprouting assay
HUVEC transfected with control or ARHGAP18 siRNAs for 1 d were used for spheroid sprouts. HUVEC were resuspended in 0.24% (w/v) high viscosity methycellulose (Sigma-Aldrich) media and 600 cells seeded into U-bottom 96 well plates (Greiner Bio One, Stonehouse, UK) overnight. The spheroids were collected and overlayed with 500 μL of 0.72% (w/v) methylcellulose, 40% (v/v) FCS. A collagen solution consisting of 2 mg/mL rat tail collagen (type I) (BD Biosciences), 1× EBSS, and 20 mM NaOH was freshly prepared and 500 μL added to the collected spheroids. The spheroids were resuspended and 800 μL of the spheroids/collagen mix were added to a 24-well suspension plate (Greiner Bio-One) and the gel allowed to set at 37°C for 30 min. The embedded spheroids were stimulated with 200 μL of media containing 125 ng/mL VEGF or 125 ng/mL FGF-2 for 24 or 48 h respectively. Spheroids were imaged at the end-point on the Nikon Eclipse Ti using a Nikon PL FL 10×/0.30 NA objective. The total number and length of sprouts from at least 20 spheroids per experiment were analyzed by manual measurement using Fiji.
Spheroid competition assay
Control and ARHGAP18 siRNA transfected HUVEC were stained with 2.5 μm CellTracker Orange CMTMR (5,6–4-chloromethyl-benzoyl-amino-tetramethyl-rhodamine) (Life Technologies) or CellTracker Green CMFDA (5-chloromethyl-fluorescein diacetate) (Life Technologies), and nuclei stained using 3 μg/mL Hoechst 33342 (Life Technologies) for 30 min in media containing 5% FCS. The cells were washed then cultured for 30 min to secrete excess dye prior to harvesting and mixing at 1:1 ratios to form spheroids. Spheroid sprouts were established as mentioned above. Collagen gels were transferrred to glass bottom dishes (MatTeK) and spheroids imaged by laser scanning confocal (Leica TCS SP5) using a HCX PL FL 20×/0.50 NA objective. Distribution of each cell population spheroid sprouts and the tip position were determined manually.
FITC-dextran permeability
HUVEC transfected with siRNAs for 2 d were seeded at 1.0 × 10⁵ cells in 3 μm 24-well polycarbonate transwell inserts (Corning) pre-coated with 50 μg/mL fibronectin (BD Biosciences) and allowed to attach overnight. The cells were stimulated with 0.3 U/mL thrombin (Sigma) or left non-stimulated together with 1 mg/mL FITC-dextran (40 kDa) in the upper chamber. The FITC dextran from the bottom chamber was collected and measured at 40 min using the POLARstar Omega (BMG LabTech, Mornington, Australia).
Quantitative RT-PCR
HUVEC were lysed and total RNA isolated using TRIzol reagent (Life Technologies). The RNA was treated with DNase I (Sigma-Aldrich) and 1 μg reverse-transcribed using the High capacity cDNA synthesis kit (Life Technologies). Quantitative RT-PCR reactions were setup in triplicate and consisted of 2.5 ng of equivalent cDNA, 0.2 μM of forward and reverse primer and 1× SYBR green jumpstart mix (Sigma-Aldrich). Reactions were run in a Rotor-Gene 3000 PCR machine (Corbett, Qiagen) using a 4-step PCR cycling protocol consisting of 95°C for 10 min, 40 cycles of 95°C for 15 s, 62°C for 40 s, 72°C for 40 s and 78°C for 15 s and acquisition to the FAM channel. Melt curve analysis were performed at the end of the PCR cycling to confirm the absence of non-specific products. Relative gene expression changes were calculated using the 2-ΔΔCT method (Pfaffl, 2001). Primers used were: HsARHGAP18-F: CGAGCAAGCACTCAATCAGAAAGAGAG, HsARHGAP18-R: GCTGTCAATGGAACGCAAAAAAGACCAG, HsActin-F: CCCTCCATCGTCCACCGCAAATGCTTC, HsActin-R: CGACTGCTGTCACCTTCACCGTTCCAG, HsDLL4-F: AGGCCTGTTTTGTGACCAAG, HsDLL4-R: CTCCAGCTCACAGTCCACAC, HsFlt1-F: GGCTCTGTGGAAAGTTCAGC, HsFlt1-R: GCTCACACTGCTCATCCAAA, HsFlk1-F: GTGACCAACATGGAGTCGTG, HsFlk1-R: TGCTTCACAGAAGACCATGC, HsFlt4-F: GAGACAAGGACAGCGAGGAC, HsFlt4-R: TCACGAACACGTAGGAGCTG.
Immunoblotting
HUVEC and mouse lungs were lysed with ice-cold lysis buffer (50 mM Tris HCl, 150 mM NaCl, 2 mM EGTA, 1% NP40, pH 7.6) containing protease inhibitor cocktail (Sigma-Aldrich) and phosphatase inhibitor (PhosSTOP, Roche). Protein concentrations were determined by Dc protein assay (Bio-Rad) and equal amounts of proteins were separated on 4–12% NuPAGE SDS-PAGE gels (Life Technologies) and transferred to PVDF membranes (Bio-Rad). Membranes were blocked with 5% skim milk powder or BSA (Sigma-Aldrich) and probed overnight with primary antibodies. After washing with PBS containing 0.1% (v/v) Tween-20, membranes were incubated with HRP-conjugated anti-rabbit (Cell Signaling), anti-mouse (Cell Signaling) or anti-goat (Santa Cruz) secondary antibodies and bands detected by chemiluminescence using Pierce ECL or ECL plus substrates (Thermo Scientific) on the ChemiDoc MP gel imaging system (Bio-Rad). Primary antibodies and concentrations used were: mouse monoclonal anti-ARHGAP18 (clone 2A3, in house, 0.5 μg/mL), goat polyclonal anti-VE-cadherin (C-19, Santa Cruz, 1:500), rabbit monoclonal phospho-Akt Ser473 (D9E, Cell Signaling, 1:1000), mouse monoclonal Akt (40D4, Cell Signaling, 1:1000), mouse monoclonal phosphor-Erk1/2 Thr202/204 (E10, Cell Signaling, 1:1000), rabbit polyclonal anti-actin (Sigma-Aldrich, 1:2000), mouse monoclonal anti-α-tubulin (B-5–1–2, Sigma, 1:1000), rabbit monoclonal RhoA (67B9, Cell Signaling, 1:1000), rabbit monoclonal RhoC (D40E4, Cell Signaling, 1:1000).
Rho activity assay
Measurement of active RhoGTPase levels were determined using the GLISA assays (Cytoskeleton). Active RhoA, Rac1 and Cdc42 levels were determined using the GLISA assay kits. Active RhoC was determined using the RhoA activation assay kit with a rabbit monoclonal anti-RhoC (D40E4, Cell Signaling) antibody at 1:100 concentration. Active RhoJ was determined using the Cdc42 activation assay kit with a mouse monoclonal anti-RhoJ (1E4, Abnova) antibody at 1:100 concentration. Active RhoGTPase levels were normalized to total RhoGTPase levels determined by immunoblotting.
Immunofluorescence staining
Monolayer HUVEC staining
HUVEC were seeded at 6 × 10⁴ cells on fibronectin-coated (BD Bioscience) 8-well Lab-Tek chamber slides (Thermo Scientific) overnight. Cells were stimulated, washed then fixed with 4% formaldehyde (Thermo Scientific) or 1:1 cold methanol:aceteone. The cells were permeabilised with 0.1% Triton-X100, blocked with 2% BSA, then incubated in primary antibody in 2% BSA for 1 h. The unbound antibodies were washed then incubated in Alexa Fluor-conjugated secondary antibodies (Life Technologies, 1:500) for 30 min. F-actin was stained using 0.2 U rhodamine phalloidin (Life Technoligies) for 20 min. Nuclei were stained with 200 ng/mL DAPI for 10 min. The slides were mounted with ProLong Gold anti-fade reagent (Life Technologies) and immunostained slides imaged by laser scanning confocal microscopy (Leica TCS SP5) using a HCX PL APO Lbd Bl 63×/1.40–0.60 NA objective. Primary antibodies and concentrations used were: mouse monoclonal anti-ARHGAP18 (clone 2A3, in house, 5 μg/mL), rabbit monoclonal β-Catenin (D10A8, Cell Signaling, 1:100), rabbit monoclonal VE-cadherin (D87F2, Cell Signaling, 1:400).
Spheroid sprout staining
Spheroid sprouts established in collagen gels were fixed with 4% formaldehyde overnight at 4°C then 100% methanol overnight at −20°C. The gels were blocked with 1% (v/v) Triton-X100, 3% (w/v) BSA, 3% (v/v) NGS for 2 d at 4°C then incubated with primary antibody diluted in blocking buffer for 2 d at 4°C. The unbound antibodies were washed 8 times with 1% Triton-X in PBS for 1 h each then incubated in Alexa Fluor-conjugated secondary antibodies (1:500), diluted in blocking buffer, for 2 d at 4°C. The unbound secondary antibodies were washed as per the primary antibody then nuclei counterstained with 500 ng/mL DAPI for 30 min. The gels were washed 4 times with PBS for 30 min each then 4 times with dH2O for 4 times 30 min each and air-dried overnight on a microscope slide. The dried gels were mounted with ProLong Gold anti-fade reagent and imaged by laser scanning confocal microscopy (Leica TCS SP5) using a HCX PL APO Lbd Bl 63×/1.40–0.60 NA objective. Primary antibodies and concentrations used were: mouse monoclonal anti-ARHGAP18 (clone 2A3, in house, 5 μg/mL), rabbit polyclonal anti-PECAM (Abcam, 1:100), rabbit monoclonal VE-cadherin (D87F2, Cell Signaling, 1:400).
Mouse experiments
C57BL/6J mice were purchased from the Animal resources center (WA, Australia). The ARHGAP18−/− mouse was generated through the Knockout mouse project (KOMP) repository (CA, USA). All mouse experiments were performed in accordance to animal ethics guidelines from the University of Sydney and Sydney local health district (SLHD).
Aortic ring assay
The ex vivo aortic ring sprouting assay was performed on 6-week old mice as described.54 The isolated aortas were cut into 1 mm rings and embedded in Matrigel (BD Biosciences) and cultured for up to 7 d. The sprouts were imaged on the Nikon Eclipse Ti using Nikon PL FL 4×/0.13 NA and 20×/0.45 NA objectives and sprouted area determined manually using Fiji.
Retinal angiogenesis
Assessment of the post-natal retinal vasculature was performed in P6 mice according to.55 For isolectin B4 staining of the vasculature, the eyes were enucleated and fixed with formaldehyde for 2 h at 4°C, retinas dissected, re-fixed with formaldehyde for 1 h and blocked overnight. The retinas were equilibrated with PBLEC and stained with biotinylated isolectin-B4 (Vector) overnight, washed then incubated with streptavidin Alexa Fluor-594 (Life Technologies, 1:500) and mounted with ProLong Gold anti-fade reagent. For VE-cadherin staining, the retinas were not re-fixed and were stained with rat anti-mouse CD144 (11D4.1, BD Bioscience, 1:200) and goat anti-rat Alexa-647 (Life Technologies, 1:500). For ARHAGP18 and VE-cadherin co-staining, the retinas were blocked overnight with 2× Mouse on Mouse blocking reagent then stained with mouse anti-ARHGAP18 (2A3, in house, 20 μg/mL) and rabbit polyclonal anti-VE-cadherin (Abcam, 1:100) primary antibodies and goat anti-rabbit Alexa Fluor 488 (Life Technologies, 1:500) and goat anti-mouse F(ab′)2 Alexa Fluor 647 (Life Technologies, 1:500). The retinas were imaged on the Leica M205 FA stereo microscope and Leica TCS SP5 confocal using HC PL FL 10×/0.3 NA and HCX PL APO Lbd Bl 63×/1.40–0.60 NA objectives. Image analysis was performed using Fiji.
Mouse tumor model
Tumor growth. B16F10 melanoma cells (4 × 10⁵) were resuspended in 200 μL PBS and injected subcutaneously into the dorsal right flank region of 6-week old WT and ARHGAP18−/− mice. Tumor volumes were measured every day from day 6 following injection with calipers and determined based on the formula: V = π × [d2 × D]/6, where d is the minor tumor axis and D is the major tumor axis. The mice were sacrificed before the tumor size reached 1000 mm3 or at 3 weeks following injection.
Tumor microvascular density
For tumor microvascular density evaluation, tumors were harvested on day 4 after tumors became palpable. Two 8 μm frozen tumor sections that had around 200 μm intervals were cut for each tumor. The section were fixed then stained overnight with rat anti-mouse CD31 (Caltag, 1:100) then incubated with Alexa Fluor-conjugated goat anti-rat 647 secondary antibody (Life Technologies, 1:1000). Three random fields for each section were chosen and imaged by laser scanning confocal microscopy (Leica TCS SP5) with the HCX PL FL 20×/0.50 NA objective. Tumor microvascular densities were measured by determining the percentage of the CD31-positive area in the total tumor area using Fiji.
Zebrafish experiments
Zebrafish lines and injections
The Tg(fli1:EGFP)y1 line was used to visualize blood vessels and maintained according to standard protocols and animal ethics guidelines in the Zebrafish Lab at the Brain and Mind Research Institute, Sydney. The tg[lyve1:DsRed2/Flt1:YFP] line was used to co-visualize the lymphatic and blood vessels. Zebrafish embryos were microinjected at the one-to-2 cell stage with either 2 to 4 ng of standard control, translational-blocking (TrMO) or splice-blocking (SpMO) morpholino oligonucleotides (GeneTools LLC, OR, USA). The following oligonucleotides were used: Control MO: 5′-CCTCTTACCTCAGTTACAATTTATA-3′, ARHGAP18 TrMO: 5′-GGCTCTCCCCTAACAACATGAATAA-3′, ARHGAP18 SpMO: 5′-AAGATACAGC- GATCACTCACTTTAC-3′.
Zebrafish genotyping
Total RNA was extracted from embryos injected with Arhgap18 SpMO and control MO after 24 hpf using TRIzol. RNA samples were DNAse I treated and reverse transcribed. RT-PCR of the samples was performed using the following primer sets: Forward-Ex3: CAGCGAAACTTCCACAACAA, Reverse-Ex3: GCTCTTTAACCGCCAGTACG, Reverse-Int3: GACGCAGTCGCTGTTTGTAG, Reverse-Ex5: CTCCAGGTTGATGTCCGTCT, eef1a-F: CTGAACCACCCTGGTCAGAT, eef1a-R: TCTCAACGCTCTTGATGACG.
Zebrafish imaging
For confocal imaging, the embryos were mounted in 1% low-melting point agarose and imaged using Leica TCS SP5 confocal microscope using the HCX PL FL 20×/0.50 NA objective. Brightfield images of live embryos anaesthetised with 0.05% Tricaine (Sigma-Aldrich) was captured with DFC365FX camera attached to Leica M205 FA stereo-fluorescence microscope. Image adjustments and analysis of z-stacks were carried out using Fiji.
Statistics
Statisical significance was analyzed by using Prism 6.0. A P-value < 0.05 was considered significant.
Online supplement material
Figure S1 shows the effect of ARHGAP18 silencing on cell morphology and proliferation. Figure S2 shows the validation of ARHGAP18 silencing in zebrafish and the effect on the lymphatic vessels. Figure S3 shows the validation of the ARHGAP18 silencing and localization of ARHGAP18 in other retina vessels. Figure S4 shows effect of ARHGAP18 silencing on the activity of the other RhoGTPases tested and Western blots related to Figure 6. Figure S5 shows additional data pertaining to ARHGAP18 phosphorylation and expression.
Supplementary Material
Disclosure of Potential Conflicts of Interest
No potential conflicts of interest were disclosed.
Acknowledgments
We thank L Khan and E Zaporoshenko for technical assistance with HUVEC isolation.
Funding
This work was supported by grants from the National Health and Medical Research Council (NH&MRC) of Australia, Program Grant #571408 and the National Heart Foundation. JRG holds the Wenkart Chair of the Endothelium, Sydney Medical School, University of Sydney. GHKC was supported by the University of Sydney Postgraduate Award.
Author Contributions
GHKC, JRG conceived the project and designed experiments and analyzed data. GHKC, AJL, KKT, YZ, PRC performed different experimental aspects of the study. NIB and BMH performed the Zebrafish lymphatic experiments. GHKC, JRG and MAV wrote the manuscript.
References
- 1. Herbert SP, Stainier DY. Molecular control of endothelial cell behaviour during blood vessel morphogenesis. Nat Rev Mol Cell Biol 2011; 12:551-64; PMID:21860391; http://dx.doi.org/ 10.1038/nrm3176 [DOI] [PMC free article] [PubMed] [Google Scholar]
- 2. Potente M, Gerhardt H, Carmeliet P. Basic and therapeutic aspects of angiogenesis. Cell 2011; 146:873-87; PMID:21925313; http://dx.doi.org/ 10.1016/j.cell.2011.08.039 [DOI] [PubMed] [Google Scholar]
- 3. Weis SM, Cheresh DA. Tumor angiogenesis: molecular pathways and therapeutic targets. Nat Med 2011; 17:1359-70; PMID:22064426; http://dx.doi.org/ 10.1038/nm.2537 [DOI] [PubMed] [Google Scholar]
- 4. Ware JA, Simons M. Angiogenesis in ischemic heart disease. Nat Med 1997; 3:158-64; PMID:9018233; http://dx.doi.org/ 10.1038/nm0297-158 [DOI] [PubMed] [Google Scholar]
- 5. Marti HH, Risau W. Angiogenesis in ischemic disease. Thromb Haemost 1999; 82 Suppl 1:44-52; PMID:10695485 [PubMed] [Google Scholar]
- 6. Carmeliet P, Jain RK. Molecular mechanisms and clinical applications of angiogenesis. Nature 2011; 473:298-307; PMID:21593862; http://dx.doi.org/ 10.1038/nature10144 [DOI] [PMC free article] [PubMed] [Google Scholar]
- 7. Adams RH, Alitalo K. Molecular regulation of angiogenesis and lymphangiogenesis. Nat Rev Mol cell Biol 2007; 8:464-78; PMID:17522591; http://dx.doi.org/ 10.1038/nrm2183 [DOI] [PubMed] [Google Scholar]
- 8. Hellstrom M, Phng LK, Hofmann JJ, Wallgard E, Coultas L, Lindblom P, Alva J, Nilsson AK, Karlsson L, Gaiano N, et al. Dll4 signalling through Notch1 regulates formation of tip cells during angiogenesis. Nat 2007; 445:776-80; PMID:17259973; http://dx.doi.org/ 10.1038/nature05571 [DOI] [PubMed] [Google Scholar]
- 9. Jakobsson L, Franco CA, Bentley K, Collins RT, Ponsioen B, Aspalter IM, Rosewell I, Busse M, Thurston G, Medvinsky A, et al. Endothelial cells dynamically compete for the tip cell position during angiogenic sprouting. Nat Cell Biol 2010; 12:943-53; PMID:20871601; http://dx.doi.org/ 10.1038/ncb2103 [DOI] [PubMed] [Google Scholar]
- 10. Lobov IB, Renard RA, Papadopoulos N, Gale NW, Thurston G, Yancopoulos GD, Wiegand SJ. Delta-like ligand 4 (Dll4) is induced by VEGF as a negative regulator of angiogenic sprouting. Proc Natl Acad Sci U S A 2007; 104:3219-24; PMID:17296940; http://dx.doi.org/ 10.1073/pnas.0611206104 [DOI] [PMC free article] [PubMed] [Google Scholar]
- 11. Bentley K, Franco CA, Philippides A, Blanco R, Dierkes M, Gebala V, Stanchi F, Jones M, Aspalter IM, Cagna G, et al. The role of differential VE-cadherin dynamics in cell rearrangement during angiogenesis. Nat cell Biol 2014; 16(4):309-21; PMID:24658686 [DOI] [PubMed] [Google Scholar]
- 12. Heasman SJ, Ridley AJ. Mammalian Rho GTPases: new insights into their functions from in vivo studies. Nat Rev Mol cell Biol 2008; 9:690-701; PMID:18719708; http://dx.doi.org/ 10.1038/nrm2476 [DOI] [PubMed] [Google Scholar]
- 13. Bryan BA, D'Amore PA. What tangled webs they weave: Rho-GTPase control of angiogenesis. Cell Mol life Sci 2007; 64:2053-65; PMID:17530172; http://dx.doi.org/ 10.1007/s00018-007-7008-z [DOI] [PMC free article] [PubMed] [Google Scholar]
- 14. Kim C, Yang H, Fukushima Y, Saw PE, Lee J, Park JS, Park I, Jung J, Kataoka H, Lee D, et al. Vascular RhoJ is an effective and selective target for tumor angiogenesis and vascular disruption. Cancer Cell 2014; 25:102-17; PMID:24434213; http://dx.doi.org/ 10.1016/j.ccr.2013.12.010 [DOI] [PubMed] [Google Scholar]
- 15. Vega FM, Ridley AJ. Rho GTPases in cancer cell biology. FEBS Lett 2008; 582:2093-101; PMID:18460342; http://dx.doi.org/ 10.1016/j.febslet.2008.04.039 [DOI] [PubMed] [Google Scholar]
- 16. Seasholtz TM, Brown JH. RHO SIGNALING in vascular diseases. Mol Interv 2004; 4:348-57; PMID:15616164; http://dx.doi.org/ 10.1124/mi.4.6.8 [DOI] [PubMed] [Google Scholar]
- 17. van der Meel R, Symons MH, Kudernatsch R, Kok RJ, Schiffelers RM, Storm G, Gallagher WM, Byrne AT. The VEGF/Rho GTPase signalling pathway: a promising target for anti-angiogenic/anti-invasion therapy. Drug Discov Today 2011; 16:219-28; PMID:21262381; http://dx.doi.org/ 10.1016/j.drudis.2011.01.005 [DOI] [PubMed] [Google Scholar]
- 18. Sahai E, Marshall CJ. RHO-GTPases and cancer. Nat Rev Cancer 2002; 2:133-42; PMID:12635176; http://dx.doi.org/ 10.1038/nrc725 [DOI] [PubMed] [Google Scholar]
- 19. Cook DR, Rossman KL, Der CJ. Rho guanine nucleotide exchange factors: regulators of Rho GTPase activity in development and disease. Oncogene 2014; 33:4021–4035; PMID:24037532; http://dx.doi.org/ 10.1038/onc.2013.362 [DOI] [PMC free article] [PubMed] [Google Scholar]
- 20. Xue W, Krasnitz A, Lucito R, Sordella R, Vanaelst L, Cordon-Cardo C, Singer S, Kuehnel F, Wigler M, Powers S, et al. DLC1 is a chromosome 8p tumor suppressor whose loss promotes hepatocellular carcinoma. Genes Dev 2008; 22:1439-44; PMID:18519636; http://dx.doi.org/ 10.1101/gad.1672608 [DOI] [PMC free article] [PubMed] [Google Scholar]
- 21. Ng IO, Liang ZD, Cao L, Lee TK. DLC-1 is deleted in primary hepatocellular carcinoma and exerts inhibitory effects on the proliferation of hepatoma cell lines with deleted DLC-1. Cancer Res 2000; 60:6581-4; PMID:11118037 [PubMed] [Google Scholar]
- 22. Yuan BZ, Zhou X, Durkin ME, Zimonjic DB, Gumundsdottir K, Eyfjord JE, Thorgeirsson SS, Popescu NC. DLC-1 gene inhibits human breast cancer cell growth and in vivo tumorigenicity. Oncogene 2003; 22:445-50; PMID:12545165; http://dx.doi.org/ 10.1038/sj.onc.1206064 [DOI] [PubMed] [Google Scholar]
- 23. Coleman PR, Hahn CN, Grimshaw M, Lu Y, Li X, Brautigan PJ, Beck K, Stocker R, Vadas MA, Gamble JR. Stress-induced premature senescence mediated by a novel gene, SENEX, results in an anti-inflammatory phenotype in endothelial cells. Blood 2010; 116:4016-24; PMID:20664062; http://dx.doi.org/ 10.1182/blood-2009-11-252700 [DOI] [PubMed] [Google Scholar]
- 24. Hahn CN, Su ZJ, Drogemuller CJ, Tsykin A, Waterman SR, Brautigan PJ, Yu S, Kremmidiotis G, Gardner A, Solomon PJ, et al. Expression profiling reveals functionally important genes and coordinately regulated signaling pathway genes during in vitro angiogenesis. Physioll Genomics 2005; 22:57-69; PMID:15840639; http://dx.doi.org/ 10.1152/physiolgenomics.00278.2004 [DOI] [PubMed] [Google Scholar]
- 25. van Buul JD, Geerts D, Huveneers S. Rho GAPs and GEFs: Controling switches in endothelial cell adhesion. Cell Adh Migr 2014; 8:108-124; PMID:24622613; http://dx.doi.org/ 10.4161/cam.27599 [DOI] [PMC free article] [PubMed] [Google Scholar]
- 26. Maeda M, Hasegawa H, Hyodo T, Ito S, Asano E, Yuang H, Funasaka K, Shimokata K, Hasegawa Y, Hamaguchi M, et al. ARHGAP18, a GTPase-activating protein for RhoA, controls cell shape, spreading, and motility. Mol Biol Cell 2011; 22:3840-52; PMID:21865595; http://dx.doi.org/ 10.1091/mbc.E11-04-0364 [DOI] [PMC free article] [PubMed] [Google Scholar]
- 27. Gariano RF, Gardner TW. Retinal angiogenesis in development and disease. Nature 2005; 438:960-6; PMID:16355161; http://dx.doi.org/ 10.1038/nature04482 [DOI] [PubMed] [Google Scholar]
- 28. Phng LK, Gerhardt H. Angiogenesis: a team effort coordinated by notch. Dev Cell 2009; 16:196-208; PMID:19217422; http://dx.doi.org/ 10.1016/j.devcel.2009.01.015 [DOI] [PubMed] [Google Scholar]
- 29. Rabiet MJ, Plantier JL, Rival Y, Genoux Y, Lampugnani MG, Dejana E. Thrombin-induced increase in endothelial permeability is associated with changes in cell-to-cell junction organization. Arterioscler Thromb Vasc Biol 1996; 16:488-96; PMID:8630677; http://dx.doi.org/ 10.1161/01.ATV.16.3.488 [DOI] [PubMed] [Google Scholar]
- 30. Gamble JR, Drew J, Trezise L, Underwood A, Parsons M, Kasminkas L, Rudge J, Yancopoulos G, Vadas MA. Angiopoietin-1 is an antipermeability and anti-inflammatory agent in vitro and targets cell junctions. Circ Res 2000; 87:603-7; PMID:11009566; http://dx.doi.org/ 10.1161/01.RES.87.7.603 [DOI] [PubMed] [Google Scholar]
- 31. van Nieuw Amerongen GP, Koolwijk P, Versteilen A, van Hinsbergh VW. Involvement of RhoA/Rho kinase signaling in VEGF-induced endothelial cell migration and angiogenesis in vitro. Arterioscler Thromb Vasc Biol 2003; 23:211-7; PMID: http://dx.doi.org/23253477 10.1161/01.ATV.0000054198.68894.88 [DOI] [PubMed] [Google Scholar]
- 32. Ngok SP, Geyer R, Liu M, Kourtidis A, Agrawal S, Wu C, Seerapu HR, Lewis-Tuffin LJ, Moodie KL, Huveldt D, et al. VEGF and Angiopoietin-1 exert opposing effects on cell junctions by regulating the Rho GEF Syx. J Cell Biol 2012; 199:1103-15; PMID:23253477; http://dx.doi.org/ 10.1083/jcb.201207009 [DOI] [PMC free article] [PubMed] [Google Scholar]
- 33. Huveneers S, Oldenburg J, Spanjaard E, van der Krogt G, Grigoriev I, Akhmanova A, Rehmann H, de Rooij J. Vinculin associates with endothelial VE-cadherin junctions to control force-dependent remodeling. J Cell Bioly 2012; 196:641-52; PMID:22391038; http://dx.doi.org/ 10.1083/jcb.201108120 [DOI] [PMC free article] [PubMed] [Google Scholar]
- 34. Liu ZJ, Shirakawa T, Li Y, Soma A, Oka M, Dotto GP, Fairman RM, Velazquez OC, Herlyn M. Regulation of Notch1 and Dll4 by vascular endothelial growth factor in arterial endothelial cells: implications for modulating arteriogenesis and angiogenesis. Mol Cell Biol 2003; 23:14-25; PMID:12482957; http://dx.doi.org/ 10.1128/MCB.23.1.14-25.2003 [DOI] [PMC free article] [PubMed] [Google Scholar]
- 35. Neisch AL, Formstecher E, Fehon RG. Conundrum, an ARHGAP18 orthologue, regulates RhoA and proliferation through interactions with Moesin. Mol Biol Cell 2013; 24:1420-33; PMID:23468526; http://dx.doi.org/ 10.1091/mbc.E12-11-0800 [DOI] [PMC free article] [PubMed] [Google Scholar]
- 36. Akilesh S, Suleiman H, Yu H, Stander MC, Lavin P, Gbadegesin R, Antignac C, Pollak M, Kopp JB, Winn MP, et al. Arhgap24 inactivates Rac1 in mouse podocytes, and a mutant form is associated with familial focal segmental glomerulosclerosis. J Clin Invest 2011; 121:4127-37; PMID:21911940; http://dx.doi.org/ 10.1172/JCI46458 [DOI] [PMC free article] [PubMed] [Google Scholar]
- 37. Lavelin I, Geiger B. Characterization of a novel GTPase-activating protein associated with focal adhesions and the actin cytoskeleton. J Biol Chem 2005; 280:7178-85; PMID:15611138; http://dx.doi.org/ 10.1074/jbc.M411990200 [DOI] [PubMed] [Google Scholar]
- 38. Su ZJ, Hahn CN, Goodall GJ, Reck NM, Leske AF, Davy A, Kremmidiotis G, Vadas MA, Gamble JR. A vascular cell-restricted RhoGAP, p73RhoGAP, is a key regulator of angiogenesis. Proc Natl Acad Sci U S A 2004; 101:12212-7; PMID:15302923; http://dx.doi.org/ 10.1073/pnas.0404631101 [DOI] [PMC free article] [PubMed] [Google Scholar]
- 39. Wheeler AP, Ridley AJ. Why three Rho proteins? RhoA, RhoB, RhoC, and cell motility. Exp Cell Res 2004; 301:43-9; PMID:15501444; http://dx.doi.org/ 10.1016/j.yexcr.2004.08.012 [DOI] [PubMed] [Google Scholar]
- 40. Hakem A, Sanchez-Sweatman O, You-Ten A, Duncan G, Wakeham A, Khokha R, Mak TW. RhoC is dispensable for embryogenesis and tumor initiation but essential for metastasis. Genes Dev 2005; 19:1974-9; PMID:16107613; http://dx.doi.org/ 10.1101/gad.1310805 [DOI] [PMC free article] [PubMed] [Google Scholar]
- 41. van Golen KL, Wu ZF, Qiao XT, Bao LW, Merajver SD. RhoC GTPase, a novel transforming oncogene for human mammary epithelial cells that partially recapitulates the inflammatory breast cancer phenotype. Cancer Res 2000; 60:5832-8; PMID:11059780 [PubMed] [Google Scholar]
- 42. Simpson KJ, Dugan AS, Mercurio AM. Functional analysis of the contribution of RhoA and RhoC GTPases to invasive breast carcinoma. Cancer Res 2004; 64:8694-701; PMID:15574779; http://dx.doi.org/ 10.1158/0008-5472.CAN-04-2247 [DOI] [PubMed] [Google Scholar]
- 43. Bellovin DI, Simpson KJ, Danilov T, Maynard E, Rimm DL, Oettgen P, Mercurio AM. Reciprocal regulation of RhoA and RhoC characterizes the EMT and identifies RhoC as a prognostic marker of colon carcinoma. Oncogene 2006; 25:6959-67; PMID:16715134; http://dx.doi.org/ 10.1038/sj.onc.1209682 [DOI] [PubMed] [Google Scholar]
- 44. Sahai E, Marshall CJ. ROCK and Dia have opposing effects on adherens junctions downstream of Rho. Nat Cell Biol 2002; 4:408-15; PMID:11992112; http://dx.doi.org/ 10.1038/ncb796 [DOI] [PubMed] [Google Scholar]
- 45. Vega FM, Fruhwirth G, Ng T, Ridley AJ. RhoA and RhoC have distinct roles in migration and invasion by acting through different targets. J Cell Biol 2011; 193:655-65; PMID:21576392; http://dx.doi.org/ 10.1083/jcb.201011038 [DOI] [PMC free article] [PubMed] [Google Scholar]
- 46. Kitzing TM, Wang Y, Pertz O, Copeland JW, Grosse R. Formin-like 2 drives amoeboid invasive cell motility downstream of RhoC. Oncogene 2010; 29:2441-8; PMID:20101212; http://dx.doi.org/ 10.1038/onc.2009.515 [DOI] [PubMed] [Google Scholar]
- 47. del Toro R, Prahst C, Mathivet T, Siegfried G, Kaminker JS, Larrivee B, Breant C, Duarte A, Takakura N, Fukamizu A, et al. Identification and functional analysis of endothelial tip cell-enriched genes. Blood 2010; 116:4025-33; PMID:20705756; http://dx.doi.org/ 10.1182/blood-2010-02-270819 [DOI] [PMC free article] [PubMed] [Google Scholar]
- 48. Strasser GA, Kaminker JS, Tessier-Lavigne M. Microarray analysis of retinal endothelial tip cells identifies CXCR4 as a mediator of tip cell morphology and branching. Blood 2010; 115:5102-10; PMID:20154215; http://dx.doi.org/ 10.1182/blood-2009-07-230284 [DOI] [PubMed] [Google Scholar]
- 49. Uebelhoer M, Natynki M, Kangas J, Mendola A, Nguyen HL, Soblet J, Godfraind C, Boon LM, Eklund L, Limaye N, et al. Venous malformation-causative TIE2 mutations mediate an AKT-dependent decrease in PDGFB. Hum Mol Genet 2013; 22:3438-48; PMID:23633549; http://dx.doi.org/ 10.1093/hmg/ddt198 [DOI] [PMC free article] [PubMed] [Google Scholar]
- 50. Hu X, Stern HM, Ge L, O'Brien C, Haydu L, Honchell CD, Haverty PM, Peters BA, Wu TD, Amler LC, et al. Genetic alterations and oncogenic pathways associated with breast cancer subtypes. Mol Cancer Res 2009; 7:511-22; PMID:19372580; http://dx.doi.org/ 10.1158/1541-7786.MCR-08-0107 [DOI] [PubMed] [Google Scholar]
- 51. Stefansson OA, Jonasson JG, Olafsdottir K, Bjarnason H, Th Johannsson O, Bodvarsdottir SK, Valgeirsdottir S, Eyfjord JE. Genomic and phenotypic analysis of BRCA2 mutated breast cancers reveals co-occurring changes linked to progression. Breast Cancer Res 2011; 13:R95; PMID:21958427; http://dx.doi.org/ 10.1186/bcr3020 [DOI] [PMC free article] [PubMed] [Google Scholar]
- 52. Forbes SA, Bindal N, Bamford S, Cole C, Kok CY, Beare D, Jia M, Shepherd R, Leung K, Menzies A, et al. COSMIC: mining complete cancer genomes in the Catalogue of Somatic Mutations in Cancer. Nucleic acids Res 2011; 39:D945-50; PMID:20952405; http://dx.doi.org/ 10.1093/nar/gkq929 [DOI] [PMC free article] [PubMed] [Google Scholar]
- 53. Schindelin J, Arganda-Carreras I, Frise E, Kaynig V, Longair M, Pietzsch T, Preibisch S, Rueden C, Saalfeld S, Schmid B, et al. Fiji: an open-source platform for biological-image analysis. Nat Methods 2012; 9:676-82; PMID:22743772; http://dx.doi.org/ 10.1038/nmeth.2019 [DOI] [PMC free article] [PubMed] [Google Scholar]
- 54. Baker M, Robinson SD, Lechertier T, Barber PR, Tavora B, D'Amico G, Jones DT, Vojnovic B, Hodivala-Dilke K. Use of the mouse aortic ring assay to study angiogenesis. Nat Protoc 2012; 7:89-104; http://dx.doi.org/ 10.1038/nprot.2011.435 [DOI] [PubMed] [Google Scholar]
- 55. Pitulescu ME, Schmidt I, Benedito R, Adams RH. Inducible gene targeting in the neonatal vasculature and analysis of retinal angiogenesis in mice. Nat Protoc 2010; 5:1518-34; PMID:20725067; http://dx.doi.org/ 10.1038/nprot.2010.113 [DOI] [PubMed] [Google Scholar]
Associated Data
This section collects any data citations, data availability statements, or supplementary materials included in this article.