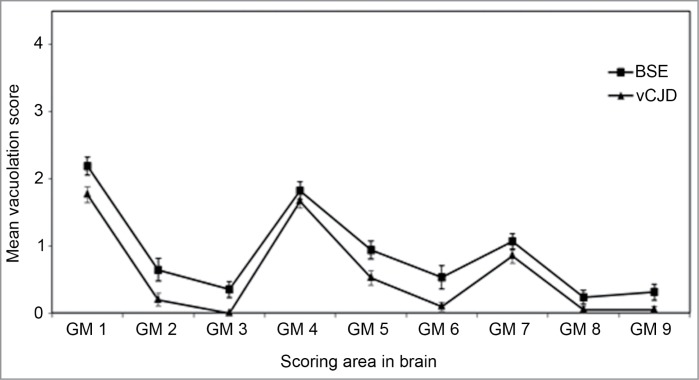
Figure 1.
Vacuolation scoring in the mouse brain. Lesion profile comparison of vCJD and BSE following transmission to RIII mice. Data shows mean lesion profile ± standard error of the mean (n ≥ 6). G1-G9, gray matter scoring regions; (G1) dorsal medulla, (G2) cerebellar cortex, (G3) superior colliculus, (G4) hypothalamus, (G5) thalamus, (G6) hippocampus, (G7) septum, (G8) retrosplenial and adjacent motor cortex, (G9) cingulate and adjacent motor cortex.

