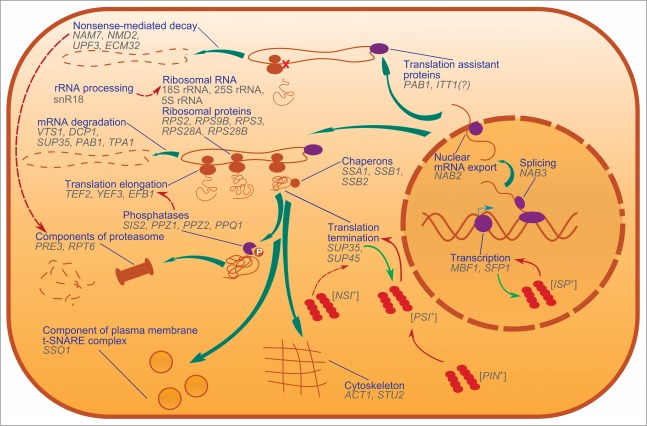
Figure 1.
Nonsense suppressors in S. cerevisiae, and cellular processes in which SNMs are implicated. Genes that are linked to nonsense suppressors are shown and grouped by cellular functions of their products. Thick teal arrows show the lifecycle of proteins, from transcription to degradation. Red arrows show influence of one process or prion on another. Light-green arrows show conversion of soluble proteins into prion conformations. Dashed arrows are shown in the cases if the mechanisms of an influence are not fully elucidated. Dark blue lines connect processes and their graphical representations.

