Abstract
Fuji apple storage time rapid determination method using visible/near-infrared (Vis/NIR) spectroscopy was studied in this paper. Vis/NIR diffuse reflection spectroscopy responses to samples were measured for 6 days. Spectroscopy data were processed by stochastic resonance (SR). Principal component analysis (PCA) was utilized to analyze original spectroscopy data and SNR eigen value. Results demonstrated that PCA could not totally discriminate Fuji apples using original spectroscopy data. Signal-to-noise ratio (SNR) spectrum clearly classified all apple samples. PCA using SNR spectrum successfully discriminated apple samples. Therefore, Vis/NIR spectroscopy was effective for Fuji apple storage time rapid discrimination. The proposed method is also promising in condition safety control and management for food and environmental laboratories.
Keywords: Fuji apple, principal component analysis, storage time, signal-to-noise ratio, Vis/NIR spectroscopy
Introduction
Apples possess various nutrients including vitamins, dietary fibers, amino acids, etc.1-3 In recent years, apple has been one of the most popular fruits among customers for its anti-oxidation, anti-senescence, immunity strengthens, and other beneficial functions.3-5 So apple has been a valuable nutrition resource in human's daily life. However, apple easily deteriorates after postharvest due to its high water content and abundant nutrients. Living cells still conduct normal respiration metabolism by consuming large amount of nutrients. In addition, fungi invasion also plays an important role in apple quality decrease.6 Therefore, there is a great demand for a novel rapid and nondestructive apple quality discrimination technique.
Vis/NIR spectroscopy, a fast-developed nondestructive detecting technique, has been widely applied in medicine,7,8 chemistry9,10 and food research, such as meat,11,12 drinks,13,14 grains,15,16 fruits,17-19 etc. Jamshidi et al managed to conduct taste characterization of Valencia oranges using reflectance Vis/NIR spectroscopy.20 Magwaza et al applied Vis/NIRS and chemometric analysis to predict fruit defects and postharvest behavior of ‘mules Clementine’ mandarin fruit.21 Zhang et al realized subtle bruises identification on fresh jujube based on NIR spectroscopy.22 So, Vis/NIR spectroscopy technique is frequently used in fruit quality rapid and nondestructive assessment.
In this paper, Fuji apple quality discrimination using nondestructive Vis/NIR spectroscopy were performed. Spectroscopy data were recorded and processed by nonlinear SR method. PCA method was used to analyze original spectroscopy data and SNR eigen values. Vis/NIR spectroscopy was effective for Fuji apple storage time rapid discrimination. The proposed method is promising in fruit freshness rapid detection.
Results and Discussion
Eigen peaks extraction
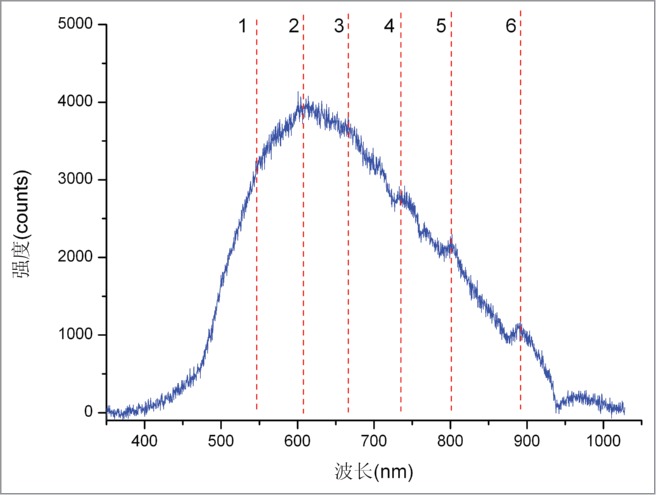
The original Vis/NIR diffuse reflection spectroscopy to apple samples is displayed in Figure 1. The main absorption band ranges from 400 to 1000 nm. The highest absorbance peak appears at about 600 nm and its absorbance reaches near 4000 counts. Eigen peaks corresponding to the wavelengths of 550 nm, 607 nm, 670 nm, 738 nm, 802 nm, and 789 nm are taken for subsequent principal component analysis of apple samples during storage.
Figure 1.

Original Vis/NIR diffuse reflection spectroscopy.
SNR spectrum analysis result
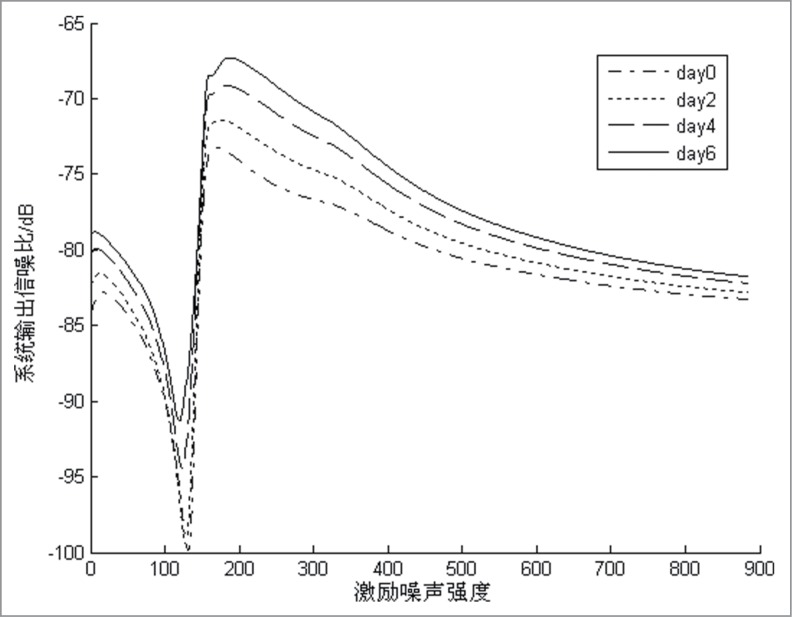
SNR spectrum calculated by SR as a function of noise intensity is displayed in Figure 2. Each curve first rises with increase of stimulating noise intensity and then declines to a stable value. The initial SNR value in each curve ranges between −75 dB and −65 dB. Different valleys and peaks appear before eigen peak formation. And each SNR curve has its eigen peak at 190 stimulating noise intensity. SNR spectrum clearly discriminates Fuji apples with different storage days. And the maximal SNR value in each curve is taken for subsequent analysis.
Figure 2.
SNR spectrum.
PCA results
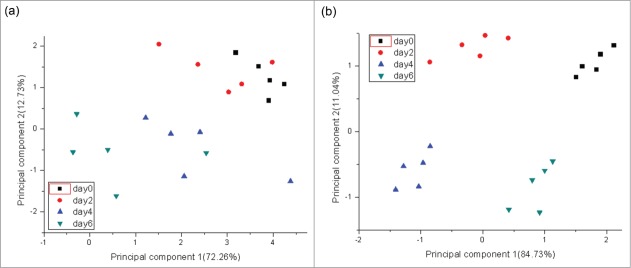
PCA results based on original spectroscopy data and SNR eigen value are displayed in Figure 3. As it shown in Figure 3(a), total contribution of the first 2 components is 84.99%. The first principal component (PC1) under different storage days presents a decreasing trend; the second principal component (PC2) gradually declines. There are some significant overlaps, especially from day0 to day2. So, PCA method could not totally discriminate Fuji apples with different storage time just by original Vis/NIR spectroscopy data. However, the first 2 principal components include a much higher contribution of 95.77% (see Fig. 3(b)). Components from different storage days have no overlaps between each other. All apple samples in different storage days could be successfully discriminated. Results indicate that PCA on SR processed Vis/NIR spectroscopy data was more effective in Fuji apple storage time rapid discrimination.
Figure 3.

PCA results using (a) original spectroscopy data and (b) SNR eigen value.
In this paper, Fuji apple quality discrimination using nondestructive Vis/NIR spectroscopy were performed. Spectroscopy data were recorded and processed by non-linear SR method. PCA was used to analyze original spectroscopy data and SNR eigen values. Vis/NIR spectroscopy was effective for Fuji apple storage time rapid discrimination.
Materials and Methods
Samples
Twenty fresh Fuji apples in the same bath with near size, ripeness and color (without any pretreatments or mechanical injury) were selected and purchased from a local supermarket in Hangzhou, China. After transporting to our lab within an hour, all samples were washed with distilled water. After draining, all samples were stored at room temperature in dark place. All experiments were performed under room temperature.
Vis/NIR spectroscopy system and measurement
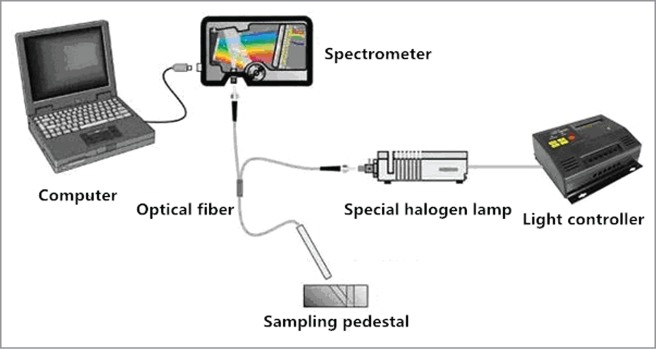
Diagram structure of Vis/NIR spectroscopy system is displayed in Figure 4. The system consists of 3 main parts including sampling device (light controller, sampling pedestal, optical fiber and special halogen lamp), detecting device (visible/NIR spectrometer, USB 2000+, America Ocean Photology Company), and desktop.
Figure 4.

Diagram structure of Visible/NIR spectroscopy system.
In spectroscopy measurement, sample was fixed in the sampling pedestal by the optical fiber with a dip angle of 75 degrees. One end of the optical fiber was connected with the spectroscopy, while the other end was connected with the special halogen lamp. Sampling pool was a sealed and light-tight cube. By replacing the sampling terminal in the sampling pool, 5 spectroscopy data from different directions could be collected in each sample, which eliminated errors from sampling direction differences. Spectroscopy analysis software (SpectraSuite, American Ocean Photology Company, America) was applied to analyze the data. Samples were analyzed every 2 d. Five samples were randomly taken in each test. All measurements were performed under room temperature.
SR
SR is a typical nonlinear model and proposed by Benzi for the explanation for Earth climate periodic changes.23-25 The schematic diagram of SR is displayed in Figure 5. SR phenomenon has 3 elements: a bistable system, a coherent input, and a noise source,23 which can be described as
| (1) |
Where < mml: mathxmlns: mml = "http: //www.w3.org/1998/Math/MathML" > <mml: mstyledisplaystyle = "true" > <mml: mi > x < /mml: mi > </mml: mstyle > </mml: math > is the position of the Brownian particle, < mml: mathxmlns: mml = "http: //www.w3.org/1998/Math/MathML" > <mml: mstyledisplaystyle = "true" > <mml: mi > t < /mml: mi > </mml: mstyle > </mml: math > is the time, < mml: mathxmlns: mml = "http: //www.w3.org/1998/Math/MathML" > <mml: mstyledisplaystyle = "true" > <mml: mi > A < /mml: mi > </mml: mstyle > </mml: math > is periodical signal intensity, < mml: mathxmlns: mml = "http: //www.w3.org/1998/Math/MathML" > <mml: mstyledisplaystyle = "true" > <mml: mi > f < /mml: mi > </mml: mstyle > </mml: math > is signal frequency. < mml: mathxmlns: mml = "http: //www.w3.org/1998/Math/MathML" > <mml: mstyledisplaystyle = "true" > <mml: mi > D < /mml: mi > </mml: mstyle > </mml: math > is external noise intensity. M and D are adjustable parameters, < mml: mathxmlns: mml = "http: //www.w3.org/1998/Math/MathML" > <mml: mstyledisplaystyle = "true" > <mml: mrow > <mml: mi > I < /mml: mi > <mml: mostretchy = "false" > lpar; </mml: mo > <mml: mi > t < /mml: mi > <mml: mostretchy = "false" > rpar; </mml: mo > <mml: mostretchy = "false" > equals; </mml: mo > <mml: mi > E < /mml: mi > <mml: mi > N < /mml: mi > <mml: mostretchy = "false" > lpar; </mml: mo > <mml: mi > t < /mml: mi > <mml: mostretchy = "false" > rpar; </mml: mo > <mml: mostretchy = "false" > plus; </mml: mo > <mml: mi > N < /mml: mi > <mml: mostretchy = "false" > lpar; </mml: mo > <mml: mi > t < /mml: mi > <mml: mostretchy = "false" > rpar; </mml: mo > </mml: mrow > </mml: mstyle > </mml: math > denotes an EN sensor signal < mml: mathxmlns: mml = "http: //www.w3.org/1998/Math/MathML" > <mml: mstyledisplaystyle = "true" > <mml: mrow > <mml: mi > E < /mml: mi > <mml: mi > N < /mml: mi > <mml: mostretchy = "false" > lpar; </mml: mo > <mml: mi > t < /mml: mi > <mml: mostretchy = "false" > rpar; </mml: mo > </mml: mrow > </mml: mstyle > </mml: math > and intrinsic noise < mml: mathxmlns: mml = "http: //www.w3.org/1998/Math/MathML" > <mml: mstyledisplaystyle = "true" > <mml: mrow > <mml: mi > N < /mml: mi > <mml: mostretchy = "false" > lpar; </mml: mo > <mml: mi > t < /mml: mi > <mml: mostretchy = "false" > rpar; </mml: mo > </mml: mrow > </mml: mstyle > </mml: math >, < mml: mathxmlns: mml = "http: //www.w3.org/1998/Math/MathML" > <mml: mstyledisplaystyle = "true" > <mml: mrow > <mml: mi > xi; </mml: mi > <mml: mostretchy = "false" > lpar; </mml: mo > <mml: mi > t < /mml: mi > <mml: mostretchy = "false" > rpar; </mml: mo > </mml: mrow > </mml: mstyle > </mml: math > is the external noise, and < mml: mathxmlns: mml = "http: //www.w3.org/1998/Math/MathML" > <mml: mstyledisplaystyle = "true" > <mml: mrow > <mml: mi > V < /mml: mi > <mml: mostretchy = "false" > lpar; </mml: mo > <mml: mi > x < /mml: mi > <mml: mostretchy = "false" > rpar; </mml: mo > </mml: mrow > </mml: mstyle > </mml: math > is the simplest double-well potential with the constants < mml: mathxmlns: mml = "http: //www.w3.org/1998/Math/MathML" > <mml: mstyledisplaystyle = "true" > <mml: mi > a < /mml: mi > </mml: mstyle > </mml: math > and < mml: mathxmlns: mml = "http: //www.w3.org/1998/Math/MathML" > <mml: mstyledisplaystyle = "true" > <mml: mi > b < /mml: mi > </mml: mstyle > </mml: math > characterizing the system. Noise intensity is a parameter of SR model. SR model is used as a data processing method in this research.
| (2) |
Figure 5.

Schematic of SR analysis procedure.
Eq. (1) can be written as
| (3) |
The minima of < mml: mathxmlns: mml = "http: //www.w3.org/1998/Math/MathML" > <mml: mstyledisplaystyle = "true" > <mml: mrow > <mml: mi > V < /mml: mi > <mml: mostretchy = "false" > lpar; </mml: mo > <mml: mi > x < /mml: mi > <mml: mostretchy = "false" > rpar; </mml: mo > </mml: mrow > </mml: mstyle > </mml: math > are located at < mml: mathxmlns: mml = "http: //www.w3.org/1998/Math/MathML" > <mml: mstyledisplaystyle = "true" > <mml: mrow > <mml: mo > PlusMinus; </mml: mo > <mml: msub > <mml: mi > x < /mml: mi > <mml: mi > m < /mml: mi > </mml: msub > </mml: mrow > </mml: mstyle > </mml: math >, where < mml: mathxmlns: mml = "http: //www.w3.org/1998/Math/MathML" > <mml: mstyledisplaystyle = "true" > <mml: mrow > <mml: msub > <mml: mi > x < /mml: mi > <mml: mi > m < /mml: mi > </mml: msub > <mml: mo > equals; </mml: mo > <mml: msup > <mml: mrow > <mml: mostretchy = "false" > lpar; </mml: mo > <mml: mi > a < /mml: mi > <mml: mo > / < /mml: mo > <mml: mi > b < /mml: mi > <mml: mostretchy = "false" > rpar; </mml: mo > </mml: mrow > <mml: mrow > <mml: mn > 1 < /mml: mn > <mml: mo > / < /mml: mo > <mml: mn > 2 < /mml: mn > </mml: mrow > </mml: msup > </mml: mrow > </mml: mstyle > </mml: math >. A potential barrier separates the minima with the height given by < mml: mathxmlns: mml = "http: //www.w3.org/1998/Math/MathML" > <mml: mstyledisplaystyle = "true" > <mml: mrow > <mml: mi > Delta; </mml: mi > <mml: mi > U < /mml: mi > <mml: mo > equals; </mml: mo > <mml: msup > <mml: mi > a < /mml: mi > <mml: mn > 2 < /mml: mn > </mml: msup > <mml: mo > / < /mml: mo > <mml: mn > 4 < /mml: mn > <mml: mi > b < /mml: mi > </mml: mrow > </mml: mstyle > </mml: math >. The barrier top is located at < mml: mathxmlns: mml = "http: //www.w3.org/1998/Math/MathML" > <mml: mstyledisplaystyle = "true" > <mml: mrow > <mml: msub > <mml: mi > x < /mml: mi > <mml: mi > b < /mml: mi > </mml: msub > <mml: mo > equals; </mml: mo > <mml: mn > 0 < /mml: mn > </mml: mrow > </mml: mstyle > </mml: math >. When three elements of SR interact coherently, the potential barrier can be reduced and the Brownian particle may surmount the energy barrier and enter another potential well.23 The intensity of signals will increase, which makes it possible that the weak signal can be detected from noise background. SNR is the common quantifier for SR and it can be approximately described as23
| (4) |
Conclusions
In this paper, Fuji apple storage time rapid determination method using Vis/NIR spectroscopy was proposed. Vis/NIR spectroscopy responses to Fuji apples were examined during 6 days’ storage. Spectroscopy data were processed by SR technique. And PCA method was used to analyze original spectroscopy data and SNR eigen values. The results demonstrated that PCA method could not totally discriminate Fuji apples with different storage time just via original Vis/NIR spectroscopy. However, SNR spectrum calculated by SR showed different maximal values under the same noise intensity. PCA successfully discriminated all samples using SNR maximal values. This method was effective for Fuji apple storage time rapid discrimination. It presents some advantages including non-destructive, rapid response, high accuracy, etc., and is also promising in condition safety control and management for food and environmental laboratories.
Disclosure of Potential Conflicts of Interest
No potential conflicts of interest were disclosed.
References
- 1. Ma BQ, Chen J, Zheng HY, Fang T, Ogutu C, Li SH, Han YP, Wu BH. Comparative assessment of sugar and malic acid composition in cultivated and wild apples. Food Chem 2015; 172:86–91; PMID:25442527; http://dx.doi.org/ 10.1016/j.foodchem.2014.09.032 [DOI] [PubMed] [Google Scholar]
- 2. Condezo-Hoyos L, Mohanty IP, Noratto GD. Assessing non-digestible compounds in apple cultivars and their potential as modulators of obese faecal microbiota in vitro. Food Chem 2014; 161:208–15; PMID:24837942; http://dx.doi.org/ 10.1016/j.foodchem.2014.03.122 [DOI] [PubMed] [Google Scholar]
- 3. Šavikin K, Živković J, Zdunić G, Gođevac D, Đorđević B, Dojčinović B, Đorđević N. Phenolic and mineral profiles of four Balkan indigenous apple cultivars monitored at two different maturity stages. J Food Compos Anal 2014; 35:101–11; http://dx.doi.org/ 10.1016/j.jfca.2014.05.004 [DOI] [Google Scholar]
- 4. Briones-Labarca V, Venegas-Cubillos G, Ortiz-Portilla S, Chacana-Ojeda M, Maureira H. Effects of high hydrostatic pressure (HHP) on bioaccessibility, as well as antioxidant activity, mineral and starch contents in Granny Smith apple. Food Chem 2011; 128:520–9; PMID:25212164; http://dx.doi.org/ 10.1016/j.foodchem.2011.03.074 [DOI] [PubMed] [Google Scholar]
- 5. Hui GH, Wu YL, Ye DD. Fuji apple storage time predictive method using electronic nose. Food Anal Methods 2013; 6:82–8; http://dx.doi.org/ 10.1007/s12161-012-9414-6 [DOI] [Google Scholar]
- 6. Lu HP, Lu LF, Zeng LZ, Fu D, Xiang HL, Yu T, Zheng XD. Effect of chitin on the antagonistic activity of Rhodosporidium paludigenum against Penicillium expansum in apple fruit. Postharvest Biol Technol 2014; 92:9–15; http://dx.doi.org/ 10.1016/j.postharvbio.2014.01.009 [DOI] [Google Scholar]
- 7. Chiang W-L, Lin T-T, Sureshbabu R, Chia W-T, Hsiao H-C, Liu H-Y, Yang C-M, Sung H-W. A rapid drug release system with a NIR light-activated molecular switch for dual-modality photothermal/antibiotic treatments of subcutaneous abscesses. J Control Release 2015; 199:53–62; PMID:25499553; http://dx.doi.org/ 10.1016/j.jconrel.2014.12.011 [DOI] [PubMed] [Google Scholar]
- 8. Porfire A, Rus L, Loredana AL, Tomuta I. High-throughput NIR-chemometric methods for determination of drug content and pharmaceutical properties of indapamide power blends for tabletting. J Pharmaceut Biomed Anal 2012; 70:301–9; PMID:22884785; http://dx.doi.org/ 10.1016/j.jpba.2012.07.026 [DOI] [PubMed] [Google Scholar]
- 9. Zhang Z, Feng WX, Su PY, Liu L, Lü XQ, Song JR, Fan DD, Wong W-K, Jones RA, Su CY. Near-infrared (NIR) luminescent Zn(II)-Ln(III)-containing (Ln=Nd, Yb or Er) Wolf Type II metallopolymer hybrid materials. Syn Metals 2015; 199:128–38; http://dx.doi.org/ 10.1016/j.synthmet.2014.11.019 [DOI] [Google Scholar]
- 10. Alexandrino GL, Poppi RJ. NIR imaging spectroscopy for quantification of constituents in polymers thin films loaded with paracetamol. Analytica Chemica Acta 2013; 765:37–44; PMID:23410624; http://dx.doi.org/ 10.1016/j.aca.2012.12.017 [DOI] [PubMed] [Google Scholar]
- 11. Alamprese C, Casale M, Sinelli N, Lanteri S, Casiraghi E. Detection of minced beef adulteration with turkey meat by UV-vis, NIR and MIR spectroscopy. LWT-Food Sci Technol 2013; 53:225–32; http://dx.doi.org/ 10.1016/j.lwt.2013.01.027 [DOI] [Google Scholar]
- 12. Ma J, Pu HB, Sun DW, Gao WH, Qu JH, Ma KY. Application of Vis-NIR hyperspectral imaging in classification between fresh and frozen-thawed pork Longissimus Dorsi muscles. Int J Refrig 2015; 50:10–8; http://dx.doi.org/ 10.1016/j.ijrefrig.2014.10.024 [DOI] [Google Scholar]
- 13. Giovenzana V, Beghi R, Guidetti R. Rapid evaluation of craft beer during fermentation process by vis/NIR spectroscopy. J Food Eng 2014; 142:80–6; http://dx.doi.org/ 10.1016/j.jfoodeng.2014.06.017 [DOI] [Google Scholar]
- 14. Yu HY, Niu XY, Lin HJ, Ying YB, Li BB, Pan XX. A feasibility study on on-line determination of rice wine composition by Vis-NIR spectroscopy and least-squares support vector machines. Food Chem 2009; 113:291–6; http://dx.doi.org/ 10.1016/j.foodchem.2008.06.083 [DOI] [Google Scholar]
- 15. Verdú S, Ivorra E, Sánchez AJ, Barat JM, Grau R. Study of high strength wheat flours considering their physicochemical and rheological characterization as well as fermentation capacity using SW-NIR imaging. J Cereal Sci 2015; 62:31–7; http://dx.doi.org/ 10.1016/j.jcs.2014.11.002 [DOI] [Google Scholar]
- 16. Chen H-Z, Song Q-Q, Tang G-Q, Xu L-L. An optimization strategy for waveband selection in FT-NIR quantitative analysis of corn protein. J Cereal Sci 2014; 60:595–601; http://dx.doi.org/ 10.1016/j.jcs.2014.07.009 [DOI] [Google Scholar]
- 17. Zhang LR, Xu HR, Gu MY. Use of signal to noise and area change rate of spectra to evaluate the Visible/NIR spectral system for fruit internal quality detection. J Food Eng 2014; 139:19–23; http://dx.doi.org/ 10.1016/j.jfoodeng.2014.04.009 [DOI] [Google Scholar]
- 18. He H-J, Sun D-W, Wu D. Rapid and real-time prediction of lactic acid bacteria (LAB) in farmed salmon flesh using near-infrared (NIR) hyperspectral imaging combined with chemometric analysis. Food Res Int 2014; 62:476–83; http://dx.doi.org/ 10.1016/j.foodres.2014.03.064 [DOI] [Google Scholar]
- 19. Giovenzana V, Beghi R, Buratti S, Civelli R, Guidetti R. Monitoring of fresh-cut Valerianella locusta Laterr. shelf life by electronic nose and VIS-NIR spectroscopy. Talanta 2014; 120:368–75; PMID:24468384; http://dx.doi.org/ 10.1016/j.talanta.2013.12.014 [DOI] [PubMed] [Google Scholar]
- 20. Jamshidi B, Minaei S, Mohajerani E, Ghassemian H. Reflectance Vis/NIR spectroscopy for nondestructive taste characterization of Valencia oranges. Comp Electron Agr 2012; 85:64–9; http://dx.doi.org/ 10.1016/j.compag.2012.03.008 [DOI] [Google Scholar]
- 21. Magwaza LS, Landahl S, Cronje PJR, Nieuwoudt HH, Mouazen AM, Nicolaï BM, Terry LA, Opara UL. The use of Vis/NIRS and chemometric analysis to predict fruit defects and postharvest behaviour of ‘Nules Clementine’ mandarin fruit. Food Chem 2014; 163:267–74; PMID:24912725; http://dx.doi.org/ 10.1016/j.foodchem.2014.04.085 [DOI] [PubMed] [Google Scholar]
- 22. Zhang SJ, Zhang HH, Zhao YR, Guo W, Zhao HM. A sample identification model for subtle bruises on the fresh jujube based on NIR spectroscopy. Math Comp Model 2013; 58:545–50; http://dx.doi.org/ 10.1016/j.mcm.2011.10.067 [DOI] [Google Scholar]
- 23. Benzi R, Sutera A, Vulpiana A. The mechanism of stochastic resonance. J Phys A 1981; 14:L453–6; http://dx.doi.org/ 10.1088/0305-4470/14/11/006 [DOI] [Google Scholar]
- 24. Gammaitoni L, Hanggi P, Jung P, Marchesoni F. Stochastic resonance. Rev Modern Phys 1998; 70:223–87; http://dx.doi.org/ 10.1103/RevModPhys.70.223 [DOI] [Google Scholar]
- 25. Dutta R, Das A, Stocks NG, Morgan D. Stochastic resonance-based electronic nose: a novel way to classify bacteria. Sensors Actuat B 2006; 115:17–27; http://dx.doi.org/ 10.1016/j.snb.2005.08.033 [DOI] [Google Scholar]


