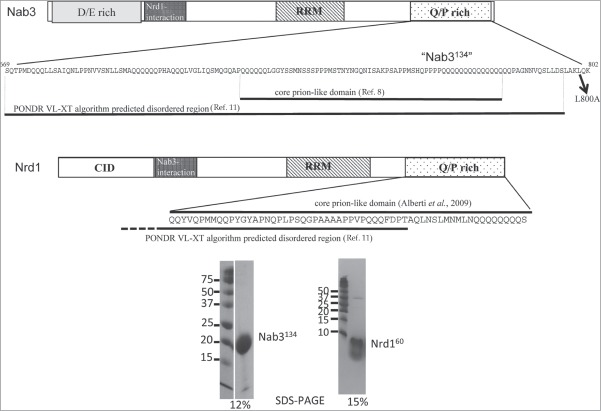
Figure 1.
Schematic of the yeast Nab3 and Nrd1 proteins with an expanded view of the low complexity region studied here (not to scale). For Nab3 the Asp-Glu (D/E) rich domain, the Nrd1-interaction domain, the RRM domain, and the Q/P rich domains are indicated with patterned boxes. The computationally predicted core prion-like domain and disordered region are indicated on the expanded sequence. The L800A mutation is shown with an arrow. The Nrd1 schematic shows its CTD-interaction domain, Nab3-interaction domain, RRM, and Q/P rich region with patterned boxes. The expanded sequence shows the C-terminal 60 amino acids studied here and the portions that score as prion-like and intrinsically unstructured based on computer algorithms. The purity of purified Nab3134 and Nrd160 based upon SDS-PAGE analysis is shown with the acrylamide percentages shown below each image. Both lanes of the Nab3134 gel were run on 2 ends of the same slab. A trace of added thrombin is evident at 36kD in the Nrd160 lane.

