Over 250 proteins have been subjected to a standard dye-based thermal melt analysis, and the results suggest that at least a third of soluble protein samples can be made significantly more stable by changing the composition of their formulation.
Keywords: differential scanning fluorimetry, protein stability, buffer, formulation, Thermofluor
Abstract
There is strong evidence to suggest that a protein sample needs to be well folded and uniform in order to form protein crystals, and it is accepted knowledge that the formulation can have profound effects on the behaviour of the protein sample. The technique of differential scanning fluorimetry (DSF) is a very accessible method to determine protein stability as a function of the formulation chemistry and the temperature. A diverse set of 252 soluble protein samples was subjected to a standard formulation-screening protocol using DSF. Automated analysis of the DSF results suggest that in over 35% of cases buffer screening significantly increases the stability of the protein sample. Of the 28 standard formulations tested, three stood out as being statistically better than the others: these included a formulation containing the buffer citrate, long known to be ‘protein friendly’; bis-tris and ADA were also identified as being very useful buffers in protein formulations.
1. Introduction
Protein crystallization is often slow, unreliable and tedious, yet is always necessary for structure determination by X-ray crystallography. Although there is no unequivocal metric for determining whether any given protein sample will crystallize, there are some proxy assays that offer indications. One of the simplest is the ‘pre-crystallization test’ suggested by Jarmila Jancarik, in which two ‘typical’ crystallization conditions are set up and observed: protein samples that are likely to crystallize tend to show a only a moderate amount of precipitation in one or both conditions (see, for example, the PCT kit from Hampton Research). Another is the examination of the protein sample by dynamic light scattering (DLS): monodisperse samples are more likely to crystallize than polydisperse samples (Ferré-D’Amaré & Burley, 1994 ▸). Although some studies have suggested that the overall thermal stability of a protein sample is not well correlated with crystallization (Price et al., 2008 ▸), a recent study has shown that there is a positive correlation between the thermal melt temperature of a protein sample and its propensity to crystallize (Dupeux et al., 2011 ▸). Certainly, completely unfolded proteins have a limited chance of crystallizing.
The behaviour of a protein construct can be highly dependent on its formulation: the salts, buffer, pH and other properties of the solution in which the protein is found can dictate the success of that sample in crystallization trials (Zhang et al., 2013 ▸). The Optimum Solubility Screen (Jancarik et al., 2004 ▸) uses precipitation (or lack thereof) coupled with dynamic light scattering to select appropriate formulations for crystallization. Another tool that has been shown to be useful in predicting thermal stability in different formulations is DSF (Ericsson et al., 2006 ▸). DSF is a technique that was developed (as was the Thermofluor assay) to be a low-volume assay suitable for studying the interaction of small molecules with proteins (Pantoliano et al., 2001 ▸). The assay is based on the behaviour of an environmentally sensitive dye: in a hydrophilic (aqueous) environment fluorescence from the dye is quenched, whereas in a hydrophobic environment the dye fluoresces strongly. If the dye is introduced into an aqueous sample of well folded protein, no fluorescence is observed. On unfolding of the protein the dye binds to the exposed hydrophobic core and fluorescence is observed. The increase in observed fluorescence from the dye is used to monitor the folded state of a protein sample as the sample is heated. The assay is simple, quick and can be run in an RT-PCR machine. The underlying assumption is that a binding event will stabilize the protein, and this will be reported as an increase in the temperature of melting (T m), measured in degrees. The same underlying assumption can be used to monitor the effects of different formulations on the stability of a protein sample. Not all protein samples behave well in the DSF assay: the perfect sample needs to be well folded at the beginning of the experiment, to not bind the reporter dye and to unfold cleanly revealing a dye-binding hydrophobic core (Boivin et al., 2013 ▸).
After using DSF to test protein formulations for a number of years, we had anecdotal evidence suggesting that this was a useful technique. We wanted to perform a more formal analysis to obtain a robust estimation of how often formulation screening by DSF might positively impact the stability and thus, hopefully, the crystallizability of a generic protein sample. Expanding on the core query (essentially, ‘is formulation screening by DSF useful?’), we developed two questions: firstly, is there a subset of formulations that are clearly better for stabilizing proteins in general?, and secondly, can we estimate the success rate of the Buffer Screen 9 screen?
In the Collaborative Crystallization Centre (C3) we have a standard assay (Buffer Screen 9, BS9) which tests 28 different formulations (13 buffers, two salt concentrations), as well as measuring positive and negative controls (Seabrook & Newman, 2013 ▸). One of the positive controls included in this assay is a ‘protein as supplied’ control where the melting profile of the protein is tested in its current formulation. We used the data from 252 samples to gauge the success of the BS9 assay in increasing the thermal stability of any given sample. The proteins submitted to the assay came from a user community consisting of around 100 users and encompassed a large variety of different proteins expressed in bacterial, insect or mammalian systems. No membrane proteins were included in the analysis, as the DSF technique using SYPRO dye is intrinsically ill-suited to detergent-containing systems.
2. Materials and methods
2.1. Determination of T m and identification of valid curves
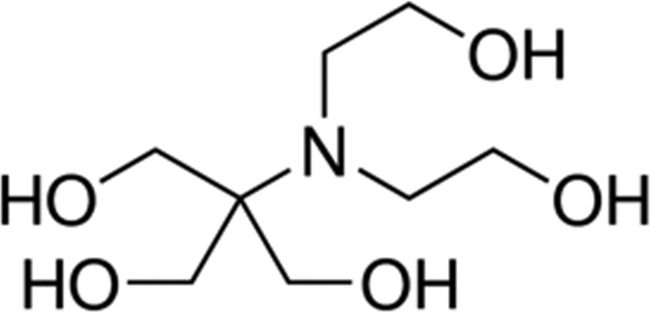
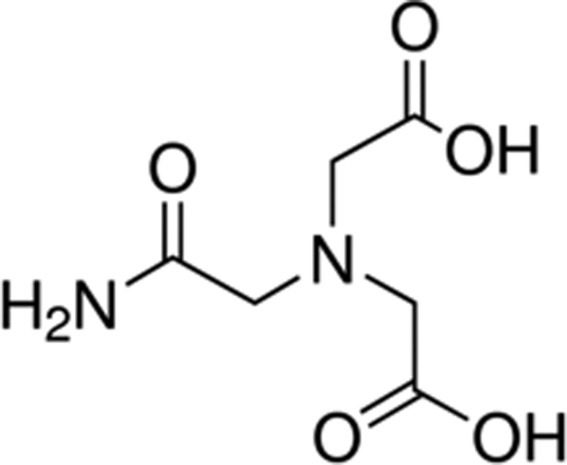
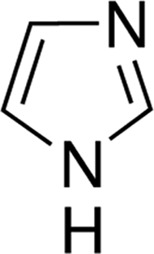
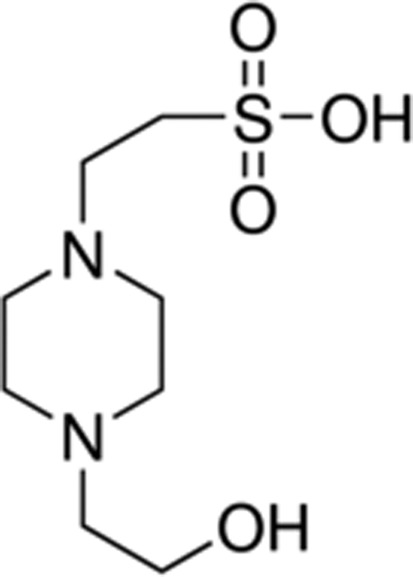
The Buffer Screen 9 experiment has been described elsewhere, but briefly it consists of 13 buffers at pHs ranging from 5 to 9, each tested at two levels of sodium chloride, 50 or 200 mM; every combination is tested in triplicate (Seabrook & Newman, 2013 ▸). The testing is performed by dilution, where the protein sample (usually at between 1 and 5 mg ml−1) to be tested is diluted 60× into the new formulation. When a sample is submitted for this test, we require that the user also submits a sample of the current formulation of the protein: we suggest the flowthrough from the sample-concentration step as being the appropriate solution, or the solution used in the final size-exclusion chromatography step. This allows us to run four (triplicate) controls for each BS9 experiment: two negative controls (no dye, no protein) and two positive controls (protein diluted into the formulation in which it is currently, lysozyme). Table 1 ▸ shows the buffers used in the formulations, along with the relevant pK a for each buffer.
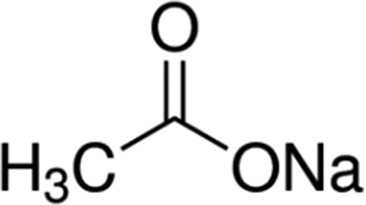
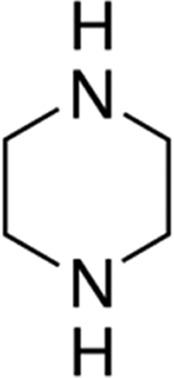
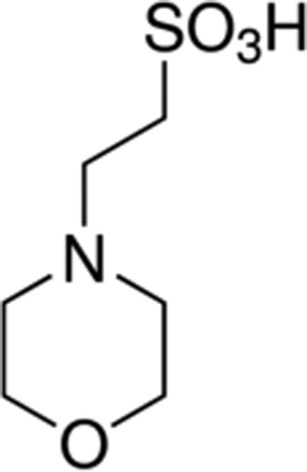
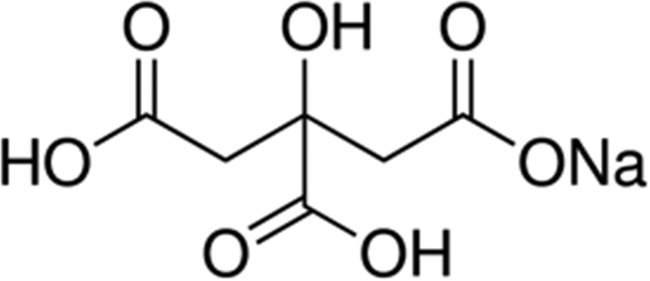
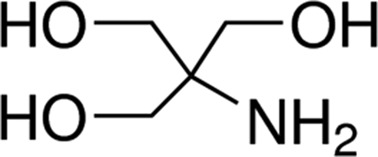
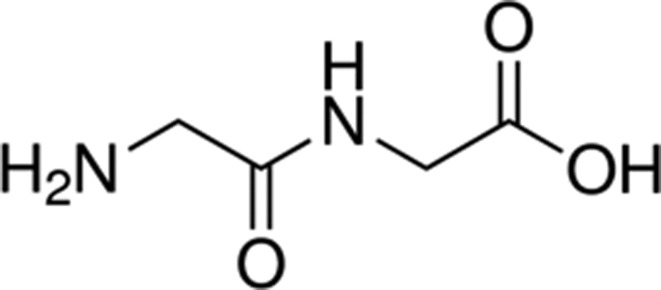
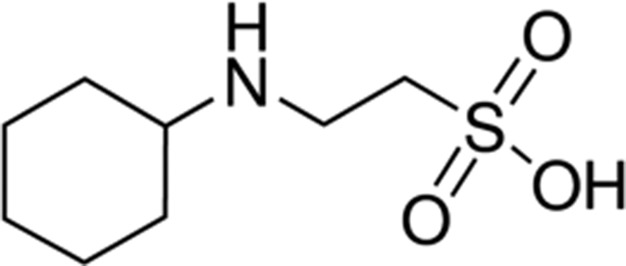
Table 1. Two-dimensional structures of the buffers used in the Buffer Screen 9 formulations.
Figures are reproduced from the Sigma-Aldrich website (http://www.sigmaaldrich.com) with permission of Sigma-Aldrich Co. LLC; pK a values are from the Reach Devices webpage (http://www.reachdevices.com/Protein/BiologicalBuffers.html), except for citrate, which came from the Sanderkok website (http://www.sanderkok.com/techniques/laboratory/pka_pkb.html). Buffering ranges are assumed to be approximately one pH unit either side of the appropriate pK a.
| Buffer | pK a at 298K | Structure |
|---|---|---|
| Acetate | 4.8 |
|
| Piperazine | 5.3 |
|
| MES | 6.2 |
|
| Citrate | 6.4 |
|
| Bis-tris | 6.5 |
|
| ADA | 6.8 |
|
| Imidazole | 7.0 |
|
| MOPS | 7.2 |

|
| HEPES | 7.6 |
|
| Phosphate | 7.2 | Na2HPO4/KH2PO4 |
| Tris | 8.1 |
|
| Glycyl-glycine | 8.3 |
|
| CHES | 9.4 |
|
Each of the 96 melt curves generated from the 252 proteins submitted to C3 and run through Buffer Screen 9 were analysed automatically with the Python program Meltdown, which normalized the curves, checked for suitability for T m determination and estimated a melt temperature. Details of the analysis and how to access the program can be found in the paper describing Meltdown (Rosa et al., 2015 ▸). Invalid curves, that is those which were flattened (indicating oversaturation), those with no signal (signal equivalent to the noise in the control curves) or those which showed no melt transition, were rejected and were not used to estimate a T m (Fig. 1 ▸). Any remaining curve was considered to be valid; replicate valid curves were compared and were used to estimate the T m and the error in the T m estimation for the protein sample in that formulation.
Figure 1.
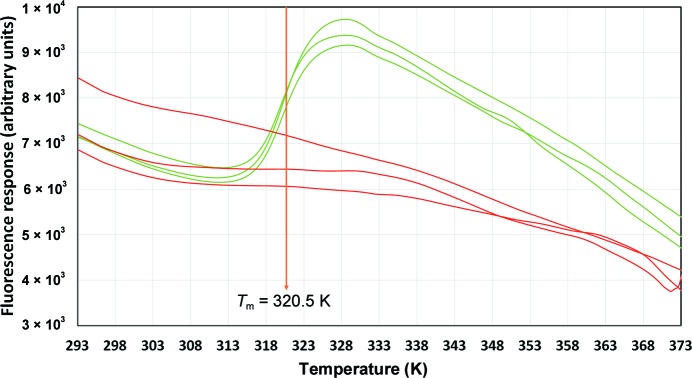
Triplicate melt curves (in arbitrary fluorescence units) of a mutant bovine carbonic anhydrase. Red curves are the ‘protein as supplied’ formulation (15 mM Tris chloride pH 7.5). Green curves are the sample diluted into the formulation 50 mM piperazine pH 5.5, 50 mM NaCl. The red curves are examples of invalid curves from which no T m could be estimated. The T m of the green curves is 320.5 ± 0.1 K. This protein sample was recalcitrant to crystallization in the original formulation and produced a crystal that diffracted to beyond 1.3 Å resolution when dialyzed into the piperazine formulation (manuscript in preparation).
2.2. Effect of different formulations
For each of the buffer/salt combinations, the question was asked ‘does this combination of buffer, pH and salt look better than the control on average?’. ‘Looking better’ combines two aspects: firstly, does this formulation increase the melt temperature of a protein sample? To answer this question, the T m of the protein sample in each formulation was compared with the T m of the same sample in the ‘protein as supplied’ positive control. Secondly, is the formulation better at producing valid curves (those which could be used to estimate T m) than the ‘protein as supplied’ control?
For each formulation, we looked at the average ΔT m, where ΔT m is the change in T m compared with the appropriate ‘protein as supplied’ control for all protein samples that produced valid curves for that formulation (and for the ‘protein as supplied’ control). We used a simple null hypothesis to answer the question ‘is this formulation better than the original formulation?’, or more formally,
X = calculated Tm for a protein in a particular condition
Y = calculated Tm for the same protein in original formulation
W = X - Y
H0: mean(W) = 0
versus
H1: mean(W) > 0.
This was tested at a significance level (α) of 0.10. Table 2 ▸ shows the formulations and the results of this analysis.
Table 2. Comparison of the ‘protein as supplied’ control with the average for each of the 28 formulations in BS9.
T m is the average of the difference (in C/K) between the T m of a sample in the formulation and the T m of the sample in the ‘protein as supplied’ positive control. The standard deviation of the difference is given in parentheses. The confidence interval shows the range in which the mean value would be statistically expected to lie at a 90% confidence level. The ‘No. of valid curves’ is the percentage of the 252 samples that were used to calculate the mean T m. ‘Valid curve increase’ shows how often the formulation yielded a valid curve when the ‘protein as supplied’ curve did not and ‘Valid curve decrease’ shows how often the formulation did not yield a valid curve when the ‘protein as supplied’ control did. The ‘Valid curve change’ is the difference of these two values. Rows in roman font describe formulations with 50mM salt; those in bold describe formulations containing 200mM salt. The three rows in italics are the formulations where the null hypothesis (i.e. that the formulation does not yield a T m > 0) is rejected at the 90% confidence level. All buffers are at 50mM in the formulations.
| Formulation | pH | T m | Confidence interval | 4 T m 30 (%) | No. of valid curves | Valid curve increase (%) | Valid curve decrease (%) | Valid curve change (%) |
|---|---|---|---|---|---|---|---|---|
| Salt only, 50mM NaCl | 1.2 (8.0) | (2.2, 0.1) | 15 | 168 | 2 | 19 | 17 | |
| Salt only, 200mM NaCl | 0.5 (8.2) | (0.5, +1.6) | 20 | 173 | 3 | 17 | 14 | |
| Sodium acetateacetic acid, 50mM NaCl | 5 | 5.3 (13.8) | (7.1, 3.4) | 14 | 153 | 4 | 25 | 21 |
| Sodium acetateacetic acid, 200mM NaCl | 5 | 7.6 (15.6) | (9.7, 5.6) | 12 | 158 | 4 | 23 | 19 |
| Piperazine, 50mM NaCl | 5.5 | 4.2 (9.8) | (5.4, 3.0) | 13 | 172 | 5 | 17 | 12 |
| Piperazine, 200mM NaCl | 5.5 | 1.2 (13.1) | (2.8, +0.5) | 16 | 173 | 5 | 17 | 12 |
| Sodium MES, 50mM NaCl | 6 | 1.3 (11.2) | (2.6, +0.1) | 19 | 182 | 4 | 1 | 9 |
| Sodium MES, 200mM NaCl | 6 | 1.1 (9.3) | (2.2, +0.0) | 19 | 185 | 4 | 12 | 8 |
| Trisodium citratecitric acid, 50mM NaCl | 6 | 0.0 (9.1) | (1.2, +1.1) | 21 | 174 | 4 | 17 | 13 |
| Trisodium citratecitric acid, 200mM NaCl | 6 | 1.3 (11.7) | (0.2, +2.8) | 23 | 171 | 7 | 18 | 11 |
| Bis-tris chloride, 50mM NaCl | 6.5 | 0.15 (8.2) | (1.2, +0.9) | 16 | 177 | 4 | 15 | 11 |
| Bis-tris chloride, 200mM NaCl | 6.5 | 0.8 (7.8) | (0.1, +1.8) | 19 | 176 | 4 | 16 | 12 |
| ADA, 50mM NaCl | 6.5 | 0.4 (8.2) | (1.5, +0.6) | 13 | 179 | 5 | 15 | 10 |
| ADA, 200mM NaCl | 6.5 | 1.5 (10.1) | (+0.2, +2.8) | 18 | 169 | 6 | 19 | 13 |
| Imidazole, 50mM NaCl | 7 | 0.6 (8.7) | (1.7, +0.5) | 16 | 178 | 4 | 15 | 11 |
| Imidazole, 200mM NaCl | 7 | 0.1 (7.7) | (1.1, +0.8) | 17 | 180 | 3 | 14 | 11 |
| Sodium MOPS, 50mM NaCl | 7 | 1.2 (8.2) | (2.2, 0.1) | 13 | 167 | 4 | 19 | 15 |
| Sodium MOPS, 200mM NaCl | 7 | 0.7 (9.4) | (0.5, +1.9) | 18 | 179 | 4 | 15 | 11 |
| Sodium HEPES, 50mM NaCl | 7.5 | 1.8 (8.2) | (2.8, 0.7) | 10 | 177 | 5 | 15 | 10 |
| Sodium HEPES, 200mM NaCl | 7.5 | 0.6 (7.5) | (1.5, +0.3) | 10 | 188 | 6 | 11 | 5 |
| Na2H/KH2 phosphate, 50mM NaCl | 7.5 | 1.0 (7.3) | (1.7, 0.1) | 10 | 180 | 4 | 14 | 10 |
| Na2H/KH2 phosphate, 200mM NaCl | 7.5 | 0.1 (9.9) | (1.1, +1.3) | 12 | 189 | 8 | 11 | 3 |
| Tris chloride, 50mM NaCl | 8 | 2.4 (7.9) | (3.4, 1.4) | 6 | 191 | 5 | 10 | 5 |
| Tris chloride, 200mM NaCl | 8 | 2.0 (8.0) | (3.0, 1.0) | 9 | 187 | 4 | 12 | 8 |
| Glycyl-glycine, 50mM NaCl | 8.5 | 3.2 (8.5) | (4.2, 2.2) | 10 | 187 | 6 | 12 | 6 |
| Glycyl-glycine, 200mM NaCl | 8.5 | 1.7 (8.8) | (2.8, 0.7) | 11 | 179 | 8 | 15 | 7 |
| CHES, 50mM NaCl | 9 | 4.8 (8.9) | (5.9 ,3.7) | 7 | 178 | 7 | 15 | 8 |
| CHES, 200mM NaCl | 9 | 4.6 (10.2) | (5.8, 3.3) | 8 | 184 | 10 | 13 | 5 |
2.3. Effect of BS9 on any given sample
For each sample, we selected the formulation that provided the greatest positive shift in T m relative to the ‘protein as supplied’ and looked at the distribution of these ΔT m values (Fig. 2 ▸). We also calculated the mean and standard deviation of the ΔT m over all appropriate samples. We calculated the average estimate of uncertainty for a sample by looking at the spread in T m values for duplicate curves of the ‘protein as supplied’ curves.
Figure 2.
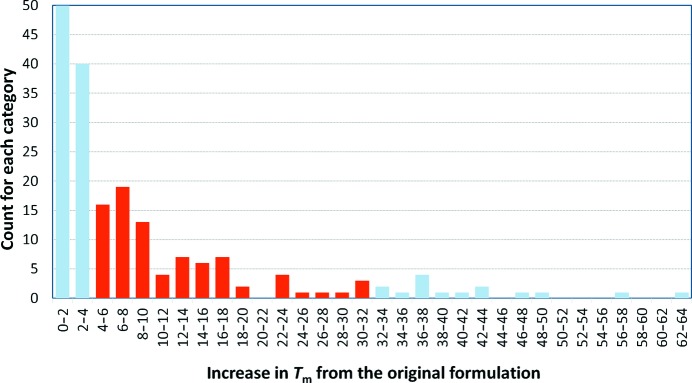
Histogram of the best ΔT m for the samples that were subjected to the automatic analysis. The grey bars represent ΔT m values below 4° or over 30°, which were excluded from the calculation of how many samples might show an increased stability after changing the formulation. The low-end exclusions were made to ensure that the estimation of the chance of improvement is not artificially high by including samples where the ΔT m might be within the estimation of error of the T m of the ‘protein as supplied’ control (1 ± 3°). The high-end exclusions were made as visual inspection of these curves showed that these values were the result of the automatic analysis and were spurious. The remaining 92 samples (37%) showed on average a 12 ± 7° improvement in T m. Including the curves where ΔT m was above 2° increases the estimation of likelihood of improvement to 53%.
2.4. Calculation of isoelectric points
For each of the sequences provided, an estimation of the isoelectric point (pI) of the protein was made using either the estimation of Kozlowski (2013 ▸), as implemented in C3, or the estimation from the ProtParam tool on the ExPASY website (Gasteiger et al., 2005 ▸). The values from the ProtParam calculation were plotted against the pH of the best formulation for each sample, where the best formulation was considered to be either the formulation in which the protein was supplied or the formulation which gave a positive change in T m, where the positive shift was significant (>4°). A scatter plot of the comparison is shown in Fig. 3 ▸.
Figure 3.
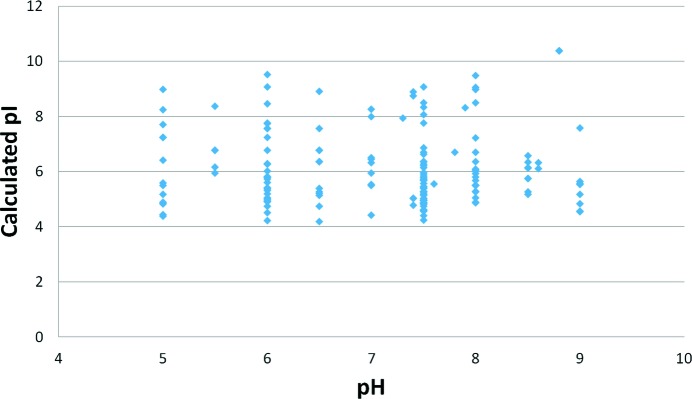
Scatter plot of the pH of the best formulation versus isoelectric point (pI) for the samples in this study. The ‘best formulation’ is either the buffer in which the protein was supplied (if none of the tested buffers gave a shift of 4° or more) or the formulation which produced the highest T m for that sample. The isoelectric point was obtained from the ProtParam website (http://web.expasy.org/protparam/) using the sequence as supplied. Only samples which had a valid sequence and which had a best formulation for which the pH was known are included.
3. Results
The protein samples were provided by the user community of C3; thus, we do not have precise information about the provenance of each of the samples. However, we do request the sequence of the protein sample and a summary of the formulation in which the protein is provided. However, this request is not always met: some fields are left blank or filled with placeholders, for example, there are a number of sequence fields containing the string ‘ANYTHING’. The data used in this analysis (without the identifying sequence or protein name) are provided in the Supporting Information. Using the provided information, the protein samples used in this analysis ranged in size from 3 to 131 kDa (with an average of 39 kDa), with calculated pIs ranging from 3.7 to 10.4 (with a mean of 6.1). The information about the formulation in which the protein was supplied was entered by the user as a string and is thus quite noisy, but it appears that the majority of samples are in either HEPES or Tris buffers with sodium chloride (50–500 mM). Many of the original formulations contained a reducing agent (most often DTT). The protocol we use for the DSF analyses involves a dilution (usually of 0.3 µl protein into a final volume of 20 µl), so that there will be some contribution to the results from the original formulation, although this effect should be small. The absence of any reducing agent in the BS9 formulations may also be a contributing factor that should be considered. The protein concentration was generally adjusted to 0.5–5 mg ml−1 going into the assay; during the analysis the DSF curves are normalized, so as long as the curves are valid (not overloaded and have measurable signal) the concentration of the protein is not particularly critical.
The isoelectric point (pI) of a protein is the point at which the charges of the side chains cancel out and the protein as a whole is neutral. The pI has been suggested to be an important value in protein crystallization experiments, as this is the point where the protein should be the least soluble and thus perhaps most likely to crystallize (Kantardjieff & Rupp, 2004 ▸; Kirkwood et al., 2015 ▸). We plotted pI versus pH to determine whether the solubility minimum of a protein as estimated by pI could be correlated with the pH of the formulation in which the protein is most stable as estimated by the T m. The pI can be estimated by calculation; there are many algorithms for doing so and each method may give slightly different values: see http://isoelectric.ovh.org/files/calculate.php. We used the calculation of pI as implemented in the ProtParam web server (http://web.expasy.org/protparam/) in our comparison of formulation pH versus pI, as this estimation of pI is widely used. There is no obvious correlation or anticorrelation between the pH of the best formulation and the pI of the protein sample; the scatter plot shown in Fig. 3 ▸ shows a wide range of pIs for each of the best formulation pHs. This in turn emphasizes the point that the solubility and the stability of a protein are not the same, although they are easily confused. An unstable protein may appear insoluble as it falls out of solution, yet a stable protein may not be soluble; for example, fibrous proteins such as collagen can be both stable and insoluble.
The range of positive T m shifts generated from the automatic analysis ranged from just over 0 to 63°; however, visual inspection of the curves which gave the extreme positive shifts showed that many of these were spurious and had resulted from aberrant curves. All of the positive shifts of 30° or more were false, but at least half of the shifts between 20 and 30° appeared to be real by the same visual inspection. The average estimation of error in the T m measurement for all samples that produced valid ‘protein as supplied’ control curves was 1 ± 3°. We considered a ΔT m to be statistically meaningful if it fell between 4 and 30°. The lower limit of 4° for selecting formulations which improve a sample may be too stringent for any given sample (where one would consider significant improvement relative to the average estimate of uncertainty in T m for that sample), but for a collection of samples this ameliorates the tendency to overinterpret the collective DSF experiment. Using this range, we found that 37% (92 of 252) of the samples tested in BS9 showed some improvement in stability in one or more of the formulations. Of these, 47 samples had a T m that was increased by five or fewer formulations of the BS9 screen and 17 samples had their T m increased by 15 or more formulations of the BS9 screen.
The results for each of the formulations tested in the BS9 assay are shown in Table 2 ▸. Most of the time, the formulations reduced the stability of a sample, which is shown by the average ΔT m being negative. In five of the 28 formulations the average ΔT m was positive, but only for three of the five was the improvement statistically significant at the 90% level. No formulation was significantly better than random at the 95% significance level (data not shown). The number of samples used in the calculation of the average ΔT m varied for each formulation. The calculation of a ΔT m requires both the formulation and the ‘protein as supplied’ to yield valid curves; of the 252 samples used in this analysis 36 did not give valid curves for the ‘protein as supplied’ control. All of the formulations produced a valid curve where the ‘protein as supplied’ curve was not valid for at least one sample, and all but one sample were rescued (that is, gave a valid unfolding curve when the ‘protein as supplied’ curves did not) by one or more of the formulations. The formulations with no buffer (salt only) or which contained buffers at lower pH (for example acetate at pH 5) did not rescue very many samples; the best formulation for rescuing samples appears to be CHES buffer at pH 9 with 200 mM NaCl (see also Collins et al., 2005 ▸). Another metric for looking at the success of a formulation is to see how often it engendered an invalid curve where the ‘protein as supplied’ control yielded valid data. Of all the formulations, the formulations containing acetate at low pH were particularly bad at producing valid curves, suggesting that most proteins do not like acetate formulations. From the BS9 results, acetate-buffered formulations would not be a first choice for any protein, but have shown to be very useful occasionally: often enough to justify their inclusion in the set of buffers tested in the screen.
Of the formulations that were statistically better than random for the sample set tested, all three contained high salt (200 mM NaCl) and were slightly acidic: sodium citrate pH 6, bis-tris chloride pH 6.5 and ADA pH 6.5. Although both citrate and ADA have three carboxylic acid groups, bis-tris does not appear to share much structural homology with the other two (Table 1 ▸). Sodium citrate is well known to be a useful buffer for proteins, but has been excluded for sample preparation for crystallization for a long time, perhaps because it is known to chelate metal ions and thus provides an additional hurdle in the preparation of heavy-metal derivatives. The other two buffers (bis-tris chloride and ADA) are probably not widely used as they are significantly more expensive than the more standard Tris buffer. The cost of a buffer depends not only on the cost of the chemical per gram but also on the molecular mass of the compound. Relative to Tris (∼$20 for 1000 ml of a 1 M solution), bis-tris is 11 times more expensive and ADA is 36 times more expensive.
4. Conclusion
Over a third of a large set of soluble proteins appeared to be more stable in different formulations from that in which they were initially provided when tested against a bank of 28 formulations selected for being ‘crystallization appropriate’. Of the 28 formulations, three were statistically better than random at producing improvements in stability: these were (i) 50 mM trisodium citrate–citric acid pH 6, 200 mM NaCl, (ii) 50 mM bis-tris chloride pH 6.5, 200 mM NaCl and (iii) 50 mM ADA pH 6.5, 200 mM NaCl.
Supplementary Material
Anonymous data used in the formulation analysis. DOI: 10.1107/S2053230X15012662/rl5104sup1.xlsx
Acknowledgments
We thank the users of the CSIRO C3 (http://crystal.csiro.au) for providing the proteins used in this analysis. We thank the Victorian Life Sciences Computational Initiative, the Biomedical Research Victoria Undergraduate Research Opportunities Program (UROP) and CSIRO’s Transformational Biology program for providing financial support for MR and NR.
References
- Boivin, S., Kozak, S. & Meijers, R. (2013). Protein Expr. Purif. 91, 192–206. [DOI] [PubMed]
- Collins, B., Stevens, R. C. & Page, R. (2005). Acta Cryst. F61, 1035–1038. [DOI] [PMC free article] [PubMed]
- Dupeux, F., Röwer, M., Seroul, G., Blot, D. & Márquez, J. A. (2011). Acta Cryst. D67, 915–919. [DOI] [PubMed]
- Ericsson, U. B., Hallberg, B. M., DeTitta, G. T., Dekker, N. & Nordlund, P. (2006). Anal. Biochem. 357, 289–298. [DOI] [PubMed]
- Ferré-D’Amaré, A. R. & Burley, S. (1994). Structure, 2, 357–359. [DOI] [PubMed]
- Gasteiger, E., Hoogland, C., Gattiker, A., Duvaud, S., Wilkins, M., Appel, R. & Bairoch, A. (2005). The Proteomics Protocols Handbook, edited by J. M. Walker, pp. 571–607. Totowa: Humana Press.
- Jancarik, J., Pufan, R., Hong, C., Kim, S.-H. & Kim, R. (2004). Acta Cryst. D60, 1670–1673. [DOI] [PubMed]
- Kantardjieff, K. A. & Rupp, B. (2004). Bioinformatics, 20, 2162–2168. [DOI] [PubMed]
- Kirkwood, J., Hargreaves, D., O’Keefe, S. & Wilson, J. (2015). Bioinformatics, 31, 1444–1451. [DOI] [PMC free article] [PubMed]
- Kozlowski, L. P. (2013). Calculation of Protein Isoelectric Point. http://isoelectric.ovh.org/.
- Pantoliano, M. W., Petrella, E. C., Kwasnoski, J. D., Lobanov, V. S., Myslik, J., Graf, E., Carver, T., Asel, E., Springer, B. A., Lane, P. & Salemme, F. R. (2001). J. Biomol. Screen. 6, 429–440. [DOI] [PubMed]
- Price, W. N. II et al. (2008). Nature Biotechnol. 27, 51–57.
- Rosa, N., Ristic, M., Seabrook, S. A., Lovell, D., Lucent, D. & Newman, J. (2015). J. Biomol. Screen.. In the press.. [DOI] [PubMed]
- Seabrook, S. A. & Newman, J. (2013). ACS Comb. Sci. 15, 387–392. [DOI] [PubMed]
- Zhang, C.-Y., Wu, Z.-Q., Yin, D.-C., Zhou, B.-R., Guo, Y.-Z., Lu, H.-M., Zhou, R.-B. & Shang, P. (2013). Acta Cryst. F69, 821–826. [DOI] [PMC free article] [PubMed]
Associated Data
This section collects any data citations, data availability statements, or supplementary materials included in this article.
Supplementary Materials
Anonymous data used in the formulation analysis. DOI: 10.1107/S2053230X15012662/rl5104sup1.xlsx


