

Abstract
Phagocytosis of apoptotic cells by both professional and semi-professional phagocytes is required for resolution of organ damage and maintenance of immune tolerance. KIM-1/TIM-1 is a phosphatidylserine receptor that is expressed on epithelial cells and can transform the cells into phagocytes. Here, we demonstrate that KIM-1 phosphorylation and association with p85 results in encapsulation of phagosomes by lipidated LC3 in multi-membrane organelles. KIM-1-mediated phagocytosis is not associated with increased ROS production, and NOX inhibition does not block LC3 lipidation. Autophagy gene expression is required for efficient clearance of apoptotic cells and phagosome maturation. KIM-1-mediated phagocytosis leads to pro-tolerogenic antigen presentation, which suppresses CD4 T-cell proliferation and increases the percentage of regulatory T cells in an autophagy gene-dependent manner. Taken together, these data reveal a novel mechanism of epithelial biology linking phagocytosis, autophagy and antigen presentation to regulation of the inflammatory response.
Keywords: acute kidney injury, T regs, biomarker, heterophagy, MHC
See also: C Münz (October 2015)
Introduction
Tissue remodeling as a result of organ injury, involution or organism development requires bulk clearance of apoptotic and necrotic cells (Erwig & Henson, 2007). Epithelial cells can be responsible for the majority of the uptake and degradation of dead cells from solid organs (Erwig & Henson, 2007; Poon et al, 2014). This clearance process may downregulate the inflammatory response associated with organ injury, but the immunomodulatory pathways involved are poorly defined (Erwig & Henson, 2007). Phagocytosis and clearance of dead cells in the injured kidney are largely carried out by proximal tubule cells (PTCs) expressing kidney injury molecule 1/ T-cell immunoglobulin and mucin domain 1 (KIM-1/TIM-1) (Ichimura et al, 2008; Yang et al, 2015). KIM-1 is a phosphatidylserine (PS) and scavenger receptor and is the only known apoptotic cell phagocytic receptor expressed on PTCs that transforms epithelial cells into phagocytes (Ichimura et al, 2008). KIM-1 has been linked to immunomodulation since polymorphisms in the human gene encoding KIM-1 protein have been associated with various diseases including allergy, asthma, rheumatoid arthritis, atopic dermatitis, and lupus, but this link has been postulated to derive from KIM-1/TIM-1 function on inflammatory cells where the expression of the protein is order of magnitudes less than that on kidney epithelial cells after injury (Chae et al, 2003, 2005; McIntire et al, 2004; Page et al, 2006; Garcia-Lozano et al, 2010; Lee et al, 2011; Xu et al, 2012). We have defined the cellular pathway linking the uptake of apoptotic debris by epithelial cells to autophagy, antigen presentation, and immune modulation.
Phagocytosis and elimination of foreign, non-self material by the lysosomal pathway is referred to as heterophagy, while macro-autophagy is a mechanism for the degradation of ‘self’ components, such as organelles (Oczypok et al, 2013). It remains to be resolved if the canonical (macro)autophagic pathway is involved in heterophagy. The macroautophagic pathway involves activation of a complex containing unc-51-like kinase/autophagy-related 1 (ULK1/ATG1), ATG13, and FIP200 (Randall-Demllo et al, 2013). This complex recruits the membrane that becomes autophagosome precursor where microtubule-associated protein 1 light chain 3 (LC3) is inserted, lipidating LC3 I to form LC3 II (Randall-Demllo et al, 2013). The autophagosome membrane surrounds the material to be eliminated, creating a double membrane (Randall-Demllo et al, 2013). In addition to heterophagy, recent studies have demonstrated a role of non-canonical autophagy in cell corpse clearance, termed LC3-associated phagocytosis (LAP). In this clearance pathway, LC3 is targeted to the phagosome in an ATG5-, ATG7-, and Beclin1-dependent manner; however, this process does not involve the engagement of upstream autophagy proteins such as ULK1 (Sanjuan et al, 2007; Florey et al, 2011; Martinez et al, 2011; Kim et al, 2013b). For the purposes of this study, processes that involve the canonical macroautophagy pathway will be referred to as autophagy.
In the current study, we report that epithelial cell heterophagy of apoptotic cells activates the autophagy pathway. We link the process of KIM-1-mediated phagocytosis to autophagy induction, MHC presentation and maintenance of peripheral T-cell tolerance. LC3 punctae formation and LC3 lipidation are induced by KIM-1-mediated phagocytosis of apoptotic cells. Knockdown of autophagy genes delays clearance of apoptotic cells and prevents LC3 II accumulation. Mechanistically, KIM-1 phosphorylation and interaction with p85 are necessary for localization of LC3 to the phagosome and increased LC3 lipidation, while inhibition of lysosome degradation results in the accumulation of multi-membrane phagosomes. KIM-1-mediated phagocytosis is not associated with increased ROS production and NOX inhibition does not block LC3 lipidation. Following KIM-1-mediated phagocytosis, PTCs present antigens from phagocytosed material on MHC II and cross-present antigens on MHC I. Importantly, antigen presentation reduced T-cell proliferation and increased regulatory T-cell (Tregs) proliferation, in an autophagy-dependent manner. Thus, KIM-1-mediated MHC presentation regulated T-cell proliferation by inducing Tregs. In this way, KIM-1-mediated phagocytosis modulates the immune response through phagocytosis, autophagy-mediated phagosome maturation and antigen presentation. This provides a mechanism by which epithelial cell self-antigen presentation actively protects against autoimmunity. To our knowledge, this is the first study to illustrate a complete pathway from epithelial cell receptor phagocytosis of apoptotic cells to T-cell response, including the uptake of apoptotic cells, phagosome maturation via autophagy, lysosomal degradation, presentation of antigens, and induction of a pro-tolerogenic T-cell response to presented antigens.
Results
KIM-1 co-localizes with lipidated LC3 at the phagosome
KIM-1 expression was associated with LC3 punctae formation in mouse kidney tissue detected by immunofluorescence. In normal animals, KIM-1 was not detectable and LC3 staining was evenly distributed throughout the PTC cytosol with stronger staining in some interstitial cells (Fig1A upper panel). As a positive control for LC3 punctae, mice were food deprived. After food withdrawal for 12 h, kidneys showed a dramatic increase in LC3 punctae in the PTCs, without the expression of KIM-1 (Fig1A middle panel), reflecting the absence of kidney injury. Following injury to the kidney by bilateral ischemia/reperfusion injury (IRI), KIM-1 protein was markedly up-regulated in many proximal tubules, and LC3 punctae were present in KIM-1-expressing proximal tubule cells (Fig1A lower panel). While KIM-1 expression was localized primarily to the apical aspect of in the PTC, KIM-1 also co-localized with intracellular organelles, which co-labeled with LC3 (Fig1A lower panel excerpts and arrows). Induction of LC3 punctae post-ischemia was confirmed by immunoblot analysis at 6 and 24 h after bilateral ischemia. During autophagosome formation, the cytosolic form of LC3 (LC3 I) is conjugated to phosphatidylethanolamine, yielding LC3 II which is recruited to the autophagosomal membrane. The lipidation of LC3 makes the protein travel faster by electrophoresis resulting in a lower band (Fujita et al, 2008). At both 6 and 24 h post-IRI, there was an increase in LC3 II accompanied by a marked increase in KIM-1 protein expression (Fig1B).
Figure 1.

- KIM-1 (green) and LC3 (red) staining in kidney sections from mice which were treated with bi-lateral ischemia (IRI), unfed for 12 h, or untreated. Exerts show higher magnification of areas of LC3 and KIM-1 co-localization and the punctate pattern of LC3 (arrows). Pearson correlation coefficient (PCC) = 0.097 ± 0.113 and 0.714 ± 0.08 and the Mander’s overlap coefficient (MOC) = 0.202 ± 0.052 and 0.948 ± 0.029 for the unfed and IRI treatment groups, respectively. n > 10 LC3-positive organelles from two different mice.
- Immunoblot analysis of KIM-1 and LC3 from post-ischemic kidney cortex (left panel) and quantification of immunoblots (right panel). *P = 0.0349, n = 3 mice.
- The percentage of GFP-LC3- and KIM-1-transfected cells positive for LC3 punctae was measured by cell counting. *P < 0.001, n = 4.
- Immunoblot analysis of LC3 II and ATG5/ATG12 complex formation in LLC-PK1 cells expressing KIM-1 incubated with or without apoptotic cells. Representative blot from three independent experiments.
- LLC-PK1 cells were transfected with GFP-LC3 alone or GFP-LC3 and KIM-1. Cells were then untreated or incubated with apoptotic cells and stained for KIM-1 (red). PCC = −0.135 ± 0.07, 0.599 ± 0.086, and 0.742 ± 0.057 and MOC = 0.588 ± 0.049, 0.856 ± 0.04, and 0.878 ± 0.037 for the LC3 alone, and KIM-1 + LC3 and KIM-1 + LC3 + apoptotic cells’ treatment groups, respectively. n ≥ 6.
- Immunoblot of LC3 II levels in KIM-1-transfected cells (left panel) and quantification of LC3 II (right panel). *P = 0.0217 for pcDNA vs. KIM-1 and P = 0.0102 for pcDNA + apop vs. KIM-1+ apop. n = 3.
- Immunoblot of p62 in LLC-PK1 cells expressing pcDNA or KIM-1 (left panel) and quantification of p62 levels (right panel).
- Uptake of PS-coated, fluorescein-labeled latex beads by pcDNA or KIM-1 transfected cells.
- Immunoblot analysis of isolated phagosomes for LC3, KIM-1, and organelle markers comparing phagosome (Pha) lysates vs. whole cell lysates (WCL). Representative of five independent experiments.
- LC3 and p62 immunoblot analysis of isolated phagosomes from cells treated with Baf (100 nM), Spautin1 (10 μM), or DPI (12.5 μM).
- Quantification of ROS production with DCFH-DA in KIM-1-expressing LLC-PK1 cells treated with apoptotic cells with and without DPI. *P = 0.0076 for DMSO vs. DPI and P = 0.0067 for DMSO vs. Apop. DPI.
To evaluate the effects of KIM-1-induced phagocytosis on LC3 punctae formation in vitro, LLC-PK1 cells were transfected with GFP-LC3 plus pcDNA or KIM-1. Cells were incubated with apoptotic thymocytes or left untreated. Transfection of KIM-1 was sufficient to induce LC3-positive autophagosome formation in ˜33% of cells, as measured by counting GFP-LC3 punctae. Incubation with apoptotic cells increased the number of cells with autophagosomes to ˜59% (Fig1C). Incubation of apoptotic cells with KIM-1-expressing cells resulted in increased levels of lipidated LC3, LC3 II, and a shift of monomeric ATG5 into a complex with ATG12, a complex required for autophagosome formation (Fig1D). As shown in Fig1C and E, compared to cells not expressing KIM-1, a greater percentage of KIM-1-positive cells displayed large numbers of LC3 punctae (Fig1E upper and middle panels). Following the uptake of apoptotic cells, intracellular KIM-1 co-localized with LC3 in phagosomes containing apoptotic cells (Figs1E lower panel and excerpts and EV1A). KIM-1 also co-localized with LC3 in primary PTCs (Fig EV1B). Thus, KIM-1 expression alone induced an increase in the number of cells displaying large numbers of LC3 punctae, which was further enhanced by phagocytosis. The up-regulation of LC3 punctae by KIM-1 expression was further confirmed by immunoblot analysis of LC3 II formation and p62 levels (Fig1F and G). KIM-1 led to the reduction of p62 levels, which was reversed upon incubation with the lysosomal inhibitor bafilomycin A1 (Baf) (Fig 1G). Note that these experiments were carried out in full medium with 10% fetal calf serum. Hence, the observed effects on LC3 by KIM-1 expression alone may be related to KIM-1-mediated uptake of media components and/or the uptake of debris of dead cells that are present in cell culture systems. Exogenous KIM-1 expression from the transfection of LLC-PK1 cells was similar to the expression of KIM-1 in primary PTCs (Fig EV1C).
Figure EV1.

- Full size individual fluorescent channels of cells in Fig 1D. Note while fewer, other autophagosomes remain following LC3 localization to KIM-1 phagosomes (arrows).
- Staining of primary cultured PTCs for endogenous KIM-1 and transfected RFP-LC3. Scale bar, 10 μM.
- Comparison of levels of shed KIM-1 supernatants of primary PTCs and KIM-1-transfected LLC-PK1 cells.
- Immunoblot analysis of LC3 II in KIM-1-expressing LLC-PK1 cells treated with or without apoptotic cells in the presence or absence of DPI (12.5 μM).
- ROS quantification of the data shown in Fig 1K with the additional condition of the H2O2 positive control.
To further confirm that LC3 co-localized with KIM-1 in phagosomes, we isolated KIM-1-expressing phagosomes. Latex beads coated with PS were added to pcDNA or KIM-1-transfected cells. Coating with PS was necessary for beads to be taken up by KIM-1-expressing cells. Phagosomes were isolated by homogenization of the cells followed by sucrose gradient centrifugation. As shown in Fig1H, KIM-1-transfected cells took up the PS-coated latex beads (green), whereas the control pcDNA transfected cells did not. Phagosomes isolated from KIM-1-expressing cells were found to contain KIM-1 and LC3 by immunoblot analysis. The phagosome preparation did not react with antibodies specific for other organelles, including mitochondrial (cytochrome c), nuclear (histone H3), or cytosol (S6 kinase) markers (Fig1I). LC3 and p62 association with the phagosomes was evaluated in the presence of Baf or the autophagy inhibitor Spautin1. We found that p62 and LC3 II levels were markedly increased with Baf and were suppressed with Spautin1 (Fig1J). LC3 recruitment to phagosomes has been reported to be dependent on NADPH oxidase (NOX)-dependent reactive oxygen species (ROS) production in LAP but not autophagy in macrophages and dendritic cells (Ma et al, 2012; Lam et al, 2013). To test if LC3 accumulation on the phagosomes was dependent on NOX-mediated ROS production, phagosomes were isolated from cells treated with diphenylene iodonium (DPI), a NOX inhibitor. DPI did not inhibit LC3 localization to the phagosome or LC3 lipidation in KIM-1 cells incubated with apoptotic cells (Figs1J and EV1D). DPI was found to inhibit basal ROS levels; however, contrary to what has been reported in macrophages and dendritic cells, KIM-1-mediated phagocytosis in epithelial cells did not induce ROS production (Figs1K and EV1E) (Huang & Brumell, 2009; Huang et al, 2009; Ma et al, 2012; Lam et al, 2013; Romao et al, 2013). Thus, KIM-1-mediated phagocytosis induced LC3 punctae formation and increased LC3 II by a NOX-independent process and KIM-1-positive phagosomes co-localized with LC3.
KIM-1 and LC3 co-localize following phagocytosis
To determine at what point during phagocytosis LC3 localized to the phagosome, primary cultured PTCs expressing KIM-1 (˜50% of cells), renal cell carcinoma (769p) cells which endogenously express KIM-1, and LLC-PK1 cells expressing KIM-1-GFP were transfected with RFP-LC3 and phagosome formation was imaged over time. The majority of phagosomes co-localized with LC3 following phagocytosis. As shown in Fig2A, a KIM-1-GFP-expressing LLC-PK1 cell binds apoptotic cells and KIM-1 is enriched at the binding site (Fig2A, 52 min; Video EV1). The apoptotic cell is then phagocytosed, but LC3 is not initially localized to the phagosome (Fig2A, 72 min). LC3 then surrounds the KIM-1-positive phagosome (92 min), and the phagosome becomes further encapsulated by LC3 (Fig2A, 132 min). At later time points, additional intracellular phagocytosed apoptotic cells become encapsulated with LC3 (Fig2A, 272 min). In a sub-population of cells, KIM-1 and LC3 co-localized prior to complete phagocytosis. In the example shown, KIM-1 and LC3 first co-localized at the phagocytic cup (Fig2B middle and right panels and Video EV2). Then, both KIM-1 and LC3 encapsulate the apoptotic cell forming a KIM-1- and LC3-positive phagosome (Fig2B middle and right panels). KIM-1- and LC3-positive phagosomes could be visualized as early as 10 min after the addition of apoptotic cells (Fig2B). Most of LC3 localization to the phagosome occurred later when the phagosome moved from the membrane to the cytosol (˜80%) with plasma membrane co-localization of KIM-1 and LC3 seen in only a small subset (˜16%) of LLC-PK1 cells (Fig2C). The overall rate of PTC epithelial cell phagosome maturation was slower compared to professional phagocytes, such as macrophages and dendritic cells (Fig EV2 and Video EV6).
Figure 2.

- A, B Time series of RFP-LC3 and KIM-1-GFP co-localization (arrows) in LLC-PK1 cells incubated with fluorescently labeled apoptotic thymocytes imaged at 20-min intervals (A) or 5-min intervals (B).
- C Quantification of phagocytosis and LC3 co-localization at plasma membrane or cytosol in LLC-PK1 cells, n = 132.
- D Co-localization of apoptotic cells and LC3 (arrows) in primary cultured proximal tubule cells were transfected with RFP-LC3, incubated with apoptotic thymocytes, and imaged at 15-min intervals.
- E Quantification of phagocytosis and LC3 co-localization at plasma membrane or cytosol in primary PTCs, n = 117.
- F Co-localization of RFP-LC3 and apoptotic cells (arrows) in 769p cells. 769p cells were transfected with LC3, incubated with fluorescently labeled apoptotic cells, and imaged every 10 min.
- G Quantification of phagocytosis and LC3 co-localization at plasma membrane or cytosol in 769p cells, n = 33.
Figure EV2.
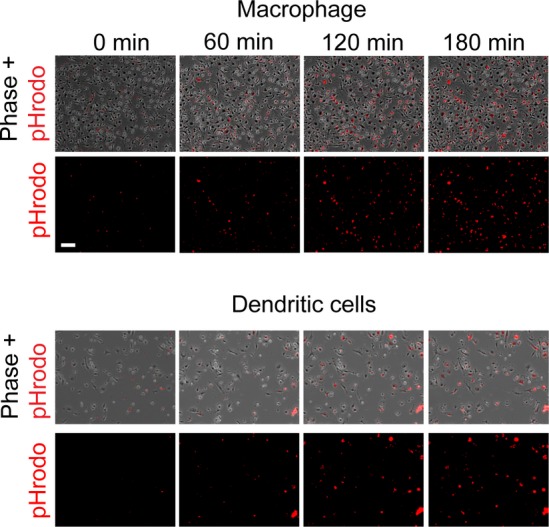
Time course of phagosome acidification in macrophages and dendritic cells
Bone marrow derived macrophages and dendritic cells were incubated with pHrodo-labeled apoptotic cells and imaged over time. Scale bar, 100 μm.
To confirm that LC3 localized with phagosomes after apoptotic cells bound to endogenous KIM-1, LC3-RFP localization to the phagosome was monitored in primary PTCs and 769p cells. In the example shown in Fig2D, two apoptotic thymocytes are bound to a PTC (Fig2D arrows and Video EV3). At the 14-min time point, one of the apoptotic cells was phagocytosed, and LC3 did not co-localize with these cells. At 44 and 74 min, however, LC3 surrounded both phagocytosed apoptotic cells (Fig2D right panels, arrows). LC3 co-localized with the apoptotic cell at the plasma membrane in < 1% of the primary PTCs (Fig2E). In 769p cells, a renal cell carcinoma cell line that endogenously expresses high levels of KIM-1, apoptotic cell uptake can be seen as early as 81 min. LC3 enrichment to the phagosome was not observed until 181 min (Fig2F and Video EV4). LC3 accumulation at the plasma membrane was only observed in fewer than 5% of 769p cells (Fig2G). Thus, in most cases, LC3 localizes to the phagosome after phagocytosis in both primary PTCs and 769p cells.
Both phagocytic and autophagic pathways ultimately lead to lysosomal degradation. To confirm that the encapsulation of KIM-1-positive phagosomes with LC3 occurred prior to the lysosome, a tandem fluorescent LC3 (ptfLC3) reporter construct was used with RFP and GFP tags on the LC3 protein. The GFP tag is pH sensitive and loses fluorescent signal in the lysosome, while the RFP signal is maintained (Kimura et al, 2007). KIM-1-expressing LLC-PK1 cells, transfected with ptfLC3, were incubated with apoptotic cells and imaged for GFP-RFP-LC3. Both the GFP and RFP signals were detected at the phagosome early after phagocytosis (Fig3A, B at 90 min and Video EV5). At 150 min, the GFP signal was diminished and the RFP signal remained, indicating fusion to the lysosome (Fig3A, B and Video EV5). We also analyzed LC3-GFP and LAMP1-RFP localization to the phagosome. LC3-GFP was found to localize to the phagosome prior to LAMP1 (Fig3C). Quantification of the phagosomes in Fig3C demonstrates that LC3 is enriched around the phagosome prior to LAMP1 localization (Fig3C lower panels). We also found that RFP-ubiquitin (Ub) localized to phagosomes at similar time or immediately prior to LC3-GFP (Fig3D and E). These results suggest that phagosomes are ubiquitinated, and LC3 is added prior to fusion of phagosomes to lysosomes. Of note, in some live cell imaging experiments, LC3-positive structures merged with, and dock to, KIM-1 phagosomes, prior to the phagosome becoming surrounded by LC3 in a continuous manner (Fig EV3A). It has been reported that phagocytosed bacteria targeted by autophagy are surrounded by vesicles which fuse to form a double-membrane structure (Rich et al, 2003). Likewise, vesicles and discontinuous double membranes are observed around phagosomes by EM (Fig3EVB).
Figure 3.

- Representative confocal images from 5 independent experiments of ptfLC3-expressing LLC-PK1 cells without apoptotic cells (left panel) after apoptotic cell uptake (middle panel) and after phagosome acidification (right panel).
- Representative time course from four independent experiments of ptfLC3 localization to the phagosome.
- Time course of LC3-GFP and LAMP1-RFP localization to the phagosome (upper panels) and line scans of the phagosome (lower panels). Representative of four independent experiments.
- Representative time course of LC3-GFP and RFP-Ub colocalization from two independent experiments imagining 20 fields in each experiment.
- Confocal micrographs of LLC-PK1 cells co-transfected with LC3-GFP and KIM-1, then incubated with apoptotic cells and stained for ubiquitin.
Figure 6.

KIM-1 phagosomes are enveloped by multi-membrane structures
- A Electron micrographs of wild-type KIM-1-expressing LLC-PK1 cell phagocytosis of an apoptotic cell.
- B EM micrographs of phagosomes within wild-type mKIM-1-expressing cells.
- C EM micrographs of KIM-1-expressing LLC-PK1 cells incubated with apoptotic cells in the presence of 100 nM bafilomycin.
- D EM micrographs of a cell expressing the phagocytosis-deficient KIM-1 WFND/AAAA mutant incubated with apoptotic cells.
- E, F Quantification of the number of cells with phagosomes and the number of phagosomes encapsulated by 1, 2, or > 2 membranes. n ≥ 24 cells per condition.
- G Representative immunogold staining (from four experiments) of KIM-1 in post-ischemic kidney tissue (Note: Fig6G and H reflect processing by Lowicryl embedding in order to preserve the antigen sites for immunogold staining. With Lowicryl embedding, cell membranes are difficult to discern, relative to standard TEM).
- H Co-immunogold staining of KIM-1 (12 nm beads) and LC3 (18 nm beads) in post-ischemic kidney tissue. Representative of three mice.
- I EM micrographs of wild-type (left) or KIM-1Δmucin kidneys from mice injected with Baf and subjected to ischemic injury.
- J, K Quantification of the number of multi-membrane bodies per cell (J) and the distribution of the size of the multi-membrane bodies (K) from wild-type or KIM-1Δmucin kidneys from mice injected with Baf and subjected to 25 min bilateral ischemia. Tissue was harvested at 24 h. Statistical comparisons were calculated by Student’s t-test. *P < 0.05, n = 3 mice with at least 30 proximal tubule cells analyzed per mouse.
Figure EV3.

- Confocal image of LC3-positive vesicles binding to KIM-1-positive phagosome. Scale bar, 5 μm.
- EM micrographs of an LLC-PK1 cell expressing KIM-1 with an internalized apoptotic cell. Scale bar, 2 μm.
Knockdown of KIM-1 expression or expression of phagocytosis-deficient mutant KIM-1 inhibits phagocytosis and LC3 lipidation in primary cultured mouse PTCs
Mouse and human KIM-1 have similar domain structure (Fig 4A). shRNA knockdown of KIM-1 inhibited the uptake of fluorescently labeled apoptotic cells by primary cultured PTCs (Fig4B and C). Thus, phagocytosis of apoptotic cells by primary PTCs was KIM-1 dependent. Knockdown of KIM-1 resulted in less membrane-bound LC3 in the absence or presence of apoptotic cells as reflected by decreased LC3 II levels (Fig4D). To confirm that KIM-1-mediated induction of LC3 lipidation was phagocytosis dependent, we generated a KIM-1 phagocytosis-deficient mutant in which the third exon of the gene, encoding the mucin domain, was deleted (Xiao et al, 2012). Polymorphisms in the mucin domain in humans are associated with asthma and other diseases (McIntire et al, 2004). KIM-1Δmucin-expressing proximal tubule cells took up significantly fewer apoptotic cells (Fig4E and F). The marked decrease of phagocytosis in these cells was associated with a reduction in the levels of LC3 II (Fig4G). Thus, KIM-1-mediated phagocytosis was associated with enhanced LC3 lipidation in primary cultured PTCs.
Figure 4.

- Diagram of mouse and human KIM-1 protein domains indicating the PS-binding domain, WFND, which was targeted for mutation.
- Representative images of apoptotic cell uptake (green) in primary mouse PTCs transfected with shGFP or shKIM-1.
- Quantification of phagocytosis of CellTracker green-labeled apoptotic cells by PTCs expressing shGFP or shKIM-1. *P < 0.01, n = 3.
- Immunoblot analysis of KIM-1 and LC3 in PTCs transduced with shGFP or shKIM-1, and incubated with apoptotic cells (representative of four experiments).
- Representative images of apoptotic cell uptake by cells expressing wt mouse KIM-1 or KIM-1Δmucin.
- Quantification of uptake of fluorescently labeled apoptotic cells by primary PTCs expressing wt KIM-1 or KIM-1Δmucin. *P < 0.001, n = 4.
- Immunoblot analysis of LC3 II formation in wt KIM-1- or KIM-1Δmucin-expressing PTCs.
- Representative images of LLC-PK1 cells transfected with wild-type mouse KIM-1 or mouse KIM-1 PS-binding mutants (red) incubated with apoptotic cells (green, arrows).
- Quantification of uptake of apoptotic cells in LLC-PK1 cells transfected with pcDNA wt KIM-1 or KIM-1-binding mutants. *P < 0.001, n = 3.
- LLC-PK1 cells were transfected with wt KIM-1 or PS-binding mutants and were incubated with medium (**P < 0.01), apoptotic cells (***P < 0.001), and serum-free medium (*P < 0.05, #significantly different from media control, P < 0.001). Autophagy was quantified by scoring cells positive for GFP-LC3 punctae. Lower panel: quantification of immunoblot in (K). #P < 0.05 compared to pcDNA control. n = 4.
- Immunoblot analysis of the expression of KIM-1 PS-binding domain mutants and LC3 in pcDNA, wt KIM-1, WF/AA, ND/AA, and WFND/AAAA mutants with and without incubation with apoptotic cells or serum starvation (Note, the antibody used for immunoblots preferentially recognizes the LC3 II band).
- Representative images from five independent experiments of LC3 punctae formation (arrows) in cells transfected with wt KIM-1, WF/AA, ND/AA, and WFND/AAAA. N = nucleus.
KIM-1-induced LC3 lipidation is dependent on ligand binding
Mutation of the KIM-1-binding domain completely blocked phagocytosis of apoptotic cells and subsequent LC3 lipidation. LLC-PK1 cells, transfected with three targeted mutations in the mouse KIM-1 sequence, amino acids 115–118 (Fig4A) in the PS-binding domain (Kobayashi et al, 2007; Santiago et al, 2007) (WF/AA, ND/AA, and WFND/AAAA), these mutant proteins did not bind to or take up apoptotic cells (Fig4H and I), although each was expressed at levels equivalent to wild-type KIM-1 in kidney epithelial cells which take up apoptotic cells (Fig4H and K). LC3 lipidation, as measured by an increase in cells displaying large numbers of LC3 punctae and LC3 II levels by Western blot, was not induced in any of the cells carrying one of the three PS-binding domain mutants (Fig4J–L). Incubation of apoptotic cells further increased LC3 punctae formation and LC3 II levels in wild-type but not mutant KIM-1-expressing cells (Fig4J and K). By contrast, serum starvation induced an increase in cells with LC3 punctae in all transfected cells, indicating that the transfections did not alter the capacity for growth factor deprivation to induce LC3 lipidation (Fig4J and K).
KIM-1-mediated LC3 lipidation requires KIM-1 phosphorylation and interaction with p85
The dependence of KIM-1-induced LC3 lipidation on ligand binding suggests that it may involve KIM-1 signaling. The KIM-1 extracellular domain, containing the ligand-binding site, can be cleaved and shed by metalloproteases (Bailly et al, 2002). The resulting remnant peptide, consisting of the transmembrane domain and cytosolic domain, contains two tyrosine phosphorylation sites (Bailly et al, 2002). These phosphorylation sites have been shown to play a role in KIM-1 signaling (de Souza et al, 2008). Interestingly, the KIM-1 remnant peptide has different subcellular localization compared to full-length KIM-1 (Fig5A and B). KIM-1 is localized primarily to the apical membrane, while the remnant peptide localizes to intracellular vesicles (Fig5A and B). The ligand binding mutant, WFND/AAAA, primarily localizes to the apical membrane, and the remnant peptide staining is greatly reduced (Fig5B). Wild-type KIM-1 also co-localized with components of the endocytotic/exocytotic pathways, such as vesicle-associated membrane proteins (VAMP) (Fig5C). In order to determine if KIM-1 signaling was involved in LC3 lipidation, we examined the effect of deleting different KIM-1 domains on phagocytosis and LC3 lipidation. Deletion of the KIM-1 extracellular domain, while retaining the cytosolic domain and transmembrane domain (cytodomain), ablated LC3 lipidation and phagocytosis (Fig5D–F). Deletion of the cytosolic domain, while retaining the ectodomain and transmembrane domain (ectodomain + TM), did not significantly alter phagocytic response compared to full-length KIM-1 (Fig5D–F). The ectodomain + TM and cytodomain mutants were expressed at similar levels as wild-type KIM-1 (Fig5F). KIM-1 ectodomain + TM in the absence of the cytodomain, however, was deficient in LC3 lipidation especially when cells were incubated with bafilomycin to prevent lysosomal degradation (Figs5G and H, and EV4). Therefore, the cytosolic tail of KIM-1 was dispensable for phagocytosis but necessary for LC3 lipidation. We next examined if KIM-1 phosphorylation played a role in KIM-1-induced LC3 lipidation and phagocytosis. Mutation of Y314 or Y350 to phenylalanine reduced KIM-1-mediated phagocytosis (Fig5I and J). The KIM-1 Y314F mutation more closely correlated with reduced lipidated LC3 levels (Fig5J and K). Mutation to the human KIM-1 mucin domain in a region similar to the mouse KIM-1Δmucin mutant, KIM-1Δ246-273, reduced phagocytosis (Fig5I). Mutation to the juxtamembrane region, KIM-1Δ278-273, which we previously reported to prevent KIM-1 shedding (Bailly et al, 2002; Zhang et al, 2007), did not have an effect on phagocytosis (Fig5I). These data suggest that KIM-1 phosphorylation regulates phagocytosis and LC3 lipidation.
Figure 5.

- A, B Immunofluorescence staining of KIM-1 using antibodies specific for the extracellular domain (KIM-1 E Ab, R&D clone 222414) and cytosolic domain (R9 KIM-1 C Ab, Bonventre Lab) (Ichimura et al, 1998, 2008; Bailly et al, 2002) in mouse kidney tissue following ischemic injury (A) or LLC-PK1 cells transfected with full-length mouse KIM-1 or the WFND/AAAA mutant (B). (Note, 5B was taken at the apical surface of the cell, which consists of numerous microvilli. Representative of four independent experiments).
- C Representative images from three independent experiments of wild-type KIM-1 co-localization with intracellular VAMP8 and VAMP5.
- D Representative images of apoptotic cell uptake in LLC-PK1 cells expressing full-length KIM-1 or KIM-1 ectodomain or cytodomain mutants.
- E Quantification of fluorescently labeled apoptotic cell uptake in LLC-PK1 cells expressing full-length KIM-1 or KIM-1 mutants. *P < 0.05, n = 3.
- F Immunoblot analysis of KIM-1 or the domain deletion mutants’ expression.
- G, H Immunoblot analysis of LC3 lipidation in LLC-PK1 cells expressing full-length KIM-1 or KIM-1 mutants. Note that in the blot shown, the samples were treated with 100 nM bafilomycin. *P = 0.0202. n = 3.
- I Quantification of fluorescently labeled apoptotic cell uptake in LLC-PK1 cells expressing full-length KIM-1 or KIM-1 mutants. *P < 0.05, n = 3.
- J, K Immunoblot analysis of the expression of KIM-1 mutants in LLC-PK1 cells and the level of LC3 lipidation. n = 3, *P = 0.0161.
- L Mouse KIM-1 or KIM-1 WFND/AAAA phosphorylation was examined by immunoprecipitating KIM-1 and probing for p-Tyr.
- M Representative images from 3 independent experiments of co-localization of KIM-1 and p85.
- N KIM-1 co-immunoprecipitation analysis of the interaction of p85 with human KIM-1.
- O KIM-1 co-immunoprecipitation analysis of the interaction of p85 with mouse KIM-1 and KIM-1Δmucin.
- P Immunoblot analysis of LC3 lipidation in wild-type of p85α/β double knockout MEFs. Right panel: quantification of immunoblots represented in 5P. *P = 0.0389 for WT control vs. WT apop. and 0.0012 for WT apop. vs. DKO apop..
Figure EV4.

KIM-1 ectodomain mutant does not localize with RFP-LC3
Representative images from three independent experiments of KIM-1 ectodomain + TM localization in the presence of Baf. Scale bar, 10 μm.
To test whether KIM-1 ligand-binding mutants have an altered phosphorylation response, we examined the phosphorylation status of wild-type mouse KIM-1 and KIM-1 WFND/AAAA. We found that wild-type KIM-1 was tyrosine phosphorylated and the WFND/AAAA mutant had greatly reduced phosphorylation, despite the fact it was expressed at higher levels (Fig5L). We examined whether KIM-1 co-localized with p85, a phosphoinositide 3-kinase regulatory subunit previously reported to be involved in KIM-1 signaling (de Souza et al, 2008). KIM-1 and p85 co-localized at apoptotic cells that were phagocytosed or in the process of being phagocytosed (Fig5M). p85 co-immunoprecipitated with wild-type human KIM-1 (Fig5N). Deletion of the mucin domain (KIM-1Δmucin) resulted in a marked reduction in the interaction with p85 (Fig5O). To determine if p85 plays a role in KIM-1-mediated LC3 lipidation, we examined the effect of KIM-1 overexpression on wt or p85 α/β double knockout (DKO) mouse embryonic fibroblasts (MEFs). Wt cells showed an increase in lipidated LC3 with KIM-1 overexpression, while p85 DKO cells did not (Fig5P). Taken together, these data support the model that KIM-1 ligand binding increases KIM-1 phosphorylation and interaction with p85 is necessary for KIM-1-induced LC3 lipidation.
KIM-1 phagosomes localize to multi-membrane structures
To evaluate KIM-1 phagosome processing, the ultrastructure of KIM-1 phagosomes was analyzed by electron microscopy (EM) to detect the presence of multi-membrane-bound phagosomes (Codogno et al, 2011; Randall-Demllo et al, 2013). Phagosomes were imaged at different stages of maturation. Initially, the phagocytic cup formed around the apoptotic cell debris (Fig6A). Importantly, at the initial phagocytic cup stage, the apoptotic cell membrane and phagocytic cell membrane were indistinguishable at > 150,000× by EM (Fig6A and data not shown). In subsequent early phagososomal stages, the phagosomes were also found to have only a single membrane (Fig6B left panels). At later stages following phagocytosis, phagocytosed apoptotic cell debris were surrounded by two membranes (Fig6B center panels and 6F) or multiple membranes (Fig6B right panels and 6F). We hypothesized that the multi-membrane structures were the last step before lyso-somal fusion and were not more prominent due to rapid degradation of these structures. Multi-membrane autophagosomes have been shown to form due to “repeated sequestration” but are generally rarely observed because they are rapidly degraded (Corcelle et al, 2007; Li et al, 2013). To test if the number of multi-membrane structures could be amplified, lysosomal degradation was inhibited with bafilomycin (Corcelle et al, 2007). Incubation with bafilomycin, which blocks lysosome acidification and fusion of autophagosomes to lysosomes (Yamamoto et al, 1998; Jahreiss et al, 2008; Klionsky et al, 2008), increased the number of multi-membrane phagosomes as well as phagosomes surrounded by distinct two membrane structures (Fig6C and F). Cells expressing a KIM-1 PS-binding domain mutant deficient in phagocytosis, WFND/AAAA, did not take up apoptotic cells and did not have phagosomes (Fig6D). To extend these results in vivo, immunogold staining for KIM-1 was performed in post-ischemic kidneys. KIM-1 localized to the brush border of PTCs (Fig6G second panel) as well as to intracellular membrane-bound vesicles (Fig6G third and fourth panels) (Kabeya et al, 2000, 2004). Co-immunogold labeling revealed that LC3 co-stained the same membrane-bound organelles as KIM-1 (Fig6H). (Tissues shown in Fig6G and H were processed using methods that preserve the antigen sites for immunogold staining. As a result of processing steps associated with Lowicryl embedding, cell membranes are difficult to discern, in contrast to standard TEM.). Lysosomal inhibition in vivo (1-time 1 mg/kg i.p. injection of bafilomycin 1 h before induction of ischemia) resulted in large multi-membrane bodies in wild-type KIM-1 proximal tubules (Fig6I left panels). In the KIM-1Δmucin mice, there were fewer and smaller multi-membrane bodies (Fig6I right panels, J and K).
Autophagy components are necessary for efficient phagosome maturation and LC3 lipidation
To determine if autophagy genes were necessary for phagosome maturation, we analyzed acidification of the phagosomes utilizing pHrodo red, a pH-sensitive fluorescent tag, in cells where autophagy genes were depleted by siRNA. KIM-1-expressing LLC-PK1 cells were transfected with siRNA against the autophagy genes encoding ATG5, Beclin1, ULK1, or scrambled siRNA (siScram). Cells were then incubated with apoptotic cells labeled with pHrodo red for 2 h. Unattached apoptotic cells were washed off and replaced with fresh media. In KIM-1-expressing cells, transfected with scrambled siRNA, internalized apoptotic cells showed increased red fluorescence, indicating that phagosomes fused with the lysosome, a process that peaked at ∼8 h. By contrast, cells transfected with siRNA against ATG5, Beclin1, or ULK1 had fewer fluorescent apoptotic cells (Fig7A) and reduced LC3 lipidation (Figs7B and EV5) at the same time point. The effect of autophagy gene knockdown on LC3 II levels was also evaluated in KIM-1-expressing TCMK mouse kidney tubular epithelial cells using different siRNAs against ATG5 or ULK1 (Fig7C). siRNAs against autophagy genes did not alter the uptake of apoptotic cells, indicating autophagy genes are not required for KIM-1-mediated phagocytosis (Fig7D). The effect of dominant negative (DN) ATG5 (RFP-ATG5-K130R) or DN ULK1 (GFP-ULK1-K46N) on LC3 lipidation was also tested. Compared to control cells not exposed to apoptotic cells, the addition of apoptotic cells to KIM-1-expressing cells resulted in increased LC3 II levels in the empty vector-transfected cells (Fig7E). Cells expressing either DN ATG5 or DN ULK1 did not have increased levels of LC3 II upon stimulation with apoptotic cells (Fig7E). Thus, KIM-1-induced LC3 lipidation was dependent on autophagy genes and KIM-1-regulated LC3 lipidation and autophagy are necessary for efficient phagosome maturation in kidney tubule cells.
Figure 7.

- A KIM-1-expressing LLC-PK1 cells were transfected with siRNAs against a scrambled sequence (siScram), Beclin1, ATG5, or ULK1, incubated with apoptotic cells fluorescently labeled with pH-sensitive pHrodo red for 2 h, and then washed and incubated for 8 h. Quantification of pHrodo fluorescence intensity over the time series is shown in the right panel. n = 5 20× fields from a representative experiment repeated three times.
- B, C Immunoblot analysis of LC3 lipidation in KIM-1-expressing LLC-PK1 cells (B) or TCMK cells (C) transfected with siRNA against autophagy genes and exposed to apoptotic (apop) cells or untreated (Co).
- D Quantification of phagocytosis of CellTracker green-labeled apoptotic cells by BUMPT cells transfected with siScram, siATG5, or siULK1.
- E Immunoblot analysis of LC3 lipidation in HEK293 cells expressing KIM-1 and DN ATG5 or DN ULK1, with or without apoptotic cell incubation.
- F Immunoblot analysis of pULK1 and pAMPK in LLC-PK1 cells transfected with empty vector or wild-type KIM-1 and incubated with control media or apoptotic cells, with or without compound C (10 μM). Right panel: Quantification of pULK1 levels. *P = 0.0176 for pcDNA vs. KIM-1 and P = 0.0145 for pcDNA apop vs. KIM-1 apop. n = 3.
- G, H Representative images (G) and fluorescent quantification (H) of pHrodo-stained apoptotic cells incubated with KIM-1-expressing LLC-PK1 cells in the presence of DMSO, Spautin1 (10 μM), or compound C (10 μM) and imaged over time. n = 10 fields from an representative experiment repeated three times.
- I Co-localization of GFP-LC3 with phagocytosed apoptotic cells in HEK293 cells expressing either RFP or RFP-DN-ATG5. Arrows indicate LC3 accumulation on an phagocytosed apoptotic cell.
- J Co-localization of RFP-LC3 with phagocytosed apoptotic cells in HEK293 cells expressing either GFP or GFP-DN-ULK1. Arrows indicate LC3 accumulation on an phagocytosed apoptotic cell. Arrowheads indicate areas of DN-ULK1 accumulation on apoptotic cell containing phagosomes.
- K, L Quantification of the percentage of DN ATG5- or DN ULK1-positive cells with phagosomes and the percentage of DN ATG5- or DN ULK1-positive cells with LC3-positive phagosomes, n ≥ 180 cells.
Figure EV5.

siRNA against autophagy genes inhibit KIM-1-induced LC3 lipidation
Immunoblot analysis of LC3 lipidation in LLC-PK1 cells transfected with KIM-1 and siRNAs against ATG5, ULK1, or Beclin1 and incubated with control media or apoptotic cells.
KIM-1 expression activates ULK1/ATG1 and dominant negative ATG5 or ULK1 blocks LC3 accumulation at the phagosome
Activation of ULK1 by phosphorylation at serine 555 is known to occur upon autophagy induction (Hamacher-Brady et al, 2007; Florey et al, 2011; Xiao et al, 2012). pULK1-S555 was increased in KIM-1-expressing LLC-PK1 cells treated with apoptotic cells compared to cells expressing the pcDNA empty vector (Fig7F). AMPK is known to phosphorylate ULK1 at S555 (Zou et al, 2014). AMPK was also phosphorylated with KIM-1 expression (Fig7F). The AMPK inhibitor, compound C, which is known to block AMPK-induced ULK1 phosphorylation (Zou et al, 2014), reduces the levels of phospho AMPK and ULK1, as well as total ULK1 (Fig7F). Compound C also reduced phagosome maturation (Fig7G and H). The autophagy inhibitor Spautin1 also inhibited phagosome maturation (Fig7G and H). ULK1 also localized to phagosomes (Fig EV6A). To determine if autophagy is required for LC3 accumulation at the autophagosome, human embryonic kidney cells (HEK293) co-expressing KIM-1 plus DN ATG5 and GFP-LC3 or DN ULK1 and RFP-LC3 were exposed to apoptotic cells. As overexpression of wild-type ATG5 or ULK1 can up- or down-modulate autophagy, respectively, cells expressing RFP or GFP plus GFP-LC3 or RFP-LC3, respectively, were used as controls (Hamacher-Brady et al, 2007; Hara et al, 2008). KIM-1-mediated phagocytosis was not affected by the expression of DN ATG5 (ATG5-K130R) or DN ULK1 (ULK1-K46N), indicating that the phagocytic function of KIM-1 does not require ATG5 or ULK1 (Fig7I–L). In cells expressing RFP or GFP, LC3 localized to phagocytosed apoptotic cells (Fig7I, J (upper panels), K and L). In cells expressing ATG5-K130R or ULK1-K46N, however, LC3 co-localization with phagocytosed apoptotic cells was greatly decreased (Fig7I, J (lower panels), K and L). Thus, LC3 localization to the phagosome requires functional ATG5 and ULK1.
Figure EV6.

- Cells were transfected with Myc-ULK1, incubated with apoptotic cells, and stained with anti-myc antibodies.
- Flow cytometric analysis of KIM-1 and MHC II expression on primary proximal tubule cells, analyzing cells which co-stained for KIM-1 and MHC. The majority of the cells positive for MHC II were also positive for KIM-1.
- LLC-PK1 cells were stained for KIM-1 (red) and DM (green) co-localization following phagocytosis of apoptotic cells (arrows). N = nucleus. Scale bar, 5 μm.
- Representative images of cells stained with OVA-MHC or Eα-MHC II antibodies described in Fig 8B and C. Scale bar, 10 μm.
KIM-1-dependent phagocytosis and induction of autophagy leads to antigen presentation
Approximately 80% of PTCs isolated from mice express MHC II by flow cytometry, raising the possibility that KIM-1-mediated phagocytosis and autophagy induction can regulate MHC antigen presentation (Fig8A). The majority of primary PTCs positive for MHC II were also positive for KIM-1 (Fig EV6B). To evaluate the role of KIM-1-mediated autophagy in antigen presentation, we first examined KIM-1 co-localization with the antigen processing machinery. DM acts as a peptide editor and is essential for the processing of antigens (Schulze & Wucherpfennig, 2012). DM co-localizes with KIM-1 in distinct subcellular structures (Fig6EVC). To analyze the ability of PTCs to present antigens, PTCs were incubated with OVA are Eα peptide. Cells were then treated with antibodies that recognized MHC I bound to OVA peptide or MHC II bound to Eα peptide. These antibodies only react with OVA or Eα when these peptides have been presented on MHC I or II, respectively. As controls, cells incubated with the MHC I OVA peptide were stained for MHC II presentation and cells incubated with MHC II Eα peptide were stained for MHC I presentation. Flow cytometric analysis revealed that MHC I cross-presentation and MHC II presentation occurred in KIM-1 wt primary cultured PTCs, and the presentation was greatly reduced in KIM-1Δmucin cells (Figs8B and C, and EV6D).
Figure 8.

- A Flow cytometric analysis of primary PTCs stained for MHC II (representative of three experiments).
- B, C Flow cytometric analysis of OVA-MHC I cross-presentation and Eα-MHC II presentation in primary cultured PTCs from wild-type KIM-1 or KIM-1Δmucin (representative of three independent experiments).
- D, E OT-II CD4+ (7AAD-) T cells were incubated with BUMPT PTCs expressing empty vector, wild-type mouse KIM-1 (mKIM-1), or mutant KIM-1Δmucin and proliferation as well as expansion of FoxP3.GFP Tregs were analyzed by flow cytometry.
- F OT-II CD4+ (7AAD-) T cells were flow sorted to remove the Foxp3.GFP+ cells and then incubated with BUMPT PTCs expressing wild-type or mutant KIM-1.
- G Absolute numbers of FoxP3+CD4+ regulatory T cells from CD4+ cells incubated with pcDH, mKIM-1, or KIM-1Δmucin.
- H, I Analysis of T-cell proliferation and Treg expansion from T cells incubated with KIM-1-expressing PTCs transfected with siRNA targeting autophagy genes.
- J, K Analysis of Foxp3+, CD4+, or CD8+ infiltrating cell in post-ischemic kidneys from wild-type mKIM-1 or KIM-1Δmucin (mut) mice.
To analyze the effect of PTC MHC presentation on T cells, naïve CD4+ T cells were isolated from OT-II transgenic mice, which respond to OVA presented on MHC II. Boston University mouse proximal tubule cells (BUMPT) (Sinha et al, 2005) were incubated with PS liposomes containing OVA for 2 h, washed extensively, and then incubated with CD4+ T cells pre-labeled with CellTrace Violet dye (Invitrogen) to allow cellular proliferation to be tracked through successive generations. After 48 h of incubation with wild-type KIM-1-expressing PTCs fed OVA liposomes, a greater percentage of CD4+ T cells display a naïve CD44lowCD62Lhigh phenotype (42.1 ± 1.7% in the wild-type vs. 29.8 ± 4.9% in the KIM-1Δmucin cells and 19.0 ± 6.9%, P < 0.05 in pcDH control PTCs). Furthermore, CD4+ T cells co-incubated with KIM-1-expressing PTCs proliferated less (Fig8D) and were enriched in FoxP3.GFP+ regulatory T cells (Tregs) by percentage (Fig8E) and absolute number (Fig8G). Removal of FoxP3+ Tregs from the T-cell population by flow sorting abolished the anti-proliferative effects of KIM-1-mediated MHC presentation (Fig8F). These data indicate that KIM-1-mediated MHC presentation maintains T cells in their naïve phenotype and reduces T-cell proliferation in a manner dependent on Tregs.
To evaluate the role of autophagy on the T-cell response, KIM-1-expressing BUMPT cells were transfected with siRNAs against ATG5 and ULK1. Compared to scrambled siRNA, knockdown of ATG5 or ULK1 led to greater CD4+ T-cell proliferation and a reduction in Tregs (Fig8H and I). Thus, KIM-1-induced phagocytosis leads to antigen presentation, but the recognition of antigen by T cells suppresses CD4+ T-cell activation and promotes expansion of tolerogenic Tregs, in an autophagy-dependent manner. To determine if functional KIM-1 could regulate Tregs in vivo, we analyzed T cells from post-ischemic kidney tissue from wild-type and KIM-1Δmucin mice. Mice expressing KIM-1Δmucin have fewer Foxp3+ Tregs and greater infiltration of CD4+ and CD8+ effector T cells (CD44high and CD62low) and lower Foxp3+ Tregs compared to wild-type mice, following ischemic injury (Fig8J and K).
Discussion
Epithelial cells, as semi-professional phagocytes, are often involved in clearance of apoptotic cells following tissue injury or remodeling, such as after kidney injury or during mammary involution (Erwig & Henson, 2007). Epithelial cell phagocytosis of neighboring cells reduces inflammation by removal of dead cells prior to recognition by lymphocytes, thus limiting immune cell infiltration, and through anti-inflammatory signaling induced by the uptake of apoptotic cells (Erwig & Henson, 2007). KIM-1/TIM-1 is a phosphatidylserine phagocytosis and scavenger receptor expressed by kidney proximal tubule epithelial cells and, at a much lower level, in a subset of immune cells (Ichimura & Mou, 2008; Ichimura et al, 2012). The phagocytic function of KIM-1 is best characterized in kidney tubular cells (Ichimura et al, 2008). In the injured kidney, KIM-1 is upregulated more than a thousand fold and aids in the recovery of organ injury through phagocytosis of apoptotic cells and cellular debris (Ichimura et al, 2008; Yang et al, 2015). Kidney injury in mice carrying a non-functional mutant KIM-1 results in a worsening of the injury with the accumulation of unphagocytosed apoptotic cells and increased inflammation (Yang et al, 2015). The current study provides mechanistic insight into how the phagocytic capability of epithelial cells that express KIM-1 can trigger a cascade of events that result in modulation of the immune response. KIM-1 expression and phagocytosis of apoptotic cells leads to increased LC3 lipidation. Lipidated LC3 encompasses the phagosome in a manner dependent on ATG5, Beclin1, and ULK1. Mutations to the KIM-1 sequence that prevent phagocytosis also block KIM-1 induction of LC3 lipidation. Material taken up by KIM-1 is processed and presented on MHC. Presented antigens result in a suppression of T-cell proliferation. These data indicate that phagocytosis mediated by KIM-1 expression in epithelial cells can limit inflammation by both removal of dead cells and induction of anti-inflammatory Treg signaling. To our knowledge, KIM-1 is the first epithelial receptor shown to mediate phagocytosis, enhance autophagy, and induce pro-tolerogenic antigen presentation.
We first characterized KIM-1 as an epithelial cell PS and scavenger receptor capable of transforming epithelial cells into phagocytes (Ichimura et al, 2008). KIM-1 protein is a type one transmembrane protein that contains an IgG domain, mucin domain, and cytosolic domain with two tyrosine phosphorylation sites. While KIM-1’s phagocytic function is known, the role of the different protein domains have not previously been characterized. Through mutagenesis studies, we have now defined the role of the major KIM-1 protein domains. First, we demonstrated in primary cultured proximal tubule epithelial cells that KIM-1 is the dominant apoptotic cell phagocytosis receptor by knocking down KIM-1 in these cells and quantifying apoptotic cell uptake. Mutation to the ligand-binding site, WFND, in the IgG domain or deletion of the majority of the mucin domain blocks KIM-1-mediated phagocytosis and LC3 lipidation. We next demonstrated that the ectodomain plus the transmembrane domain was sufficient to mediate phagocytosis but not LC3 lipidation. The cytodomain plus transmembrane alone domain did not regulate phagocytosis or LC3 lipidation. These data demonstrate that the extracellular + transmembrane domains of KIM-1 were sufficient for phagocytosis, while the full-length protein was necessary for processing of the phagosome via autophagy proteins.
PI3K regulatory subunit p85 is involved in KIM-1 phosphorylation-mediated signaling through interaction with the cystosolic domain (de Souza et al, 2008). p85 binding to p110 inhibits PI3K activity and promotes autophagy, and p85 depletion reduces autophagy in HEK293 cells (Kuchay et al, 2013). p85 is also known to regulate starvation-induced autophagy through IKK. In this pathway, phosphorylation of p85 in the SH2 domain leads to inhibition of PI3K and induction of autophagy (Comb et al, 2012). We explored the role of KIM-1 phosphorylation and p85 signaling in KIM-1-mediated phagocytosis and LC3 lipidation. The cytosolic KIM-1 phosphorylation sites were required for phagocytosis and LC3 lipidation. We also found that KIM-1 ligand-binding mutants have reduced phosphorylation, which correlated with decreased interaction with p85. Knockout of p85 prevented KIM-1-induced LC3 lipidation. These data provide the first evidence of a role of KIM-1 phosphorylation and interaction with p85 in KIM-1-mediated phagocytosis and autophagy induction.
Recent studies have demonstrated a role of non-canonical autophagy in cell corpse clearance, termed LC3-associated phagocytosis (LAP) (Sanjuan et al, 2007). In this clearance pathway, LC3 is targeted to the phagosome in an ATG5-, ATG7-, and Beclin1-dependent manner; however, this process does not involve the engagement of upstream autophagy proteins such as ULK1 (Sanjuan et al, 2007; Florey et al, 2011; Martinez et al, 2011; Kim et al, 2013b). The requirement for LAP, and not autophagy, for corpse degradation is not universal, however (Cadwell & Philips, 2013; Cheng et al, 2013; Parihar et al, 2013). In particular, a recent study in C. elegans demonstrated that many autophagy genes are required for corpse degradation, including ULK1, which was not implicated in LAP (Cheng et al, 2013). In our studies, EM immunogold staining revealed KIM-1-positive organelles characteristic of autophagy. The ROS inhibitor DPI which has been shown to block LC3 lipidation in LAP, but not autophagy, did not inhibit LC3 lipidation in our system. The process and timing of multi-membrane formation in our model is similar to what has been reported in autophagic clearance of intracellular bacteria, such as Listeria monocytogenes (Rich et al, 2003). siRNA against ULK1, as well as dominant negative ULK1, inhibited apoptotic cell clearance, LC3 lipidation, and LC3 localization to the phagosome induced by KIM-1 phagocytosis, implicating autophagy and not LAP. Also, unlike in LAP, KIM-1 expression induced phosphorylation and activation of ULK1/ATG1, which is essential for autophagosome formation. KIM-1 phagosomes are targeted by ubiquitin in a similar time course as LC3.
The current study highlights some fundamental differences between the uptake of apoptotic cells by semi-professional phagocytes compared to professional phagocytes. One notable difference between epithelial KIM-1 action and scavenger function in immune cells is the rate of maturation of the phagocyte. As measured by a decrease in pH of the phagosome, as it fuses with the lysosome, phagosome maturation occurs much faster in professional phagocytes compared to epithelial cells (Fig2EV compared to time courses in Fig7). In our study, using live cell imaging, LC3-positive vesicles were sometimes observed to localize around the phagosome before becoming a continuous ring (Figs2A and D, and EV3A). By EM, we observe discontinuous double membranes around phagosomes (FigEV3B). It has been reported in macrophages that bacteria are targeted by multiple vesicles that fuse to form a double-membrane autophagic vesicles (Rich et al, 2003). It is likely that epithelial cells employ a similar mechanism to surround the phagosome with a double membrane. This could also argue against the involvement of LAP in KIM-1-mediated phagocytosis. The theory behind LAP is that LC3 is recruited and directly inserted in the phagosomal membrane; on the other hand, we observe LC3-positive structures interacting with the phagosome. The finding that KIM-1-mediated phagocytosis is not associated with upregulated ROS production is novel and could explain many of the differences we observe in epithelial cell phagocytosis vs. that of professional phagocytes. For instance, maturation of phagosomes derived from KIM-1-mediated phagocytosis is slower than that in macrophages or dendritic cells. In professional phagocytes, NOX enzymes form an electron transport system on the phagosomal membranes to transfer electrons into the phagosome, generating ROS in the lumen (Cross & Segal, 2004). The ROS flux begins the degradation process and lowers the phagosomal pH, also quickening the degradation process (Cross & Segal, 2004). Phagosomal ROS production is necessary for LC3 recruitment in LAP (Huang & Brumell, 2009; Huang et al, 2009; Ma et al, 2012; Lam et al, 2013; Romao et al, 2013). Without the upregulation of ROS, epithelial cells likely need to utilize more of the autophagy machinery to degrade the phagocytosed cargo.
The biochemical assays performed to differentiate canonical autophagy from LAP suggest that canonical autophagy is responsible for LC3 localization to the phagosomes in PTCs; however, multi-membrane phagosomes only account for ˜10% of the phagosomes at a given time point. Under conditions of lysosomal inhibition, multi-membrane phagosomes become more prominent (Figs6C, F and I, and 9). Importantly, multi-membrane lamellar bodies have been shown to require autophagy for their formation (Baba et al, 1994; Hariri et al, 2000; Lajoie et al, 2005; Corcelle et al, 2007; Li et al, 2013) and form due to “repeated sequestration” of autophagosome membranes but are generally rarely observed because they are rapidly degraded (Corcelle et al, 2007; Li et al, 2013). These data suggest three possible hypotheses: (i) KIM-1 phagosomes are degraded by autophagy; (ii) KIM-1 phagosomes are degraded by LAP, but epithelial cells require more autophagy factors, such as ULK1, to induce LAP compared to professional phagocytes; (iii) Autophagosomes fuse together at the phagosome, coating the phagosome with LC3. We also observe that smaller autophagosomes tend to fuse at the phagosome to create an enveloped phagosome (Figs2A and D, and EV3A and B). Although a similar phenomenon has been proposed in macrophages for phagocytosis of bacteria (Rich et al, 2003), this would represent a novel mechanism by which autophagosomes generated in an ULK1-dependent manner target phagosomes for degradation in epithelial cells. We believe the data suggest that KIM-1 phagosomes are degraded by autophagy; however, we cannot completely rule out LAP, due to the fact that lysosomal inhibition is required to readily observe multi-membrane phagosome. Either hypothesis suggests that semi-professional phagocytes, such as epithelial cells, require more of the autophagy machinery to process phagocytosed material, likely due to the fact that epithelial cells have reduced ROS production in response to phagocytosis, limiting the clearance capacity of epithelial cells when compared to professional phagocytes.
Figure 9.

Schematic representation of KIM-1-mediated phagocytosis
KIM-1 coats the apical surface of PTCs and binds tightly to apoptotic cells. Following phagocytosis, the phagosome is then targeted by ULK1- and LC3-positive membranes, leading to lysosomal degradation. Antigens derived from apoptotic cells targeted for degradation via autophagy machinery are presented on MHC I and MHC II.
The links drawn by our results between phagocytosis, autophagy, and antigen presentation have important implications for immune responses associated with epithelial cell injury. Presentation of apoptotic cell self-antigens by macrophages and dendritic cells has been shown to be tolerogenic in steady-state conditions and crucial to the maintenance of peripheral T-cell tolerance. For instance, the presentation of apoptotic cell antigens have been shown to result in abortive T-cell proliferation and deletion (Kurts et al, 1997). Blockage of phagocytosis through genetic deletion or inhibition of key phagocytic proteins, such as milk fatty acid globule EGF factor 8, results in increased auto-antigen production (Nakayama et al, 2009; Albacker et al, 2010; Peng & Elkon, 2011; Baghdadi et al, 2013). Failure to take up apoptotic cells also leads to autoantibody production and autoimmune disease (Duffield et al, 2001; Nakayama et al, 2009). Our data demonstrate that, following phagocytosis in epithelial cells, phagosomes are targeted for degradation via the autophagy pathway, and material processed through autophagy is presented on MHC I and MHC II. While KIM-1-mediated uptake of apoptotic cells leads to enhanced MHC presentation, the resultant adaptive immune response is one of tolerance. We found that there was a decrease in T-cell proliferation in response to antigens processed in this manner and an associated increase in the number and percentage of Tregs. Knockdown of autophagy genes or removal of the Treg population reversed the anti-inflammatory phenotype, leading to greater T-cell proliferation. These data could help explain evidence that KIM-1 polymorphisms have been associated with autoimmune disease (Lee et al, 2011). Mice expressing a mutant KIM-1 protein spontaneously developed autoimmune disease and lupus-associated autoantigens (Lee et al, 2011; Xiao et al, 2012). KIM-1 recognition of apoptotic cells has been linked to experimental models of asthma (Kim et al, 2013a). Our findings, combined with these recent studies, strongly suggest that KIM-1-mediated apoptotic cell phagocytosis and antigen presentation help maintain self-tolerance.
In conclusion, we have shown that KIM-1-induced phagocytosis enhances autophagy and KIM-1 phagosomes are targeted to the autophagosome. KIM-1 phosphorylation and interaction with p85 are necessary for autophagy induction. KIM-1 induction of autophagy is dependent on ligand binding, involves phosphorylation of ULK1/ATG1, and leads to presentation of antigens on both MHC I and MHC II on the proximal tubule cell. Presentation of antigens derived from KIM-1 phagosomes is pro-tolerogenic, limiting T-cell proliferation by inducing Tregs. These data provide a hitherto unidentified link between epithelial injury, elimination of dead cells by autophagy, and regulation of the immune response via antigen presentation.
Materials and Methods
Materials
LLC-PK1, 769p, TCMK, HEK293 and 293T cells were purchased from ATCC. Boston University mouse proximal tubular (BUMPT) cells were originally from Dr. Steve Borkan (Sinha et al, 2005). Cell lines were routinely tested for mycoplasma (Mycoalert Mycoplasma Detection Kit, Lonza, Cat#LT07-318) and, in the case of kidney cells, the presence of species-specific/cell-type markers as well as growth and morphological characteristics of kidney tubular epithelial cells. DMEM, RPMI 1640, and DMEM/F12 were from Cellgro, and FBS was from Gibco. Anti-KIM-1 antibodies to the human and rodent cytosolic domain (1400 and R9) and human ectodomain (AKG7) were generated and profiled as described previously (Bonventre lab) (Ichimura et al, 1998, 2008; Bailly et al, 2002; Zhang et al, 2007; Humphreys et al, 2013), and secondary antibodies were from Jackson ImmunoReasearch Laboratories Inc. Anti-KIM-1 goat polyclonal antibody which reacted with mouse KIM-1 ectodomain was purchased from R&D Systems (Cat# AF1817). Anti-Myc antibody was purchased from the Brigham and Women’s Hospital antibody core facility. Anti-LC3 (for immunoblot of LLC-PK1 or human cell lysates) (clone D11), anti-pULK1 (clone D1H4 (Ser555)), total ULK1 (D8H5), AMPK (Cat# 2532), pAMPK (Cat# 2535), p62 (Cat# 5114), and anti-ATG5 (clone D5F5U) antibodies used for immunoblot were purchased from Cell Signaling. Note the LC3 antibody has a higher affinity for LC3 II, compared to LC3 I. Anti-phospho-tyrosine was purchased from Cell Signaling (Cat# 9411). Anti-LC3 for staining of mouse tissue and mouse LC3 immunoblots was purchased from Nanotools (Cat# 0231-100/LC3-5F10). Anti-DM (Cat# sc-32248) and anti-ERK (Cat# sc-154) were purchased from Santa Cruz Biotechnology. Matrigel was from BD Biosciences. Antibodies used for flow cytometry were purchased from eBiosciences and described under flow cytometry below. IFNγ was purchased from Peprotech. DPI chloride was from ENZO. Other reagents were from Sigma-Aldrich.
Plasmids and transfection
pcDNA3 was purchased from Invitrogen. Human KIM-1 and mouse KIM-1 were cloned into pcDNA3 as described previously (Bailly et al, 2002; Ichimura et al, 2008). WF/AA, ND/AA, and WFND/AAAA mutants were generated using Stratagene QuickChange mutagenesis kit using the following primers targeting amino acids 115–118 in mouse KIM-1 sequence: WF/AA forward 5′-GTCGAGTGGAGATTCCTGGAGCGGCTAATGATCAGAAAGTGACC-3′, reverse 5′-GGTCACTTTCTGATCATTAGCCGCTCCAGGAATCTCCACTCGAC-3′; ND/AA forward 5′-TTCCTGGATGGTTTGCTGCTCAGAAAGTGACCTTTTCATTGCAAG-3′, reverse 5′-CTTGCAATGAAAAGGTCACTTTCTGAGCAGCAAACCATCCAGGAA-3′; and WFND/AAAA forward 5′-GAGTGGAGATTCCTGGAGCGGCTGCTGCTCAGAAAGTGACCTTTTCATGC-3′, reverse 5′-GCATGAAAAGGTCACTTTCTGAGCAGCAGCCGCTCCAGGAATCTCCACTC-3′. shRNA plasmids were purchased from Dana-Farber/Harvard Cancer Center. shRNA sequences were shGFP 5′-GCAAGCTGACCCTGAAGTTCA-3′, and shKIM-1 5′-CCATGTACTTACTCAACATAT-3′, 5′-CTCAGGAGATACCTGGAGTAA-3′, and 5′-GTGGATTCTTATGTGGAAGTA-3′. Viruses were made using third-generation packaging system by transfecting pLKO.1 shRNA plasmids with pMDLg/pRRE, pMDLg/pRRE and pCMV-VSV-G (Addgene). pmRFP-LC3 (Addgene plasmid 21075 (Kimura et al, 2007)), DN ATG5 (pmCherry-ATG5-K130R (Addgene plasmid 13096 (Hamacher-Brady et al, 2007)) and GFP-LC3, Myc-ULK1 (Addgene plasmid #31960), or DN ULK1 (pMXs-IP-EGFP-ULK1(K46N) Addgene plasmid 38197 (Hara et al, 2008)) and ptfLC3 (Addgene plasmid 21074 (Kimura et al, 2007)), LAMP1-RFP (Addgene plasmid 1817 (Sherer et al, 2003)), and mRFP-Ub (Addgene number 11935 (Bergink et al, 2006)) were purchased from Addgene. VAMP5-YFP and VAMP8-YFP were purchased from ATCC. Transfections of pcDNA3, KIM-1, mKIM-1, mKIM-1 mutants, and viral constructs were carried out using Lipofectamine 2000 (Invitrogen) following the manufacture’s protocol. siRNA pools against mouse ATG5 and ULK1 were purchased from ThermoScientific and had the following sequences: ATG5-CCAAUUGGUUUACUAUUUG, CGAAUUCCAACUUGCUUUA, UUAGUGAGAUAUGGUUUGA, GCAUAAAAGUCAAGUGAUC. ULK1-CCACUCAGGUGCACAAUUA, UCACAAAGCCCUGCUAUUG, GCAUGGACUUUGAUGAAUU, and UUACGGACCUGCUGCUUAA. siRNAs used to knockdown ATG5, Beclin1, and ULK1 in LLC-PK1 cells were from Santa Cruz Biotechnology, and ATG5 and Beclin1 siRNAs were shown to be effective in LLC-PK1 (Yang et al, 2008): catalog numbers, ULK1 sc-44182, ATG5 sc-42446, and Beclin1 sc-29798. Non-targeting scrambled siRNA was ordered from Thermo-Scientific and had the following sequence: UGGUUUACAUGUCGACUAA. siRNAs were transfected with DharmaFECT reagent 2 according to the manufacturer’s instructions. It should be noted that transfections reagents can induce basal levels of autophagy (Klionsky et al, 2012). To mitigate this effect, transfections utilized endotoxin-free DNA and experiments were performed 48 h post-transfection to reduce transfection-dependent effects. Also, we used empty vector transfections as control for transfection experiments (Klionsky et al, 2012). siRNA transfections do not generally induce autophagy (Klionsky et al, 2012).
Cell culture
LLC-PK1, HEK293, BUMPT and 293T cells were cultured in DMEM supplemented with 10% FBS as described previously (Bailly et al, 2002; Ichimura et al, 2008). Stable cell lines expressing pcDNA or KIM-1 were generated as described previously (Bailly et al, 2002; Ichimura et al, 2008). Primary culture of murine kidney proximal tubule cells were cultured using established methods (Sheridan et al, 1993; Ichimura et al, 2008). Briefly, kidneys were isolated and the medulla was dissected away. The cortex was diced and digested in a solution of 0.5 mg/ml collagenase and trypsin inhibitor, which was bubbled with 95% O2 and 5% CO2, for 25 min at 37°C in a shaking waterbath. Collagenase reaction was terminated using FBS and glomeruli as well as undigested debris were separated by gravity for 1 min. Tubules were washed twice in tubule medium (DMEM/F12 supplemented with transferrin insulin, selenium, hydrocortisone and EGF) (Ichimura et al, 1998) and plated in Matrigel coated dishes. Media were changed every second day with fresh media. Cells were used between day 6 and day 8. For MHC presentation and T-cell activation assays, primary PTC media were supplemented with 100 ng/ml IFNγ for 24 h prior to beginning the experiment, but not during T-cell incubation.
Immunoblot analysis
Immunoblotting was carried out as described previously (Ichimura et al, 2008; Yang et al, 2010). Briefly, cells were lysed with SDS or RIPA buffer and prepared as described previously (Ichimura et al, 2008; Yang et al, 2010). SDS lysis buffer was used for LC3 blots. Protein concentrations were estimated using BCA assay (Pierce). Membranes were incubated with the appropriate antibody followed by species-appropriate secondary antibodies. Bands were revealed using chemiluminescence (Western Lightning; PerkinElmer). Band intensities were quantified using ImageJ.
Preparation of apoptotic cells
Apoptotic cells were prepared as described previously (Duffield et al, 2001; Ichimura et al, 2008). Briefly, thymuses were collected from 4- to 8-week-old C75BL6 mice and disrupted into a single-cell suspension. Thymocytes were incubated with dexamethasone (1 μmol/l) for 16 h in 10% FCS and antibiotics. Fluorescently labeled thymocytes were generated by incubation in serum-free DMEM with cell tracker 5-chloromethylfluorescein diacetate (CMFDA), dialkylaminostyryl (DiI), 9H-(1,3-dichloro-9,9-dimethylacridin-2-one-7-yl), succinimidyl ester (DDAO SE), or pHrodo Red (Molecular Probes) at 5 ng/ml at 37°C for 30 min prior to dexamethasone. Following incubation, an equal volume of 10% FBS DMEM was added to remove unbound dye. For some experiments, HEK293 cells were made apoptotic and used for phagocytosis assays. HEK293 apoptosis was induced by incubating cells in a Spectrolinker XL-1000 UV crosslinker for 180 s. HEK293 cells were stained as described above.
Phagocytosis assay
Phagocytosis of apoptotic cells was carried out as described previously (Ichimura et al, 2008). Briefly, LLC-PK1 or primary culture proximal tubule cells were incubated with CMFDA, DiI, or DDAO SE Cy5-labeled apoptotic thymocytes at a 1:4 ratio in full culture medium for the time indicated. Cells were then washed 3× with PBS and lysed in 0.1% Triton X-100 in PBS. Fluorescence of the lysates were analyzed using a scanning fluorometer (FlexStation; Molecular Probes).
Phagosome pull down
PS/PC-coated 2 μm latex beads were generated by mixing PC and PS at a 1:1 ratio (Avanti). The lipid mixture was desiccated until dry and was then resuspended in HBSS containing latex beads by sonication (Sigma). Kidney HEK293 or LLC-PK1 cells expressing pcDNA or KIM-1 were incubated with PS/PC-coated latex beads. After a 1-h incubation, cells were washed 2× with PBS and 1× PBS with 1 mM EDTA to remove beads attached but not phagocytosed. Homogenization buffer (250 mM sucrose, 10 mM HEPES-NaOH, 10 mM KCl, 1.5 mM MgCl2, 1 mM EDTA, and 1 mM EGTA; pH 7.2) was then added and cells were harvested by scraping. Cells were then homogenized with a tight Dounce homogenizer (Wheaton). Unbroken cells and debris were removed by 1,000 g centrifugation. Phagosomes containing latex beads were isolated by a sucrose gradient (10–60%) and 100,000 g centrifugation. The number of isolated phagocytes per condition was quantified by flow cytometry of fluorescent beads. Phagosomes were resuspended in SDS lysis buffer, loaded by bead number, and analyzed by immunoblot.
Flow cytometric analysis
Primary cultured PTCs were harvested with trypsin/EDTA solution and resuspended in 300 μl DMEM/10% FBS to quench the trypsin. The PTCs cells were fixed, blocked, and incubated with 0.5 μg/100 μl of APC-conjugated antibody against OVA257-264 (SIINFEKL) peptide bound to mouse MHC I (H-2Kb), mouse monoclonal antibody (eBioscience eBio25-D1.16), FITC-conjugated antibody against Ea52-68 peptide bound to mouse MHC II (I-Ab), mouse monoclonal (eBioscience eBio Y-Ae), or FITC-conjugated antibody against MHC II (eBioscience MS/114.15.2) for 30 min at room temperature, briefly washed with PBS, and resuspended in 300 μl 3% BSA in PBS. Stained cells were then subjected to flow cytometry (MACSQuant, Miltenyi Biotec) with standard flow analysis for surface antigens. Briefly, intact PTCs were identified by size using forward-scatter/side-scatter (FSC/SSC) ratio. Only intact PTCs were selected by size gating for analysis of fluorescence staining. Surface staining of MHC I or II presentation was identified by a shift in FITC (or APC) fluorescence. Data were analyzed by MACSQuantify software (Miltenyi Biotec). For analysis of T-cell populations from mouse kidney, kidney digestion and flow cytometry were performed as recently described (Yang et al, 2015). Briefly, mice were anesthetized, sacrificed, and perfused with ice-cold PBS for 2 min via the left ventricle. Kidneys were extracted, minced and incubated with collagenase type 1A (10 μg/ml) (Sigma) in DMEM/F12 for 30 min at 37°C with constant agitation. The collagenase reaction was quenched by the addition of ice-cold FBS and the suspension was passed through a 100-μm strainer (BD). Cells were pelleted by 1,000 g centrifugation for 5 min at 4°C. Cells were then resuspended in ACK (ammonium–chloride–potassium) lysing buffer (0.15 M NH4Cl, 10 mM KHCO3, and 0.1 mM Na2EDTA) for 5 min at room temperature to remove red blood cells. Cells were then collected by centrifugation at 1,000 g for 5 min at 4°C. The pellet was then washed with PBS containing 1% BSA and 0.1% sodium azide (Sigma), passed through a 40-μm cell strainer, and incubated with anti-mouse CD16/32, to block nonspecific Fc binding. Staining and flow cytometry were then performed as above.
MHC presentation and cross-presentation assays
Liposomes containing OVA 258–265 peptide or Eα 52–68 peptide were generated by mixing PC and PS at a 1:1 ratio. The lipid mixture was desiccated until dry and was then resuspended in HBSS containing 40 μg/ml of the respective peptides by sonication. The liposome mixture was then diluted 1:10 in tubular media and incubated with primary PTCs from C57BL/6 mice for 2 h. The unbound liposomes were washed off, and cells were incubated in full media for 24 h. Following incubation, cells were dissociated with trypsin (Invitrogen) and then washed with PBS, fixed in 4% PFA, and blocked in 5% BSA plus 0.01% Triton X-100 in PBS. Cells were then stained for total MHC II, MHC I bound to OVA peptide, MHC II bound to Eα peptide (eBioscience), and KIM-1 (R&D Systems) using specific antibodies and analyzed by flow cytometry. For negative controls, cells incubated with OVA peptide were stained for MHC II-Eα bound antibody and cells incubated with Eα peptide were stained for MHC I-OVA bound antibody.
CD4+ T cell culture and in vitro MHC presentation assay
OVA-containing liposomes were generated as described above for full-length OVA peptide and incubated with BUMPT cells expressing empty vector, pcDH, mouse KIM-1, or KIM-1Δmucin. Single-cell suspensions of splenocytes were made by mechanical dissociation of spleens and subsequent RBC lysis with ACK buffer (Invitrogen). CD4+ T cells (> 95% purity) were isolated from naïve B6.OTII mice using the CD4+ L3T4 T cell isolation kit (Miltenyi Biotec). In some experiments, Tregs were removed from the population by flow sorting for CD4+GFP.Foxp3− cells. Isolated CD4+ T cells were then labeled with CellTrace Violet dye (Invitrogen) according to the manufacturer’s protocol, to allow cellular proliferation to be tracked through successive generations by dye dilution. Labeled cells were then co-cultured with BUMPT PTCs (pre-loaded with OVA-containing PS-coated liposomes) at a ratio of 1:5 (1 million CD4 cells: 200,000 PTCs). After 48 h, T cells were further stained using fluorochrome-labeled mAbs against CD44 and CD62L (BD Pharmingen). Flow cytometric data were acquired on a FACSCanto and analyzed using FlowJo software (Tree Star).
Animals and ischemia reperfusion injury
C57BL/6 and B6C3F1 mice were purchased from Charles River Laboratories. C57BL/6 KIM-1Δmucin mice were a gift from Dr. Vijay Kuchroo (Xiao et al, 2012). B6.OTII mice were crossed with B6.Foxp3−GFPreporter mice and maintained as a breeding colony in our facility. These transgenic mice express the mouse alpha-chain and beta-chain T-cell receptor that pairs with the CD4 coreceptor and is specific for chicken ovalbumin 323–339 in the context of I-A b. All mouse work was performed in accordance with the animal use protocol approved by the Institutional Animal Care and User Committee of the Harvard Medical School. Mice aged 8–10 weeks and weighing 20–22 g were subjected to ischemia reperfusion injury. Ischemia was induced by the retroperitoneal approach as described previously (Park et al, 2003). Briefly, both kidneys were exposed by flank incisions, and the renal pedicles were clamped for 25 min at 37°C. Following surgery, 1 ml of warm saline (37°C) was injected intraperitoneally for volume supplement. Sham operations were performed by exposing both kidneys but without clamping of renal pedicles. In some experiments, bafilomycin A1 was injected as a 1-time 1 mg/kg i.p. injection of bafilomycin 1 h before the induction of ischemia. Unless otherwise noted, kidney tissue was collected at 24 h post IRI. For IRI surgeries, the surgeon was blinded as to the genotype and chose the order of surgery and animals to be used for sham or IRI injuries unsystematically. For EM and flow cytometry analysis of samples from animal experiments, the investigator imaging and quantifying the samples was not aware of the genotype of the mice or the experimental conditions.
Immunoprecipitation
For immunoprecipitation analysis of mouse KIM-1 HEK293, cells were transfected with empty vector, FLAG-tagged wild-type mouse KIM-1, FLAG-tagged KIM-1Δmucin, or FLAG–tagged KIM-1 WFND/AAAA using Lipofectamine 2000 following the manufacturer’s instructions (Invitrogen) and treated as described. For human KIM-1 IP, LLC-PK1 cells stably expressing KIM-1 were used. Cells were then lysed in a modified RIPA buffer, and the resulting lysate was used to for immunoprecipitation or co-immunoprecipitation analysis as previously described (Hsu et al, 2001). Briefly, detergent-free modified RIPA buffer was used to dilute lysate to a final concentration of 1 μg/μl in and pre-cleared with 20 μl protein A/G/L beads in a 50% slurry for 1 h at 4°C (BioVision, Milpitas CA). Lysate was then incubated with 0.5 μg chicken anti-FLAG antibody (Aves, Tigard OR) overnight at 4°C for precipitation of FLAG-tagged proteins or human KIM-1 cytodomain antibody for precipitation of KIM-1. Antibodies were precipitated with 20 μl protein A/G/L beads. The resulting precipitate was washed three times with PBS and once with PBS plus an additional 500 mM NaCl. The beads were then resuspended in sample buffer containing dithiothreitol (DTT) and boiled for 10 min. Precipitates were analyzed by immunoblot.
Standard TEM
Fixed specimens of kidney cortex were trimmed into small fragments, post-fixed with osmium tetroxide, dehydrated in serial ethanols, and embedded in epoxy resin. Semi-thin sections were cut at 1 mm and stained with toluidine blue for light microscopic examination. Ultrathin sections were cut at 80 nm, mounted on 200-mesh copper grids, treated with uranyl acetate and lead citrate, and examined in a JEOL JEM-1010 transmission electron microscope.
Immunogold EM
Tissue was fixed for 24 h in 4% paraformaldehyde in cacodylate buffer, dehydrated through a graded series of dimethylformamide solutions, and embedded in Lowicryl (Electron Microscopy Sciences). Thin sections at 80 nm were collected on Formvar-coated nickel grids. After blocking with donkey serum for 1 h, grids were incubated overnight with primary antibodies against KIM-1 (goat polycolonal, R&D Systems, 1:100) and/or LC3 (mouse monoclonal, Nanotools, 1:400). Grids were then washed and incubated with gold-conjugated secondary antibodies (Ted Pella) at 1:10 dilution for 1.5 h. After secondary antibody incubation, grids were washed and stained with uranyl acetate and lead citrate. Stained grids were examined, and photomicrographs were collected with a JEOL JEM-1020 transmission electron microscope.
Virus
shGFP and shKIM-1 viruses were generated by transfection of pMDLg/pRRE, pMDLg/pRRE, pCMV-VSV-G, and shGFP or shKIM-1 pLKO.1 into 293T cells. Media containing virus particles were collected at 48 and 72 h. For transduction of primary cultured proximal tubule cells, lentiviral particles were purified by ultracentrifugation of supernatants at 24,000 rpm in a Beckman SW40 Ti rotor. Optimal knockdown of KIM-1 was found to occur with a pool of shRNAs. Purified virus was diluted in primary PTC media with polybrene, 1:1,000, and added to PTCs.
Immunolabeling
LLC-PK1 and primary culture proximal tubule cells were grown on glass coverslips. Following treatment, cells were washed 2× with PBS and fixed with 4% PFA in PBS. Cells were then permeabilized with 0.1% Triton X-100 in PBS and stained with primary antibodies. Kidneys were flash-frozen in OCT (Sakura) and sectioned in a cryomicrotome. Sections were then warmed to room temperature and fixed in acetone. Kidney sections were then blocked with 5% BSA and 0.01% Triton X-100 in PBS. Sections were then stained with appropriate fluorescently labeled secondary antibodies.
Microscopy
Live cell imaging experiments were carried out on a Nikon Eclipse Ti inverted microscope in a humidified chamber and 5% CO2. Widefield fluorescence and phase contrast images were also obtained using a Nikon Eclipse Ti inverted microscope. Co-localization images were captured on a Nikon C1 confocal microscope. Images were analyzed using Volocity software (PerkinElmer). Pearson’s and Mander’s co-localization coefficients and fluorescence intensity line scans were calculated using Volocity’s built-in co-localization analysis. As KIM-1 and LC3 co-localize in the cytosol, subcellular regions of the cells were used in the analysis.
ROS measurement
ROS levels were assessed using 2′,7′-dichlorofluorescin diacetate (DCFH-DA). Briefly, LLC-PK1 cells were grown on 12-well plates and pre-loaded with DCFH-DA by incubation with 100 μM DCFH-DA in 5% FBS DMEM for 30 min at 37°C. Following pre-loading, cells were washed with PBS and incubated with 5% FBS DMEM with DMSO, APOP + DMSO, DPI, or APOP + DPI for 1 h at 37°C. Cells were then lysed with 90% DMSO and 10% PBS. Lysates were immediately transferred to 96-well plates, and fluorescence was measured at excitation 488 nm and emission 540 nm using a flexstation plate reader (Molecular Devices).
Analysis of autophagy by GFP-LC3 redistribution
Cells were transfected with GFP-LC3 and treated as indicated. Following treatment, cells were fixed with 4% paraformaldehyde and examined by fluorescence microscopy. Cells were considered to be undergoing autophagy if they had 10 or more small LC3-positive punctae (1–2 μm) or multiple large LC3-positive structures (> 5 μm) (Jiang et al, 2010). Cells were counted in four or more randomly selected fields for a total or > 100 cells for each condition. The experiment was repeated at least three independent times.
Statistics
Results were expressed as the mean ± standard deviation (SD). Data were analyzed using Prism 6 (GraphPad Software, La Jolla, CA). Student’s t-test was used to determine whether two groups were significantly different. Analysis of variance was used to compare groups of three or more. Tukey’s or Bonferroni’s multiple comparison test was used to determine the P-value. A P-value of < 0.05 was considered to be significantly different.
Acknowlegements
We would like to thank Dr. Vijay Kuchroo for the gift of the KIM-1Δmucin mice. We thank Dr. Lewis C. Cantley for the p85α/β wild-type and knockout MEFs. We thank Dr. Tamotsu Yoshimori for the pmRFP-LC3 and ptfLC3 constructs; Dr. Åsa B. Gustafsson for the pmCherry-ATG5-K130R construct; and Dr. Noboru Mizushima for the pMXs-IP-EGFP-ULK1 (K46N) and GFP-LC3 constructs. This work was supported by US National Institutes of Health (NIH) grants DK39773 and DK72381 to J.V.B. and DK088418 and DK099473 to C.R.B.
Author contributions
CRB and JVB designed the experiments and wrote the manuscript. CRB performed experiments, collected, and analyzed data. JVB supervised the project. TI performed primary cell culture of renal proximal tubule cells. MYY helped with analysis of T-cell activation. HC and JMH helped with EM immunogold staining and analysis. YSB assisted in the quantification of the EM data.
Conflict of interest
JVB and TI are co-inventors on KIM-1 patents that are assigned to Partners Healthcare and licensed by Partners to J and J, Sekisui, BiogenIdec, and a number of research reagent companies. The other authors declare that they have no conflict of interest.
Supporting Information
Expanded View Figures PDF
Video EV1
Video EV2
Video EV3
Video EV4
Video EV5
Video EV6
Review Process File
Source Data for Figure 1
Source Data for Figure 4
Source Data for Figure 5
Source Data for Figure 7
Source Data for Expanded View
References
- Albacker LA, Karisola P, Chang YJ, Umetsu SE, Zhou M, Akbari O, Kobayashi N, Baumgarth N, Freeman GJ, Umetsu DT, DeKruyff RH. TIM-4, a receptor for phosphatidylserine, controls adaptive immunity by regulating the removal of antigen-specific T cells. J Immunol. 2010;185:6839–6849. doi: 10.4049/jimmunol.1001360. [DOI] [PMC free article] [PubMed] [Google Scholar]
- Baba M, Takeshige K, Baba N, Ohsumi Y. Ultrastructural analysis of the autophagic process in yeast: detection of autophagosomes and their characterization. J Cell Biol. 1994;124:903–913. doi: 10.1083/jcb.124.6.903. [DOI] [PMC free article] [PubMed] [Google Scholar]
- Baghdadi M, Yoneda A, Yamashina T, Nagao H, Komohara Y, Nagai S, Akiba H, Foretz M, Yoshiyama H, Kinoshita I, Dosaka-Akita H, Takeya M, Viollet B, Yagita H, Jinushi M. TIM-4 glycoprotein-mediated degradation of dying tumor cells by autophagy Leads to reduced antigen presentation and increased immune tolerance. Immunity. 2013;39:1070–1081. doi: 10.1016/j.immuni.2013.09.014. [DOI] [PubMed] [Google Scholar]
- Bailly V, Zhang Z, Meier W, Cate R, Sanicola M, Bonventre JV. Shedding of kidney injury molecule-1, a putative adhesion protein involved in renal regeneration. J Biol Chem. 2002;277:39739–39748. doi: 10.1074/jbc.M200562200. [DOI] [PubMed] [Google Scholar]
- Bergink S, Salomons FA, Hoogstraten D, Groothuis TA, de Waard H, Wu J, Yuan L, Citterio E, Houtsmuller AB, Neefjes J, Hoeijmakers JH, Vermeulen W, Dantuma NP. DNA damage triggers nucleotide excision repair-dependent monoubiquitylation of histone H2A. Genes Dev. 2006;20:1343–1352. doi: 10.1101/gad.373706. [DOI] [PMC free article] [PubMed] [Google Scholar]
- Cadwell K, Philips JA. Autophagy meets phagocytosis. Immunity. 2013;39:425–427. doi: 10.1016/j.immuni.2013.08.027. [DOI] [PubMed] [Google Scholar]
- Chae SC, Song JH, Lee YC, Kim JW, Chung HT. The association of the exon 4 variations of Tim-1 gene with allergic diseases in a Korean population. Biochem Biophys Res Commun. 2003;312:346–350. doi: 10.1016/j.bbrc.2003.10.125. [DOI] [PubMed] [Google Scholar]
- Chae SC, Park YR, Song JH, Shim SC, Yoon KS, Chung HT. The polymorphisms of Tim-1 promoter region are associated with rheumatoid arthritis in a Korean population. Immunogenetics. 2005;56:696–701. doi: 10.1007/s00251-004-0743-5. [DOI] [PubMed] [Google Scholar]
- Cheng S, Wu Y, Lu Q, Yan J, Zhang H, Wang X. Autophagy genes coordinate with the class II PI/PtdIns 3-kinase PIKI-1 to regulate apoptotic cell clearance in C. elegans. Autophagy. 2013;9:2022–2032. doi: 10.4161/auto.26323. [DOI] [PubMed] [Google Scholar]
- Codogno P, Mehrpour M, Proikas-Cezanne T. Canonical and non-canonical autophagy: variations on a common theme of self-eating? Nat Rev. 2011;13:7–12. doi: 10.1038/nrm3249. [DOI] [PubMed] [Google Scholar]
- Comb WC, Hutti JE, Cogswell P, Cantley LC, Baldwin AS. p85alpha SH2 domain phosphorylation by IKK promotes feedback inhibition of PI3K and Akt in response to cellular starvation. Mol Cell. 2012;45:719–730. doi: 10.1016/j.molcel.2012.01.010. [DOI] [PMC free article] [PubMed] [Google Scholar]
- Corcelle E, Djerbi N, Mari M, Nebout M, Fiorini C, Fenichel P, Hofman P, Poujeol P, Mograbi B. Control of the autophagy maturation step by the MAPK ERK and p38: lessons from environmental carcinogens. Autophagy. 2007;3:57–59. doi: 10.4161/auto.3424. [DOI] [PubMed] [Google Scholar]
- Cross AR, Segal AW. The NADPH oxidase of professional phagocytes–prototype of the NOX electron transport chain systems. Biochim Biophys Acta. 2004;1657:1–22. doi: 10.1016/j.bbabio.2004.03.008. [DOI] [PMC free article] [PubMed] [Google Scholar]
- Duffield JS, Ware CF, Ryffel B, Savill J. Suppression by apoptotic cells defines tumor necrosis factor-mediated induction of glomerular mesangial cell apoptosis by activated macrophages. Am J Pathol. 2001;159:1397–1404. doi: 10.1016/S0002-9440(10)62526-6. [DOI] [PMC free article] [PubMed] [Google Scholar]
- Erwig LP, Henson PM. Immunological consequences of apoptotic cell phagocytosis. Am J Pathol. 2007;171:2–8. doi: 10.2353/ajpath.2007.070135. [DOI] [PMC free article] [PubMed] [Google Scholar]
- Florey O, Kim SE, Sandoval CP, Haynes CM, Overholtzer M. Autophagy machinery mediates macroendocytic processing and entotic cell death by targeting single membranes. Nat Cell Biol. 2011;13:1335–1343. doi: 10.1038/ncb2363. [DOI] [PMC free article] [PubMed] [Google Scholar]
- Fujita N, Itoh T, Omori H, Fukuda M, Noda T, Yoshimori T. The Atg16L complex specifies the site of LC3 lipidation for membrane biogenesis in autophagy. Mol Biol Cell. 2008;19:2092–2100. doi: 10.1091/mbc.E07-12-1257. [DOI] [PMC free article] [PubMed] [Google Scholar]
- Garcia-Lozano JR, Abad C, Escalera A, Torres B, Fernandez O, Garcia A, Sanchez-Roman J, Sabio JM, Ortego-Centeno N, Raya-Alvarez E, Nunez-Roldan A, Martin J, Gonzalez-Escribano MF. Identification of HAVCR1 gene haplotypes associated with mRNA expression levels and susceptibility to autoimmune diseases. Hum Genet. 2010;128:221–229. doi: 10.1007/s00439-010-0844-1. [DOI] [PubMed] [Google Scholar]
- Hamacher-Brady A, Brady NR, Logue SE, Sayen MR, Jinno M, Kirshenbaum LA, Gottlieb RA, Gustafsson AB. Response to myocardial ischemia/reperfusion injury involves Bnip3 and autophagy. Cell Death Differ. 2007;14:146–157. doi: 10.1038/sj.cdd.4401936. [DOI] [PubMed] [Google Scholar]
- Hara T, Takamura A, Kishi C, Iemura S, Natsume T, Guan JL, Mizushima N. FIP200, a ULK-interacting protein, is required for autophagosome formation in mammalian cells. J Cell Biol. 2008;181:497–510. doi: 10.1083/jcb.200712064. [DOI] [PMC free article] [PubMed] [Google Scholar]
- Hariri M, Millane G, Guimond MP, Guay G, Dennis JW, Nabi IR. Biogenesis of multilamellar bodies via autophagy. Mol Biol Cell. 2000;11:255–268. doi: 10.1091/mbc.11.1.255. [DOI] [PMC free article] [PubMed] [Google Scholar]
- Hsu SI, Yang CM, Sim KG, Hentschel DM, O’Leary E, Bonventre JV. TRIP-Br: a novel family of PHD zinc finger- and bromodomain-interacting proteins that regulate the transcriptional activity of E2F-1/DP-1. EMBO J. 2001;20:2273–2285. doi: 10.1093/emboj/20.9.2273. [DOI] [PMC free article] [PubMed] [Google Scholar]
- Huang J, Brumell JH. NADPH oxidases contribute to autophagy regulation. Autophagy. 2009;5:887–889. doi: 10.4161/auto.9125. [DOI] [PubMed] [Google Scholar]
- Huang J, Canadien V, Lam GY, Steinberg BE, Dinauer MC, Magalhaes MA, Glogauer M, Grinstein S, Brumell JH. Activation of antibacterial autophagy by NADPH oxidases. Proc Natl Acad Sci USA. 2009;106:6226–6231. doi: 10.1073/pnas.0811045106. [DOI] [PMC free article] [PubMed] [Google Scholar]
- Humphreys BD, Xu F, Sabbisetti V, Grgic I, Naini SM, Wang N, Chen G, Xiao S, Patel D, Henderson JM, Ichimura T, Mou S, Soeung S, McMahon AP, Kuchroo VK, Bonventre JV. Chronic epithelial kidney injury molecule-1 expression causes murine kidney fibrosis. J Clin Investig. 2013;123:4023–4035. doi: 10.1172/JCI45361. [DOI] [PMC free article] [PubMed] [Google Scholar]
- Ichimura T, Bonventre JV, Bailly V, Wei H, Hession CA, Cate RL, Sanicola M. Kidney injury molecule-1 (KIM-1), a putative epithelial cell adhesion molecule containing a novel immunoglobulin domain, is up-regulated in renal cells after injury. J Biol Chem. 1998;273:4135–4142. doi: 10.1074/jbc.273.7.4135. [DOI] [PubMed] [Google Scholar]
- Ichimura T, Asseldonk EJ, Humphreys BD, Gunaratnam L, Duffield JS, Bonventre JV. Kidney injury molecule-1 is a phosphatidylserine receptor that confers a phagocytic phenotype on epithelial cells. J Clin Investig. 2008;118:1657–1668. doi: 10.1172/JCI34487. [DOI] [PMC free article] [PubMed] [Google Scholar]
- Ichimura T, Mou S. Kidney injury molecule-1 in acute kidney injury and renal repair: a review. J Chin Integr Med. 2008;6:533–538. doi: 10.3736/jcim20080520. [DOI] [PubMed] [Google Scholar]
- Ichimura T, Brooks CR, Bonventre JV. Kim-1/Tim-1 and immune cells: shifting sands. Kidney Int. 2012;81:809–811. doi: 10.1038/ki.2012.11. [DOI] [PMC free article] [PubMed] [Google Scholar]
- Jahreiss L, Menzies FM, Rubinsztein DC. The itinerary of autophagosomes: from peripheral formation to kiss-and-run fusion with lysosomes. Traffic. 2008;9:574–587. doi: 10.1111/j.1600-0854.2008.00701.x. [DOI] [PMC free article] [PubMed] [Google Scholar]
- Jiang M, Liu K, Luo J, Dong Z. Autophagy is a renoprotective mechanism during in vitro hypoxia and in vivo ischemia-reperfusion injury. Am J Pathol. 2010;176:1181–1192. doi: 10.2353/ajpath.2010.090594. [DOI] [PMC free article] [PubMed] [Google Scholar]
- Kabeya Y, Mizushima N, Ueno T, Yamamoto A, Kirisako T, Noda T, Kominami E, Ohsumi Y, Yoshimori T. LC3, a mammalian homologue of yeast Apg8p, is localized in autophagosome membranes after processing. EMBO J. 2000;19:5720–5728. doi: 10.1093/emboj/19.21.5720. [DOI] [PMC free article] [PubMed] [Google Scholar]
- Kabeya Y, Mizushima N, Yamamoto A, Oshitani-Okamoto S, Ohsumi Y, Yoshimori T. LC3, GABARAP and GATE16 localize to autophagosomal membrane depending on form-II formation. J Cell Sci. 2004;117:2805–2812. doi: 10.1242/jcs.01131. [DOI] [PubMed] [Google Scholar]
- Kim HY, Chang YJ, Chuang YT, Lee HH, Kasahara DI, Martin T, Hsu JT, Savage PB, Shore SA, Freeman GJ, Dekruyff RH, Umetsu DT. T-cell immunoglobulin and mucin domain 1 deficiency eliminates airway hyperreactivity triggered by the recognition of airway cell death. J Allergy Clin Immunol. 2013a;132:414–425. doi: 10.1016/j.jaci.2013.03.025. e416. [DOI] [PMC free article] [PubMed] [Google Scholar]
- Kim JY, Zhao H, Martinez J, Doggett TA, Kolesnikov AV, Tang PH, Ablonczy Z, Chan CC, Zhou Z, Green DR, Ferguson TA. Noncanonical autophagy promotes the visual cycle. Cell. 2013b;154:365–376. doi: 10.1016/j.cell.2013.06.012. [DOI] [PMC free article] [PubMed] [Google Scholar]
- Kimura S, Noda T, Yoshimori T. Dissection of the autophagosome maturation process by a novel reporter protein, tandem fluorescent-tagged LC3. Autophagy. 2007;3:452–460. doi: 10.4161/auto.4451. [DOI] [PubMed] [Google Scholar]
- Klionsky DJ, Elazar Z, Seglen PO, Rubinsztein DC. Does bafilomycin A1 block the fusion of autophagosomes with lysosomes? Autophagy. 2008;4:849–850. doi: 10.4161/auto.6845. [DOI] [PubMed] [Google Scholar]
- Klionsky DJ, Abdalla FC, Abeliovich H, Abraham RT, Acevedo-Arozena A, Adeli K, Agholme L, Agnello M, Agostinis P, Aguirre-Ghiso JA, Ahn HJ, Ait-Mohamed O, Ait-Si-Ali S, Akematsu T, Akira S, Al-Younes HM, Al-Zeer MA, Albert ML, Albin RL, Alegre-Abarrategui J, et al. Guidelines for the use and interpretation of assays for monitoring autophagy. Autophagy. 2012;8:445–544. doi: 10.4161/auto.19496. [DOI] [PMC free article] [PubMed] [Google Scholar]
- Kobayashi N, Karisola P, Pena-Cruz V, Dorfman DM, Jinushi M, Umetsu SE, Butte MJ, Nagumo H, Chernova I, Zhu B, Sharpe AH, Ito S, Dranoff G, Kaplan GG, Casasnovas JM, Umetsu DT, Dekruyff RH, Freeman GJ. TIM-1 and TIM-4 glycoproteins bind phosphatidylserine and mediate uptake of apoptotic cells. Immunity. 2007;27:927–940. doi: 10.1016/j.immuni.2007.11.011. [DOI] [PMC free article] [PubMed] [Google Scholar]
- Kuchay S, Duan S, Schenkein E, Peschiaroli A, Saraf A, Florens L, Washburn MP, Pagano M. FBXL2- and PTPL1-mediated degradation of p110-free p85beta regulatory subunit controls the PI(3)K signalling cascade. Nat Cell Biol. 2013;15:472–480. doi: 10.1038/ncb2731. [DOI] [PMC free article] [PubMed] [Google Scholar]
- Kurts C, Kosaka H, Carbone FR, Miller JF, Heath WR. Class I-restricted cross-presentation of exogenous self-antigens leads to deletion of autoreactive CD8(+) T cells. J Exp Med. 1997;186:239–245. doi: 10.1084/jem.186.2.239. [DOI] [PMC free article] [PubMed] [Google Scholar]
- Lajoie P, Guay G, Dennis JW, Nabi IR. The lipid composition of autophagic vacuoles regulates expression of multilamellar bodies. J Cell Sci. 2005;118:1991–2003. doi: 10.1242/jcs.02324. [DOI] [PubMed] [Google Scholar]
- Lam GY, Cemma M, Muise AM, Higgins DE, Brumell JH. Host and bacterial factors that regulate LC3 recruitment to Listeria monocytogenes during the early stages of macrophage infection. Autophagy. 2013;9:985–995. doi: 10.4161/auto.24406. [DOI] [PMC free article] [PubMed] [Google Scholar]
- Lee J, Phong B, Egloff AM, Kane LP. TIM polymorphisms–genetics and function. Genes Immun. 2011;12:595–604. doi: 10.1038/gene.2011.75. [DOI] [PMC free article] [PubMed] [Google Scholar]
- Li XZ, Sui CY, Chen Q, Chen XP, Zhang H, Zhou XP. Promotion of autophagy at the maturation step by IL-6 is associated with the sustained mitogen-activated protein kinase/extracellular signal-regulated kinase activity. Mol Cell Biochem. 2013;380:219–227. doi: 10.1007/s11010-013-1676-9. [DOI] [PubMed] [Google Scholar]
- Ma J, Becker C, Lowell CA, Underhill DM. Dectin-1-triggered recruitment of light chain 3 protein to phagosomes facilitates major histocompatibility complex class II presentation of fungal-derived antigens. J Biol Chem. 2012;287:34149–34156. doi: 10.1074/jbc.M112.382812. [DOI] [PMC free article] [PubMed] [Google Scholar]
- Martinez J, Almendinger J, Oberst A, Ness R, Dillon CP, Fitzgerald P, Hengartner MO, Green DR. Microtubule-associated protein 1 light chain 3 alpha (LC3)-associated phagocytosis is required for the efficient clearance of dead cells. Proc Natl Acad Sci USA. 2011;108:17396–17401. doi: 10.1073/pnas.1113421108. [DOI] [PMC free article] [PubMed] [Google Scholar] [Retracted]
- McIntire JJ, Umetsu DT, DeKruyff RH. TIM-1, a novel allergy and asthma susceptibility gene. Springer Semin Immunopathol. 2004;25:335–348. doi: 10.1007/s00281-003-0141-3. [DOI] [PubMed] [Google Scholar]
- Nakayama M, Akiba H, Takeda K, Kojima Y, Hashiguchi M, Azuma M, Yagita H, Okumura K. Tim-3 mediates phagocytosis of apoptotic cells and cross-presentation. Blood. 2009;113:3821–3830. doi: 10.1182/blood-2008-10-185884. [DOI] [PubMed] [Google Scholar]
- Oczypok EA, Oury TD, Chu CT. It’s a cell-eat-cell world: autophagy and phagocytosis. Am J Pathol. 2013;182:612–622. doi: 10.1016/j.ajpath.2012.12.017. [DOI] [PMC free article] [PubMed] [Google Scholar]
- Page NS, Jones G, Stewart GJ. Genetic association studies between the T cell immunoglobulin mucin (TIM) gene locus and childhood atopic dermatitis. Int Arch Allergy Immunol. 2006;141:331–336. doi: 10.1159/000095459. [DOI] [PubMed] [Google Scholar]
- Parihar SP, Guler R, Khutlang R, Lang DM, Hurdayal R, Mhlanga MM, Suzuki H, Marais AD, Brombacher F. Statin therapy reduces the Mycobacterium tuberculosis burden in human macrophages and in mice by enhancing autophagy and phagosome maturation. J Infect Dis. 2013;209:754–763. doi: 10.1093/infdis/jit550. [DOI] [PubMed] [Google Scholar]
- Park KM, Byun JY, Kramers C, Kim JI, Huang PL, Bonventre JV. Inducible nitric-oxide synthase is an important contributor to prolonged protective effects of ischemic preconditioning in the mouse kidney. J Biol Chem. 2003;278:27256–27266. doi: 10.1074/jbc.M301778200. [DOI] [PubMed] [Google Scholar]
- Peng Y, Elkon KB. Autoimmunity in MFG-E8-deficient mice is associated with altered trafficking and enhanced cross-presentation of apoptotic cell antigens. J Clin Investig. 2011;121:2221–2241. doi: 10.1172/JCI43254. [DOI] [PMC free article] [PubMed] [Google Scholar]
- Poon IK, Lucas CD, Rossi AG, Ravichandran KS. Apoptotic cell clearance: basic biology and therapeutic potential. Nat Rev Immunol. 2014;14:166–180. doi: 10.1038/nri3607. [DOI] [PMC free article] [PubMed] [Google Scholar]
- Randall-Demllo S, Chieppa M, Eri R. Intestinal epithelium and autophagy: partners in gut homeostasis. Front Immunol. 2013;4:301. doi: 10.3389/fimmu.2013.00301. [DOI] [PMC free article] [PubMed] [Google Scholar]
- Rich KA, Burkett C, Webster P. Cytoplasmic bacteria can be targets for autophagy. Cell Microbiol. 2003;5:455–468. doi: 10.1046/j.1462-5822.2003.00292.x. [DOI] [PubMed] [Google Scholar]
- Romao S, Gasser N, Becker AC, Guhl B, Bajagic M, Vanoaica D, Ziegler U, Roesler J, Dengjel J, Reichenbach J, Munz C. Autophagy proteins stabilize pathogen-containing phagosomes for prolonged MHC II antigen processing. J Cell Biol. 2013;203:757–766. doi: 10.1083/jcb.201308173. [DOI] [PMC free article] [PubMed] [Google Scholar]
- Sanjuan MA, Dillon CP, Tait SW, Moshiach S, Dorsey F, Connell S, Komatsu M, Tanaka K, Cleveland JL, Withoff S, Green DR. Toll-like receptor signalling in macrophages links the autophagy pathway to phagocytosis. Nature. 2007;450:1253–1257. doi: 10.1038/nature06421. [DOI] [PubMed] [Google Scholar]
- Santiago C, Ballesteros A, Martinez-Munoz L, Mellado M, Kaplan GG, Freeman GJ, Casasnovas JM. Structures of T cell immunoglobulin mucin protein 4 show a metal-Ion-dependent ligand binding site where phosphatidylserine binds. Immunity. 2007;27:941–951. doi: 10.1016/j.immuni.2007.11.008. [DOI] [PMC free article] [PubMed] [Google Scholar]
- Schulze MS, Wucherpfennig KW. The mechanism of HLA-DM induced peptide exchange in the MHC class II antigen presentation pathway. Curr Opin Immunol. 2012;24:105–111. doi: 10.1016/j.coi.2011.11.004. [DOI] [PMC free article] [PubMed] [Google Scholar]
- Sherer NM, Lehmann MJ, Jimenez-Soto LF, Ingmundson A, Horner SM, Cicchetti G, Allen PG, Pypaert M, Cunningham JM, Mothes W. Visualization of retroviral replication in living cells reveals budding into multivesicular bodies. Traffic. 2003;4:785–801. doi: 10.1034/j.1600-0854.2003.00135.x. [DOI] [PubMed] [Google Scholar]
- Sheridan AM, Schwartz JH, Kroshian VM, Tercyak AM, Laraia J, Masino S, Lieberthal W. Renal mouse proximal tubular cells are more susceptible than MDCK cells to chemical anoxia. Am J Physiol. 1993;265:F342–F350. doi: 10.1152/ajprenal.1993.265.3.F342. [DOI] [PubMed] [Google Scholar]
- Sinha D, Wang Z, Ruchalski KL, Levine JS, Krishnan S, Lieberthal W, Schwartz JH, Borkan SC. Lithium activates the Wnt and phosphatidylinositol 3-kinase Akt signaling pathways to promote cell survival in the absence of soluble survival factors. Am J Physiol. 2005;288:F703–F713. doi: 10.1152/ajprenal.00189.2004. [DOI] [PubMed] [Google Scholar]
- de Souza AJ, Oak JS, Jordanhazy R, DeKruyff RH, Fruman DA, Kane LP. T cell Ig and mucin domain-1-mediated T cell activation requires recruitment and activation of phosphoinositide 3-kinase. J Immunol. 2008;180:6518–6526. doi: 10.4049/jimmunol.180.10.6518. [DOI] [PMC free article] [PubMed] [Google Scholar]
- Xiao S, Brooks CR, Zhu C, Wu C, Sweere JM, Petecka S, Yeste A, Quintana FJ, Ichimura T, Sobel RA, Bonventre JV, Kuchroo VK. Defect in regulatory B-cell function and development of systemic autoimmunity in T-cell Ig mucin 1 (Tim-1) mucin domain-mutant mice. Proc Natl Acad Sci USA. 2012;109:12105–12110. doi: 10.1073/pnas.1120914109. [DOI] [PMC free article] [PubMed] [Google Scholar]
- Xu JR, Yang Y, Liu XM, Sun JY, Wang YJ. Polymorphisms of the TIM-1 gene are associated with rheumatoid arthritis in the Chinese Hui minority ethnic population. Genet Mol Res. 2012;11:61–69. doi: 10.4238/2012.January.9.7. [DOI] [PubMed] [Google Scholar]
- Yamamoto A, Tagawa Y, Yoshimori T, Moriyama Y, Masaki R, Tashiro Y. Bafilomycin A1 prevents maturation of autophagic vacuoles by inhibiting fusion between autophagosomes and lysosomes in rat hepatoma cell line, H-4-II-E cells. Cell Struct Funct. 1998;23:33–42. doi: 10.1247/csf.23.33. [DOI] [PubMed] [Google Scholar]
- Yang C, Kaushal V, Shah SV, Kaushal GP. Autophagy is associated with apoptosis in cisplatin injury to renal tubular epithelial cells. Am J Physiol. 2008;294:F777–F787. doi: 10.1152/ajprenal.00590.2007. [DOI] [PubMed] [Google Scholar]
- Yang L, Besschetnova TY, Brooks CR, Shah JV, Bonventre JV. Epithelial cell cycle arrest in G2/M mediates kidney fibrosis after injury. Nat Med. 2010;16:535–543. doi: 10.1038/nm.2144. [DOI] [PMC free article] [PubMed] [Google Scholar]
- Yang L, Brooks CR, Xiao S, Sabbisetti V, Yeung MY, Hsiao LL, Ichimura T, Kuchroo V, Bonventre JV. KIM-1-mediated phagocytosis reduces acute injury to the kidney. J Clin Investig. 2015;125:1620–1636. doi: 10.1172/JCI75417. [DOI] [PMC free article] [PubMed] [Google Scholar]
- Zhang Z, Humphreys BD, Bonventre JV. Shedding of the urinary biomarker kidney injury molecule-1 (KIM-1) is regulated by MAP kinases and juxtamembrane region. J Am Soc Nephrol. 2007;18:2704–2714. doi: 10.1681/ASN.2007030325. [DOI] [PubMed] [Google Scholar]
- Zou Y, Wang Q, Li B, Xie B, Wang W. Temozolomide induces autophagy via ATMAMPKULK1 pathways in glioma. Mol Med Rep. 2014;10:411–416. doi: 10.3892/mmr.2014.2151. [DOI] [PubMed] [Google Scholar]
Associated Data
This section collects any data citations, data availability statements, or supplementary materials included in this article.
Supplementary Materials
Expanded View Figures PDF
Video EV1
Video EV2
Video EV3
Video EV4
Video EV5
Video EV6
Review Process File
Source Data for Figure 1
Source Data for Figure 4
Source Data for Figure 5
Source Data for Figure 7
Source Data for Expanded View