

Abstract
Foodborne illness estimates help to set food safety priorities and create public health policies. The Public Health Agency of Canada estimates that 4 million episodes of foodborne illness occur each year in Canada due to 30 known pathogens and unspecified agents. The main objective of this study was to estimate the number of domestically acquired foodborne illness–related hospitalizations and deaths. Using the estimates of foodborne illness for Canada along with data from the Canadian Hospitalization Morbidity Database (for years 2000–2010) and relevant international literature, the number of hospitalizations and deaths for 30 pathogens and unspecified agents were calculated. Analysis accounted for under-reporting and underdiagnosis. Estimates of the proportion foodborne and the proportion travel-related were incorporated for each pathogen. Monte Carlo simulations were performed to account for uncertainty generating mean estimates and 90% probability intervals. It is estimated that each year there are 4000 hospitalizations (range 3200–4800) and 105 (range 75–139) deaths associated with domestically acquired foodborne illness related to 30 known pathogens and 7600 (range 5900–9650) hospitalizations and 133 (range 77–192) deaths associated with unspecified agents, for a total estimate of 11,600 (range 9250–14,150) hospitalizations and 238 (range 155–323) deaths associated with domestically acquired foodborne illness in Canada. Key pathogens associated with these hospitalizations or deaths include norovirus, nontyphoidal Salmonella spp., Campylobacter spp., VTEC O157 and Listeria monocytogenes. This is the first time Canada has established pathogen-specific estimates of domestically acquired foodborne illness–related hospitalizations and deaths. This information illustrates the substantial burden of foodborne illness in Canada.
Introduction
Foodborne diseases are a major cause of illness in Canada, with an estimated 4 million episodes of domestically acquired illness occurring each year (Thomas et al., 2013). Though symptoms are typically mild and self-limiting, hospitalizations and deaths can occur. Estimates of the number of episodes of illness and resulting hospitalizations and deaths are important for public health decision makers. Previous estimates of hospitalizations and deaths related to foodborne illnesses have been made by other countries but this is the first time these values have been estimated for Canada (Mead et al., 1999; Adak et al., 2005; Hall et al., 2005; Vaillant et al., 2005; Helms et al., 2006; Cressey et al., 2011; Scallan et al., 2011a, b; Havelaar et al., 2012; Kirk et al., 2014).
The occurrence of under-ascertainment of hospitalizations and deaths related to foodborne illnesses is similar to that of episodes of foodborne illness (Mead et al., 1999; Scallan et al., 2011b), though to a lesser extent due to severity. The capture of a case in a hospitalization or death registry or surveillance database requires that a specimen (stool, blood, or urine) be submitted and that the positive test result be recorded and reported to the proper surveillance system. Thus, for any burden estimate, it is necessary to account for loss of these cases.
The Public Health Agency of Canada recently generated estimates of the number of cases of foodborne illness related to 30 pathogens and unspecified agents similar to that published by the United States Centers for Diseases Control and Prevention (US CDC) (Scallan et al., 2011a, b; Thomas et al., 2013). Building on these estimates, the objectives of this work are to estimate the number of domestically acquired foodborne illness–related hospitalizations and deaths associated with the same 30 pathogens and unspecified agents in Canada while identifying data gaps and areas for future research.
Methods
The approach used by the U.S. CDC (Scallan et al., 2011a, b) and the Canadian estimates of foodborne illness provided the basis for this work (Thomas et al., 2013). Hospitalizations and deaths associated with the same 30 pathogens used in the Canadian estimates of foodborne illness were calculated as well as those associated with unspecified agents (Thomas et al., 2013).
Analytical approach
Estimates were developed from stochastic models to consider uncertainty of the input values. As previously described (Thomas et al., 2013), data sources were focused on the 2000–2010 time period and all estimates were based on the approximate Canadian population in 2006 (32,500,000 people) as a midpoint of the selected time period (Statistics Canada, 2008). In general, the methodological approach used hospitalizations and deaths that were either identified in a surveillance database (Approach 1) or as a proportion of laboratory-confirmed cases (Approach 2), and were then scaled up to account for under-reporting (Tables 1 and 2). Alternative approaches were used to estimate hospitalizations and deaths related to viruses. Detailed inputs and modeling approaches for each pathogen are provided in Supplementary Table S1 (Supplementary Data are available online at www.liebertpub.com/fpd).
Table 1.
Data Sources and General Methodological Approach for Estimating the Number of Hospitalizations Related to Domestically Acquired Foodborne Illness Associated with 30 Pathogens, Canada, Circa 2006
| CIHI-HMDB | ||||
|---|---|---|---|---|
| Multiple diagnostic codes, 2000–2010 | Multiple diagnostic codes, 2007–2010 | Most responsible diagnosis code, 2000–2010 | Proportion hospitalized of laboratory confirmed cases | Other methods |
| Brucella spp. | Bacillus cereus | Hepatitis A | Clostridium botulinum | Adenovirus |
| Clostridium perfringens | Campylobacter spp. | Cyclospora cayetanensis | Astrovirus | |
| Giardia sp. | Cryptosporidium spp. | Vibrio spp. other | Norovirus | |
| Salmonella spp., nontyphoidal | VTEC O157 | Vibrio parahaemolyticus | Rotavirus | |
| Shigella spp. | Escherichia coli, other diarrheagenic | Vibrio vulnificus | Sapovirus | |
| Staphylococcus aureus | ETEC | |||
| Trichinella spp. | VTEC non-O157 | |||
| Vibrio cholerae | Listeria monocytogenes | |||
| Salmonella Typhi | ||||
| Toxoplasma gondii | ||||
| Yersinia enterocolitica | ||||
CIHI, Canadian Institute for Health Information; HMDB, Hospital Morbidity Database; VTEC, verotoxin-producing E. coli; ETEC, enterotoxigenic E. coli.
Table 2.
Data Sources and General Methodological Approach for Estimating the Number of Deaths Related to Domestically Acquired Foodborne Illness Associated with 30 Pathogens, Canada, Circa 2006
| CIHI-HMDB | |||
|---|---|---|---|
| Multiple diagnostic codes, 2000–2010 | Multiple diagnostic codes, 2007–2010 | Proportion died of laboratory- confirmed or hospitalized cases | Other methods |
| Brucella spp. | Bacillus cereus | Clostridium botulinum | |
| Clostridium perfringens | Campylobacter spp. | Cyclospora cayetanensis | |
| Giardia sp. | Cryptosporidium spp. | Hepatitis Aa | Norovirus |
| Salmonella spp., nontyphoidal | VTEC O157 | Vibrio spp. other | |
| Shigella spp. | Escherichia coli, other diarrheagenic | Vibrio parahaemolyticus | |
| Staphylococcus aureus | ETEC | Vibrio vulnificus | |
| Trichinella spp. | VTEC non-O157 | Adenovirus | |
| Vibrio cholerae | Listeria monocytogenes | Astrovirus | |
| Salmonella Typhi | Rotavirus | ||
| Toxoplasma gondii | Sapovirus | ||
| Yersinia enterocolitica | |||
Mortality rate was based on hospitalized cases.
CIHI, Canadian Institute for Health Information; HMDB, Hospital Morbidity Database; VTEC, verotoxin-producing E. coli; ETEC, enterotoxigenic E. coli.
Hospitalizations and deaths
The first approach (20 pathogens for hospitalizations and 19 pathogens for deaths) relied on the number of hospitalizations and death discharges recorded in the Hospital Morbidity Database (HMDB) maintained by the Canadian Institute for Health Information (CIHI) (Fig. 1 and Table 1) (HMDB, 2000–2010). This is a national database that captures administrative, clinical, and demographic information on inpatient events from acute care hospitals in Canada that includes data from all provinces and territories. Codes from the International Classification of Diseases (ICD), 9th and 10th Revisions, were used to extract hospital discharge data from HMDB. Conversion from the ICD 9 to ICD 10 diagnostic coding was phased in over time by province/territory, with all provinces/territories using ICD 10 by 2007. Thus, depending on the pathogen, a combination of ICD 9 and ICD 10 and 2000–2010 or 2007–2010 data were used. The first 16 diagnostic codes were extracted for each hospital admission to identify pathogen diagnostic codes (Supplementary Table S1), and discharge disposition of each hospitalization was used to identify deaths. Diagnoses codes found in the ICD10 intestinal infectious and parasitic diseases category (A00-A09) were used most often, in addition to other codes depending on the pathogen. For hepatitis A virus, only the most responsible diagnosis code was used to estimate the number of hospitalizations (Canuel et al., 2007); deaths were estimated using the second approach described below. The most responsible diagnosis for a hospitalization pertains to one diagnosis or condition that can be described as being most responsible for the patient's stay in the hospital (or most responsible for the greatest portion of the length of stay or greatest use of resources). Readmissions within 30 days of original hospital admission were counted as a single hospitalization. Additionally, as the ICD 9 and 10 coding does not distinguish E. coli by subtype into the four categories used in these estimates (verotoxin-producing E. coli [VTEC] O157, VTEC non-O157, enterotoxigenic E. coli [ETEC], and diarrheagenic E. coli other than VTEC or ETEC), hospitalizations and deaths associated with E. coli were categorized to fit these four case definitions (Supplementary Table S1).
FIG. 1.
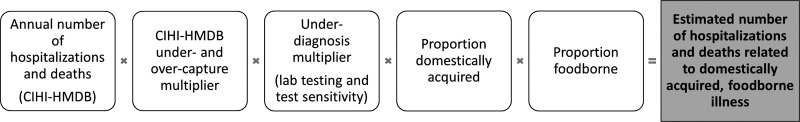
Schematic of the model used to estimate the number of hospitalizations and deaths related to domestically acquired foodborne illness due to pathogens based on the Canadian Institute for Health Information Hospital Morbidity Database (CIHI-HMDB).
A second approach was used primarily for pathogens that are not included in HMDB (5 pathogens for hospitalizations and 10 pathogens for deaths) (Fig. 2, Table 2). This approach relied on the estimated proportion of cases that were hospitalized or died, as determined from surveillance data or reported in the literature, and applying this proportion to the total estimated number of laboratory-confirmed or hospitalized cases. This is similar to the main approach used by the U.S. CDC (Scallan et al., 2011b).
FIG. 2.
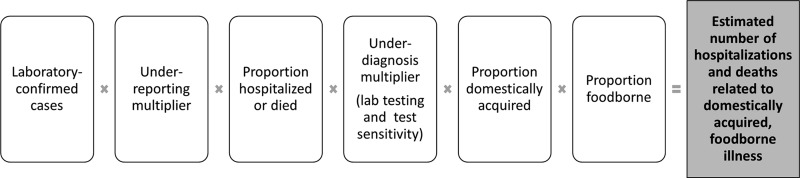
Schematic of the model used to estimate the number of hospitalizations and deaths related to domestically acquired foodborne illness due to pathogens, based on proportion of laboratory-confirmed or hospitalized cases.
As not all hospitalizations associated with each pathogen would have been laboratory-confirmed and captured in the database, pathogen-specific multipliers were generated to adjust for both undercapture (and overcapture) and underdiagnosis in HMDB. A Reabstraction Study including HMDB data from 2009 to 2010 assessing quality of significant diagnosis was used to estimate the magnitude of under- and overcapture of aggregated gastrointestinal illness codes (ICD10 intestinal infectious and parasitic diseases (A00-A09)) in HMDB (Discharge Abstract Database (DAD), 2012) (Supplementary Table S2).This Reabstraction Study analyzed original sources of information (a patient chart) and compared this information with what existed in the database. To account for underdiagnosis, the pathogen-specific values for laboratory testing and test sensitivity used in the Canadian foodborne illness estimates were incorporated (Thomas et al., 2013). For pathogens where laboratory testing and test sensitivity values were not part of the original foodborne illness estimates (Bacillus cereus, Staphylococcus aureus, Clostridium perfringens, Escherichia coli [other than VTEC O157] and toxoplasmosis), different proxy values were used (Supplementary Table S1).
Alternative approaches to estimate hospitalizations were used for the five remaining pathogens (Supplementary Figs. S1 and S2). Estimates for hospitalizations due to norovirus and rotavirus were determined by multiplying the number of cause unspecified acute gastrointestinal illness hospitalizations in HMDB by the proportion estimated to be due to norovirus and rotavirus from the literature (10% and 8%, respectively) (Lopman et al., 2011) and then adding to these totals the number of coded hospitalizations for norovirus and rotavirus in HMDB, respectively. For adenovirus-, astrovirus-, and sapovirus-related hospitalizations, estimates were generated for children <5 years of age, based on published pathogen-specific hospitalization rates (Supplementary Table S3). These estimates were then projected to estimate the hospitalizations due to these viruses for the total population. This projection relied on the breakdown between children <5 years of age and those 5 years and older for norovirus and rotavirus hospitalizations. To estimate deaths associated with adenovirus, astrovirus, sapovirus, and rotavirus, the estimated proportion of cases that die based on the U.S. CDC estimates for astrovirus, sapovirus, and rotavirus were used (Scallan et al., 2011a). To estimate the number of deaths due to norovirus, the mortality rate for norovirus in the United States (Hall et al., 2013), adjusted for the difference in the incidence of norovirus between Canada (Thomas et al., 2013) and the United States (Scallan et al., 2011b), was applied to the Canadian population. This method was different than that used for all the other pathogens as it used a population-based mortality rate.
For most pathogens, the proportions of hospitalizations and deaths that were foodborne and domestically acquired were based on the values used in the Canadian estimates of foodborne illness (Thomas et al., 2013), the one exception is norovirus. Based on a recent comparison of foodborne and nonfoodborne norovirus outbreaks in the United States (Hall et al., 2014), the reported case-hospitalization and case-fatality ratios are estimated to be lower in foodborne outbreaks compared to nonfoodborne outbreaks. This difference likely reflects differences in transmission routes depending on age (i.e., nonfoodborne routes may be more common among the elderly and in institutions). To account for this phenomenon, a uniform distribution for the proportion foodborne for hospitalizations and deaths associated with norovirus reflecting both the recent U.S. outbreak data and the value used in the previous Canadian foodborne illness estimates was used (Supplementary Table S1).
Unspecified agents
Unspecified agents were defined using the same definition as the U.S. CDC and Canadian illness estimates: ‘‘Known agents with insufficient data for estimating agent-specific episodes of illness; known agents not yet recognized as causing foodborne illness; microbes, chemicals or other substances known to be in food but for which pathogenicity is unproven; and agents not yet described’’ (Scallan et al., 2011a; Thomas et al., 2013). To estimate the hospitalizations associated with unspecified agents, we first estimated the number of hospitalizations for acute gastroenteritis. Using ICD 10 codes from 2007 to 2010 national estimates from HMDB, hospitalizations in which acute gastroenteritis was listed as one of the first 16 diagnoses were extracted. Similar to the U.S. CDC methods (Scallan et al., 2011a), acute gastroenteritis was defined as ICD 10 diagnostic codes A00.9–08.5 (intestinal infectious disease of known cause), A09 (infectious gastroenteritis), K52.9 (other unspecified noninfectious gastroenteritis and colitis), or R19 (other symptoms involving digestive system: includes diarrhea), excluding A04.7 (Clostridium difficile colitis) and A051 (botulism). Many cases of infectious diseases from which a pathogen was not isolated may be coded as “other” and “unspecified noninfectious gastroenteritis and colitis” (Scallan et al., 2011a).
The estimated number of hospitalizations, caused by the 25 pathogens known to cause symptoms of vomiting or diarrhea, was subtracted from our estimate of the overall number of hospitalizations from acute gastroenteritis. Five pathogens were not included since they do not typically cause symptoms of acute gastrointestinal illness (AGI) (i.e., Toxoplasma gondii, hepatitis A virus, Listeria monocytogenes, Brucella spp., and C. botulinum). We then estimated the proportion foodborne and domestically acquired for the 25 known acute gastroenteritis pathogens and applied this value to the remaining unspecified acute gastroenteritis hospitalizations.
To estimate the deaths related to unspecified foodborne agents, we started with the total estimated unspecified domestic foodborne acute gastroenteritis hospitalizations and then applied the proportion that died from the known domestic foodborne hospitalizations. This approach was used because Canadian Vital Statistics Death data with more than one cause of death or contributing diagnosis listed (Statistics Canada, 2013), as used in the U.S. CDC estimates (Scallan et al., 2011a), were not available for Canada.
Uncertainty analysis
To capture the uncertainty associated with the estimates, inputs were described using probability distributions that captured the range (minimum, maximum) and most likely value. Empirical data were used to inform these distributions whenever possible; however, where data were unavailable, expert opinion was used. In both situations, the minimum, maximum, and most likely values for the variable were developed (using the PERT distribution) (Supplementary Table S1) (Vose, 2008). The final estimates (reported as mean with 90% probability intervals [PI] around the mean) using these uncertain inputs were generated using Monte Carlo simulation (100,000 iterations using @Risk software, an add-in for Microsoft Excel).
Results
The combined estimate due to 30 pathogens and unspecified agents is an annual estimate of 11,632 (90% PI 9,249–14,158) hospitalizations and 238 (90% PI 155–323) deaths related to domestically acquired foodborne illness in Canada circa 2006 (Table 3). We estimate each year there are 3943 (90% PI 3190–4757) hospitalizations and 105 (90% PI 75–139) deaths related to domestically acquired foodborne illness due to 30 pathogens. We estimate that 7689 (90% PI 5891–9639) hospitalizations and 133 (90% PI 77–192) deaths are related to domestically acquired foodborne illness due to unspecified agents. Hospitalizations and deaths associated with unspecified agents represent 66% and 56%, respectively, of the total estimates. Of the hospitalizations and deaths due to the 30 known pathogens, respectively, 66% and 76% were caused by bacteria, 31% and 19% by viruses, and 3% and 5% by parasites. The pathogens that are estimated to cause the greatest number of hospitalizations each year are norovirus (1182), nontyphoidal Salmonella spp. (925), Campylobacter spp. (565), and VTEC O157 (205) (Table 3) accounting for 74% of all hospitalizations related to known pathogens. The pathogens that cause the greatest number of deaths are L. monocytogenes (35), norovirus (21), nontyphoidal Salmonella spp. (17), and VTEC O157 (8) (Table 3) accounting for 77% of all deaths related to known pathogens.
Table 3.
Estimated Annual Number of Hospitalizations and Deaths Related to Domestically Acquired Foodborne Illness Due to 30 Pathogens, and Estimated Underascertainment Multipliers, Canada, Circa 2006
| Hospitalizations | Deaths | ||||||||||||||
|---|---|---|---|---|---|---|---|---|---|---|---|---|---|---|---|
| Inputs | Total hospitalizations | Total domestic foodborne hospitalizations | Total deaths | Total domestic foodborne deaths | |||||||||||
| Pathogen | Reported mean annual hospitalizations (CIHI-HMDB) | Reported mean annual deaths (CIHI-HMDB) | Total under-ascertainment multiplier | Mean | 90% PI (low) | 90% PI (high) | Mean | 90% PI (low) | 90% PI (high) | Mean | 90% PI (low) | 90% PI (high) | Mean | 90% PI (low) | 90% PI (high) |
| Bacteria | |||||||||||||||
| Bacillus cereus | 2 | 0 | 16.8 | 36 | 28 | 48 | 36 | 28 | 48 | 0 | 0 | 0 | 0 | 0 | 0 |
| Brucella spp. | 11 | 0 | 2.3 | 26 | 11 | 42 | 3 | 1 | 6 | 1 | 0 | 3 | 0.1 | 0 | 0.4 |
| Campylobacter spp. | 598 | 6 | 1.8 | 1093 | 866 | 1367 | 565 | 429 | 727 | 11 | 3 | 25 | 5 | 2 | 13 |
| Clostridium botulinum | n/a | n/a | 1.8 | 8 | 0 | 16 | 8 | 0 | 16 | 1 | 0 | 7 | 1 | 0 | 7 |
| Clostridium perfringens | 3 | 0 | 16.8 | 49 | 0 | 134 | 48 | 0 | 133 | 0.4 | 0 | 2 | 0.4 | 0 | 2 |
| VTEC O157 | 208 | 7 | 1.6 | 340 | 246 | 472 | 246 | 172 | 348 | 11 | 6 | 17 | 8 | 4 | 12 |
| VTEC, non- O157 | 22 | 1 | 13.4 | 305 | 206 | 442 | 197 | 130 | 290 | 8 | 2 | 20 | 5 | 1 | 13 |
| ETEC | 5 | 0 | 16.8 | 85 | 45 | 133 | 38 | 20 | 61 | 0.5 | 0 | 1 | 0.2 | 0 | 1 |
| Escherichia coli, other diarrheagenic | 7 | 1 | 16.8 | 115 | 46 | 198 | 34 | 13 | 62 | 0.7 | 0 | 2 | 0.2 | 0 | 1 |
| Listeria monocytogenes | 124 | 29 | 1.5 | 190 | 134 | 312 | 150 | 104 | 247 | 44 | 31 | 76 | 35 | 24 | 60 |
| Salmonella spp., nontyphoidal | 857 | 16 | 1.8 | 1565 | 1221 | 1978 | 925 | 707 | 1186 | 29 | 4 | 50 | 17 | 2 | 30 |
| Salmonella Typhi | 124 | 1 | 1.7 | 216 | 166 | 279 | 42 | 29 | 58 | 1 | 0 | 4 | 0.3 | 0 | 1 |
| Shigella spp. | 75 | 0 | 1.8 | 137 | 86 | 195 | 11 | 5 | 17 | 0.5 | 0 | 3 | 0.04 | 0 | 0.2 |
| Staphylococcus aureus | 10 | 0 | 16.8 | 177 | 65 | 333 | 176 | 64 | 332 | 0 | 0 | 0 | 0 | 0 | 0 |
| Vibrio cholerae, toxigenic | 4 | 0 | 1.7 | 7 | 3 | 13 | 0 | 0 | 0 | 0.1 | 0 | 1 | 0 | 0 | 0 |
| Vibrio vulnificus | n/a | n/a | 1.3 | 1 | 0 | 3 | 1 | 0 | 2 | 0.3 | 0 | 1 | 0.3 | 0 | 1 |
| Vibrio parahaemolyticus | n/a | n/a | 3.2 | 24 | 13 | 40 | 17 | 9 | 29 | 0.8 | 0 | 3 | 0.6 | 0 | 2 |
| Vibrio spp., other | n/a | n/a | 3.2 | 14 | 8 | 23 | 10 | 6 | 17 | 2 | 1 | 5 | 2 | 1 | 4 |
| Yersinia enterocolitica | 44 | 2 | 2.7 | 119 | 90 | 155 | 80 | 57 | 109 | 4 | 0 | 11 | 3 | 0 | 8 |
| Subtotal | 4507 | 2588 | 116 | 78 | |||||||||||
| Parasites | |||||||||||||||
| Cryptosporidium spp. | 35 | 0 | 3.5 | 124 | 63 | 207 | 8 | 3 | 15 | 1 | 0 | 4 | 0.1 | 0 | 0.3 |
| Cyclospora cayetanensis | n/a | n/a | 2.7 | 32 | 16 | 53 | 9 | 4 | 16 | 0 | 0 | 0 | 0 | 0 | 0 |
| Giardia sp. | 132 | 3 | 3.5 | 467 | 301 | 681 | 20 | 12 | 31 | 10 | 0 | 23 | 0.4 | 0 | 1 |
| Toxoplasma gondii | 101 | 6 | 1.7 | 175 | 143 | 213 | 84 | 66 | 107 | 11 | 6 | 16 | 5 | 3 | 8 |
| Trichinella spp. | 4 | 0 | 1.7 | 6 | 0 | 13 | 6 | 0 | 13 | 0.1 | 0 | 1 | 0.1 | 0 | 1 |
| Subtotal | 803 | 128 | 22 | 6 | |||||||||||
| Viruses | |||||||||||||||
| Adenovirus | n/a | n/a | n/a | 948 | 744 | 1208 | 5 | 2 | 8 | n/a | n/a | n/a | <0.01 | 0 | 0.01 |
| Astrovirus | n/a | n/a | n/a | 370 | 277 | 487 | 2 | 1 | 3 | n/a | n/a | n/a | <0.01 | 0 | 0.01 |
| Hepatitis A virus | 96 | 2 | 1.4 | 138 | 100 | 191 | 7 | 4 | 12 | 2 | 1 | 3 | 0.1 | 0 | 0.2 |
| Norovirus | 604 | n/a | n/a | 6067 | 4875 | 7350 | 1182 | 543 | 1908 | 131 | 119 | 144 | 21 | 3 | 39 |
| Rotavirus | 1606 | n/a | n/a | 6046 | 4701 | 7491 | 30 | 11 | 51 | n/a | n/a | n/a | 0.03 | 0 | 0.06 |
| Sapovirus | n/a | n/a | n/a | 376 | 191 | 621 | 2 | 1 | 4 | n/a | n/a | n/a | 0.01 | 0 | 0.03 |
| Subtotal | 13,946 | 1227 | 133 | 21 | |||||||||||
| Total for 30 pathogens | 19,256 | 14,654 | 24,696 | 3943 | 3190 | 4757 | 271 | 2425 | 5858 | 105 | 75 | 139 | |||
| Unspecified agents | 7689 | 5891 | 9639 | 133 | 77 | 192 | |||||||||
| Total | 11,632 | 9249 | 14,158 | 238 | 155 | 323 | |||||||||
CIHI, Canadian Institute for Health Information; HMDB, Hospital Morbidity Database; n/a, not available; PI, probability intervals; VTEC, verotoxin-producing E. coli; ETEC, enterotoxigenic E. coli.
Discussion
It is estimated that each year 4 million episodes of domestically acquired foodborne illness occur in Canada (Thomas et al., 2013), of which we estimate that there are over 11,500 hospitalizations and 238 deaths. Pathogens causing the greatest number of hospitalizations and deaths are norovirus, nontyphoidal Salmonella spp., Campylobacter spp., VTEC O157, and L. monocytogenes. This differs slightly from those causing the greatest number of illnesses, which includes C. perfringens and Bacillus cereus instead of VTEC O157 and L. monocytogenes.
Given inherent differences in methodological approaches and data sources used, comparisons between country estimates are difficult to make. Nontyphoidal Salmonella spp. and Campylobacter spp. are among the top three causes of foodborne hospitalizations in the United States, Australia, England and Wales, France, and New Zealand (Adak et al., 2002; Vaillant et al., 2005; Cressey et al., 2011; Gkogka et al., 2011; Scallan et al., 2011b; Kirk et al., 2014). Likewise, norovirus is among the top three causes of hospitalizations in New Zealand, the United States, and Australia (Cressey et al., 2011; Scallan et al., 2011b; Kirk et al., 2014). When comparing international estimates of foodborne deaths, nontyphoidal Salmonella spp. is among the top two causes in the United States, Australia, England and Wales, France, Greece, and the Netherlands (Adak et al., 2002; Vaillant et al., 2005; Gkogka et al., 2011; Scallan et al., 2011b; Havelaar et al., 2012; Kirk et al., 2014). L. monocytogenes is at the top of the list of pathogens causing deaths in New Zealand (Cressey et al., 2011), similar to the results for Canada, and was among the top four pathogens in Australia, England and Wales, Greece, France, and the United States (Adak et al., 2002; Vaillant et al., 2005; Gkogka et al., 2011; Scallan et al., 2011b; Kirk et al., 2014).
General methodological approaches were kept the same between the Canadian and U.S. CDC studies; however, there were some key differences, the main one being the approach to accounting for underascertainment. In the U.S. CDC estimates, all estimates of hospitalizations and deaths were doubled to account for underascertainment, similar to what was done in the 1999 U.S. estimates (Mead et al., 1999; Scallan et al., 2011b). In the Canadian study, for pathogens using Approach 1, gastrointestinal illness–specific (based on using ICD-10-CA for intestinal infectious and parasitic diseases [A00-A09] codes) under-reporting estimates were calculated using the CIHI Reabstraction Study results (Discharge Abstract Database [DAD], 2012). Additionally, we employed the pathogen-specific values for laboratory testing and test sensitivity used to generate the estimates of the number of cases, to account for underdiagnosis (Thomas et al., 2013). This pathogen-specific approach, when compared with the doubling approach used in the U.S. CDC estimates, results in considerable differences in the estimated multipliers, likely contributing to the differences seen between the final results of these two studies.
Pathogens that are believed to be more severe (e.g., L. monocytogenes, Vibrio vulnificus, VTEC O157) or ones that are typically better understood or part of more established surveillance systems (e.g., nontyphoidal Salmonella spp., Campylobacter spp.) were found to have lower underascertainment multipliers. Conversely, those pathogens that are less severe (e.g., B. cereus, C. perfringens) or not part of established surveillance systems (e.g., ETEC, E. coli other than VTEC) were found to have the larger multipliers. In comparing the underascertainment multipliers used here and the doubling approach used in the U.S. CDC estimates, half (n=15) of the pathogens here have a multiplier ranging from 1.3 to 2.7—a relatively similar value to 2 used in the United States. Four pathogens had a multiplier of 3.2–3.5, with the remaining pathogens having a multiplier of 13.4 or greater (n=6), or in cases when this approach was not used, a multiplier was not estimated (n=5). Nontyphoidal Salmonella spp., Campylobacter spp., and VTEC O157, top pathogens associated with hospitalizations and deaths common to both countries, were among the group of 15 pathogens with multipliers close to 2. As underascertainment multipliers can have a large impact on the final estimates and relative ranking of pathogens, additional work in this area including international comparisons will inform future research.
An additional difference was the preferential use of the HMDB as a key source of input data for the Canadian estimates, more similar to the approach taken in Australia (Kirk et al., 2014). This database is nationally representative and was deemed to be the best source of hospitalization and death data in Canada for our purposes. National enteric surveillance systems capture limited or no information about hospitalization and death status.
When analyzing the HMDB, we chose to use the first 16 diagnostic codes captured for each hospitalization. Using the more sensitive definition of including multiple diagnostic codes, versus the most responsible diagnosis code which only describes one condition thought to be most responsible for the patient's stay in hospital, generates a more representative measure of hospitalizations related to a pathogen. A limitation of this approach is that it may result in the inclusion of hospitalizations where the enteric pathogen was identified but another diagnosis (i.e., an underlying condition) caused the hospitalization. Conversely, underestimation of pathogen-specific hospitalizations may occur. For a case to be captured in the hospitalization database, healthcare providers must order the appropriate diagnostic tests, code the case appropriately in the hospital chart, and enter the information in the database accurately. Furthermore, a hospitalization or death related to acute gastrointestinal illness may occur well after the initial illness, particularly in vulnerable populations, where associated dehydration or electrolyte imbalance may exacerbate a pre-existing illness, resulting in under-reporting of the gastrointestinal illness as a contributing factor (Helms et al., 2003; Scallan et al., 2011b).
Deaths were identified from HMDB as the Canadian Vital Statistics Death database only captures primary cause of death and thus, substantially under-represents the number of deaths for each pathogen (Statistics Canada, 2013). A limitation of this, however, is that deaths occurring outside of the hospital may not be included in these estimates. It also required a deviation from the U.S. CDC method to estimate deaths related to unspecified foodborne agents, although our result appears within a similar range of the U.S. CDC estimate. Understanding the cause of death is complex, especially when taking into account comorbidities. These study results describe the estimated number of people who have died after being infected with 1 of the 30 pathogens or an unspecified agent, and the resulting illness may be either the cause or a contributing cause of death.
Some data gaps were identified during the course of the study. For pathogens where data were not sufficient or did not exist within HMDB, alternative approaches were used. International literature reporting the rate of hospitalization or death was used for most of these pathogens or, as was done with norovirus and rotavirus, the proportion of unspecified acute gastrointestinal illness–related hospitalizations in Canada that could be estimated to be related to these specific pathogens based on literature was employed. The ICD 10 coding related to E. coli hospitalizations is not specific and required manipulation and assumptions to align with the categories used in this study, in addition to the uncertainty of laboratory testing practices related to E. coli, an additional limitation. To account for underdiagnosis, the values for laboratory testing and test sensitivity used in the Canadian foodborne illness estimates (Thomas et al., 2013) were incorporated, based on the assumption that laboratory testing practices in the hospital setting would be similar to that of illnesses in the community. An updated survey of Canadian clinical laboratories would inform our understanding of current clinical laboratory practices and refine test sensitivity estimates and associated multipliers.
The estimated proportion of illnesses transmitted by food per pathogen greatly affects burden of foodborne illness estimates (Scallan et al., 2011b; Glass et al., 2014). This input has been identified as the greatest source of uncertainty when developing burden of foodborne illness estimates (Glass et al., 2014). Estimating transmission routes for enteric pathogens is challenging, and expert elicitation is often relied on (Havelaar et al., 2008; Vally et al., 2014; Butler et al., 2015b). For consistency, the proportions estimated as foodborne for these hospitalization and death estimates were based primarily on the same inputs as the Canadian foodborne illness estimates (Thomas et al., 2013). The one exception to this was for estimates of norovirus where recent outbreak data (Hall et al., 2014) were incorporated into the proportion foodborne input. This approach was felt to be more conservative and a better reflection of the differences that may exist in transmission routes related to norovirus illness versus more severe outcomes such as hospitalization or death. A recent Canadian expert elicitation on transmission routes of enteric pathogens will inform future burden-of-illness estimates (Butler et al., 2015a); however, further research on how these proportions differ based on differences in illness severity, demographics, etc., is still required.
The estimate of hospitalizations associated with domestically acquired foodborne illness related to unspecified agents is highly dependent on the accuracy of the estimates of hospitalizations related to the 25 known AGI-causing pathogens. As the estimate of hospitalizations attributed to the 25 known pathogens increases, the number of hospitalizations attributed to the unspecified agents decreases. Furthermore, the proportion domestically acquired and foodborne based on 25 known pathogens may not be the same for unspecified agents. This approach is consistent with the U.S. hospitalization estimates (Scallan et al., 2011a, b) and thus allows for comparison. The overall estimates of hospitalizations from acute gastroenteritis also includes codes for both infectious and noninfectious gastroenteritis. Without the identification of a pathogen, infections producing signs and symptoms of gastroenteritis may be coded as nonspecific signs or symptoms or as noninfectious illnesses. Future estimates might be improved by validating the coding practices for both of these gastroenteritis diagnostic categories.
These estimates of hospitalizations and deaths capture only a part of the burden for all pathogens as they only account for acute illness and do not include hospitalizations or deaths related to chronic sequelae associated with the original infection (e.g., Guillain-Barré syndrome associated with Campylobacter spp.). Additional work to better understand the burden of chronic sequelae associated with foodborne pathogens in Canada is needed to inform Disability-Adjusted Life Years and cost estimates and facilitate international comparisons (Havelaar et al., 2012; Keithlin et al., 2014a, b, 2015; McLinden et al., 2014a, b; Scallan et al., 2015).
Conclusions
These are the first estimates of hospitalizations and deaths related to domestically acquired foodborne illness for Canada. This information will be useful for policy-makers to direct prevention and control activities to those pathogens that cause the most severe illness and the greatest burden to Canadians. Important data and knowledge gaps have been identified to inform future research and surveillance efforts in Canada. These estimates, coupled with the previous foodborne illness estimates, can inform education campaigns for consumers, provide information to industry and academics for research programs, and be incorporated in food-safety risk assessments.
Supplementary Material
Acknowledgments
We would like to acknowledge the Canadian Institute for Health Information for their administration of the Hospital Morbidity Database. Parts of this study are based on data and information provided by the Canadian Institute for Health Information. However, the analyses, conclusions, opinions, and statements expressed herein are those of the author, and not necessarily those of the Canadian Institute for Health Information.
We would like to thank the experts (from federal and provincial governments and academic institutions) who provided their time to peer-review the approach taken to develop these estimates.
Disclosure Statement
No competing financial interests exist.
References
- Adak GK, Long SM, O'Brien SJ. Trends in indigenous foodborne disease and deaths, England and Wales: 1992 to 2000. Gut 2002;51:832–841 [DOI] [PMC free article] [PubMed] [Google Scholar]
- Adak GK, Meakins SM, Yip H, Lopman BA, O'Brien SJ. Disease risks from foods, England and Wales, 1996–2000. Emerg Infect Dis 2005;11:365–372 [DOI] [PMC free article] [PubMed] [Google Scholar]
- Butler A, Pintar K, Thomas MK. Expert elicitation as a means to attribute 28 enteric pathogens to foodborne, waterborne, animal contact and person-to-person transmission routes. Foodborne Pathog Dis 2015a;12:335–344 [DOI] [PubMed] [Google Scholar]
- Butler AJ, Thomas MK, Pintar K. A systematic review of expert elicitation methods as a tool for source attribution of enteric illness. Foodborne Pathog Dis 2015b;12:367–382 [DOI] [PubMed] [Google Scholar]
- Canuel M, De Serres G, Duval B, Gilca R, De Wals P, Gilca V. Trends of hepatitis A hospitalization and risk factors in Quebec, Canada, between 1990 and 2003. BMC Infect Dis 2007;7:31. [DOI] [PMC free article] [PubMed] [Google Scholar]
- Cressey P, Lake R. Estimated incidence of foodborne illness in New Zealand: Application of overseas models and multipliers. Christchurch, New Zealand: New Zealand Government, 2011 [Google Scholar]
- Discharge Abstract Database (DAD). DAD 2009–2010 Reabstraction Study. Ottawa, Canada: Canadian Institute for Health Information, 2012 [Google Scholar]
- Gkogka E, Reij MW, Havelaar AH, Zwietering MH, Gorris LG. Risk-based estimate of effect of foodborne diseases on public health, Greece. Emerg Infect Dis 2011;17:1581–1590 [DOI] [PMC free article] [PubMed] [Google Scholar]
- Glass K, Ford L, Kirk MD. Drivers of uncertainty in estimates of foodborne gastroenteritis incidence. Foodborne Pathog Dis 2014;11:938–944 [DOI] [PubMed] [Google Scholar]
- Hall AJ, Lopman BA, Payne DC, Patel MM, Gastanaduy PA, Vinje J, Parashar UD. Norovirus disease in the United States. Emerg Infect Dis 2013;19:1198–1205 [DOI] [PMC free article] [PubMed] [Google Scholar]
- Hall AJ, Wikswo ME, Pringle K, Gould LH, Parashar UD, Division of Viral Diseases, National Center for Immunization and Respiratory Diseases, CDC. Vital signs: Foodborne norovirus outbreaks—United States, 2009–2012. MMWR Morb Mortal Wkly Rep 2014;63:491–495 [PMC free article] [PubMed] [Google Scholar]
- Hall G, Kirk MD, Becker N, Gregory JE, Unicomb L, Millard G, Stafford R, Lalor K, OzFoodNet Working Group. Estimating foodborne gastroenteritis, Australia. Emerg Infect Dis 2005;11:1257–1264 [DOI] [PMC free article] [PubMed] [Google Scholar]
- Havelaar AH, Galindo AV, Kurowicka D, Cooke RM. Attribution of foodborne pathogens using structured expert elicitation. Foodborne Pathog Dis 2008;5:649–659 [DOI] [PubMed] [Google Scholar]
- Havelaar AH, Haagsma JA, Mangen MJ, Kemmeren JM, Verhoef LP, Vijgen SM, Wilson M, Friesema IH, Kortbeek LM, van Duynhoven YT, van Pelt W. Disease burden of foodborne pathogens in the Netherlands, 2009. Int J Food Microbiol 2012;156:231–238 [DOI] [PubMed] [Google Scholar]
- Helms M, Simonsen J, Molbak K. Foodborne bacterial infection and hospitalization: A registry-based study. Clin Infect Dis 2006;42:4:498–506 [DOI] [PubMed] [Google Scholar]
- Helms M, Vastrup P, Gerner-Smidt P, Molbak K. Short and long term mortality associated with foodborne bacterial gastrointestinal infections: Registry based study. BMJ 2003;326:357. [PMC free article] [PubMed] [Google Scholar]
- Hospital Morbidity Database. Ottawa, Canada: Canadian Institute for Health Information; 2000–2010 [Google Scholar]
- Keithlin J, Sargeant J, Thomas MK, Fazil A. Chronic sequelae of E. coli O157: Systematic review and meta-analysis of the proportion of E. coli O157 cases that develop chronic sequelae. Foodborne Pathog Dis 2014a;11:79–95 [DOI] [PMC free article] [PubMed] [Google Scholar]
- Keithlin J, Sargeant J, Thomas MK, Fazil A. Systematic review and meta-analysis of the proportion of Campylobacter cases that develop chronic sequelae. BMC Public Health 2014b;14:1203. [DOI] [PMC free article] [PubMed] [Google Scholar]
- Keithlin J, Sargeant JM, Thomas MK, Fazil A. Systematic review and meta-analysis of the proportion of non-typhoidal Salmonella cases that develop chronic sequelae. Epidemiol Infect 2015;143:1333–1351 [DOI] [PMC free article] [PubMed] [Google Scholar]
- Kirk M, Ford L, Glass K, Hall G. Foodborne illness, Australia, circa 2000 and circa 2010. Emerg Infect Dis 2014;20:1857–1864 [DOI] [PMC free article] [PubMed] [Google Scholar]
- Lopman BA, Hall AJ, Curns AT, Parashar UD. Increasing rates of gastroenteritis hospital discharges in US adults and the contribution of norovirus, 1996–2007. Clin Infect Dis 2011;52:466–474 [DOI] [PubMed] [Google Scholar]
- McLinden T, Sargeant JM, Thomas MK, Papadopoulos A, Fazil A. Association between component costs, study methodologies, and foodborne illness-related factors with the cost of nontyphoidal Salmonella illness. Foodborne Pathog Dis 2014a;11:718–726 [DOI] [PubMed] [Google Scholar]
- McLinden T, Sargeant JM, Thomas MK, Papadopoulos A, Fazil A. Component costs of foodborne illness: A scoping review. BMC Public Health 2014b;14:509. [DOI] [PMC free article] [PubMed] [Google Scholar]
- Mead PS, Slutsker L, Dietz V, McCaig LF, Bresee JS, Shapiro C, Griffin PM, Tauxe RV. Food-related illness and death in the United States. Emerg Infect Dis 1999;5:607–625 [DOI] [PMC free article] [PubMed] [Google Scholar]
- Scallan E, Griffin PM, Angulo FJ, Tauxe RV, Hoekstra RM. Foodborne illness acquired in the United States—Unspecified agents. Emerg Infect Dis 2011a;17:16–22 [DOI] [PMC free article] [PubMed] [Google Scholar]
- Scallan E, Hoekstra RM, Angulo FJ, Tauxe RV, Widdowson MA, Roy SL, Jones JL, Griffin PM. Foodborne illness acquired in the United States—Major pathogens. Emerg Infect Dis 2011b;17:7–15 [DOI] [PMC free article] [PubMed] [Google Scholar]
- Scallan E, Hoekstra RM, Mahon BE, Jones TF, Griffin PM. An assessment of the human health impact of seven leading foodborne pathogens in the United States using disability adjusted life years. Epidemiol Infect 2015;1–10. Available at: http://dx.doi.org/10.1017/S0950268814003185 [DOI] [PMC free article] [PubMed]
- Statistics Canada. Profile for Canada, Provinces, Territories, Census Divisions and Census Subdivisions, 2006 Census, Ottawa, Canada. 2008
- Statistics Canada. Canadian Vital Statistics Death Database. Ottawa, Canada. 2013
- Thomas MK, Murray R, Flockhart L, Pintar K, Pollari F, Fazil A, Nesbitt A, Marshall B. Estimates of the Burden of Foodborne Illness in Canada for 30 Specified Pathogens and Unspecified Agents, Circa 2006. Foodborne Pathog Dis 2013;10:639–648 [DOI] [PMC free article] [PubMed] [Google Scholar]
- Vaillant V, de Valk H, Baron E, Ancelle T, Colin P, Delmas MC, Dufour B, Pouillot R, Le Strat Y, Weinbreck P, Jougla E, Desenclos JC. Foodborne infections in France. Foodborne Pathog Dis 2005;2:221–232 [DOI] [PubMed] [Google Scholar]
- Vally H, Glass K, Ford L, Hall G, Kirk MD, Shadbolt C, Veitch M, Fullerton KE, Musto J, Becker N. Proportion of illness acquired by foodborne transmission for nine enteric pathogens in Australia: An expert elicitation. Foodborne Pathog Dis 2014;11:727–733 [DOI] [PubMed] [Google Scholar]
- Vose D. Risk Analysis: A Quantitative Guide. Chichester, England: John Wiley & Sons, Ltd, 2008 [Google Scholar]
Associated Data
This section collects any data citations, data availability statements, or supplementary materials included in this article.