

Abstract
Schizophrenia (SZ) is characterized by cognitive dysfunction and disorganized thought, in addition to hallucinations and delusions, and is regarded a disorder of brain connectivity. Recent efforts have been made to characterize the underlying brain network organization and interactions. However, to which degree connectivity alterations in SZ vary across different levels of cognitive effort is unknown. Utilizing independent component analysis (ICA) and methods for delineating functional connectivity measures from functional magnetic resonance imaging (fMRI) data, we investigated the effects of cognitive effort, SZ and their interactions on between-network functional connectivity during 2 levels of cognitive load in a large and well-characterized sample of SZ patients (n = 99) and healthy individuals (n = 143). Cognitive load influenced a majority of the functional connections, including but not limited to fronto-parietal and default-mode networks, reflecting both decreases and increases in between-network synchronization. Reduced connectivity in SZ was identified in 2 large-scale functional connections across load conditions, with a particular involvement of an insular network. The results document an important role of interactions between insular, default-mode, and visual networks in SZ pathophysiology. The interplay between brain networks was robustly modulated by cognitive effort, but the reduced functional connectivity in SZ, primarily related to an insular network, was independent of cognitive load, indicating a relatively general brain network-level dysfunction.
Key words: psychotic disorders, cognition, brain networks, independent component analysis
Introduction
Schizophrenia (SZ) is characterized by delusions, hallucinations, and disorganized thought. Cognitive impairments are key features of the disorder, preceding illness onset, remaining stable over time, and associated with poor functional outcome.1,2 These impairments are closely related to the pathophysiology,3 and several lines of evidence suggest that delineating the mechanisms of cognitive dysfunction will help determine the neuronal substrates of the disease.2 Neuroimaging has implicated morphological and functional alterations in prefrontal, insular, temporal, and subcortical regions,4–7 and studies targeting brain networks and their interactions provide converging evidence supporting a view of SZ as a disorder of brain connectivity.8,9 Despite this intriguing hypothesis, there are few reproducible reports of abnormal brain connectivity in SZ, and especially of a generalized dysconnectivity across cognitive tasks and demands. There is also a marked variability between studies in terms of sample characteristics and analysis approaches.10 Thus, large well-characterized samples along with unbiased and sensitive analysis approaches are needed to capture subtle changes in brain connectivity.
It is increasingly recognized that cognition is supported by the integrated and synchronized functioning of large-scale, distributed brain networks, and not from simple activity modulations of isolated brain regions.11–13 Functional connectivity can be defined as the temporal correlation between brain regions or functional networks,14–16 and is assumed to reflect cross-talk between regions and networks involved. Brain networks can be delineated using functional magnetic resonance imaging (fMRI), and show consistent spatial patterns across studies, populations, and a range of cognitive conditions.17–20 Recent attempts have been made to uncover the dynamics of brain connectivity underlying cognition in the healthy brain.21–25 In SZ, several functional networks and connections have been implicated in the pathophysiology, including fronto-parietal, default-mode, cingulo-opercular, and fronto-temporal networks.9,10,26–31 However, the modulation of functional brain connectivity by cognitive effort is not completely understood, and it is unknown whether this modulation is affected in SZ.
Therefore, the main aim of the current study was to determine the effects of cognitive effort and SZ on brain functional organization, and whether the effects of diagnosis are dependent on cognitive demands. Employing independent component analysis (ICA) and functional connectivity based on the temporal correlations between the components’ time series,32 we characterized and compared measures of between-network functional connectivity during 2 load levels of a demanding cognitive task (n-back). This unique design allowed us to address how the functional coupling between brain networks is modulated by alterations in cognitive load, and to assess the degree to which the effects of SZ on brain connectivity vary between periods of low and high cognitive demands.
Methods
Sample
Two hundred forty-two participants, overlapping with the sample in a previous study,33 comprising 99 DSM-IV-diagnosed patients with SZ spectrum disorders (73 SZ, 15 schizoaffective disorder, 11 schizophreniform disorder), referred to as “schizophrenia” (SZ), and 143 healthy controls (HC), were included. For participant demographics and recruitment procedures, refer to table 1 and supplementary methods, respectively.
Table 1.
Demographic and Clinical Characteristics
| SZ | HC | Test | P | |
|---|---|---|---|---|
| Demographics | ||||
| Sex (male); n (%) | 63 (63.6) | 75 (52.4) | χ2 = 3.0 | .084 |
| Age (years); mean (SD) | 32.1 (8.2) | 35.2 (9.0) | t = 2.7 | .007 |
| Handedness (right); n (%) | 86 (86.9) | 134 (93.7) | χ2 = 3.3 | .069 |
| Education (years); mean (SD)a | 12.9 (2.5) | 14.3 (2.3) | t = 4.3 | <.001 |
| IQ score; mean (SD)b | 104.4 (14.8) | 114.9 (9.8) | t = 6.6 | <.001 |
| Duration of illness (years); mean (SD)c | 6.6 (6.8) | — | — | — |
| Comorbid disorders; n (%) | ||||
| Substance used | 25 (25.3) | — | — | — |
| Somatic illnesse | 15 (16.1) | — | — | — |
| Lifetime episodes; n (%)f | ||||
| Psychosis | 99 (100) | — | — | — |
| Depression | 53 (53.5) | — | — | — |
| Mania | 8 (8.1) | — | — | — |
| Current symptoms; n (%)g | ||||
| Psychotic symptoms | 30 (30.9) | — | — | — |
| Elevated mood symptoms | 11 (11.3) | — | — | — |
| Depressive symptoms | 26 (26.8) | — | — | — |
| Medicationh | ||||
| Antipsychotics | ||||
| n (%) | 68 (74.7) | — | — | — |
| DDD; mean (SD) | 2.1 (7.1) | |||
| Antiepileptics | ||||
| n (%) | 7 (7.5) | — | — | — |
| DDD; mean (SD) | 0.06 (.30) | |||
| Antidepressants | ||||
| n (%) | 21 (23.1) | — | — | — |
| DDD; mean (SD) | 1.9 (15.7) | |||
| Anxiolytics | ||||
| n (%) | 7 (7.9) | — | — | — |
| DDD; mean (SD) | 0.07 (.28) | |||
| Substance usei | ||||
| Alcohol use (AUDIT score); mean (SD) | 5.9 (6.4) | 5.3 (3.1) | t = 1.0 | .302 |
| Illicit drug use (DUDIT score); mean (SD) | 2.8 (6.4) | 0.3 (1.5) | t = 4.4 | <.001 |
| Smoking; n (%)j | 38 (50.0) | NA | — | — |
Note: SZ, schizophrenia; HC, healthy controls, DDD, defined daily dose; AUDIT/DUDIT, alcohol/drug use disorders identification test.
aThe total number of years of completed education as reported by the participants.
bWechsler Abbreviated Scale of Intelligence. Missing in SZ group: n = 4.
cNumber of years between age at onset and age at fMRI scanning. Age at onset was defined as age at first contact with the mental health service due to a primary symptom (n = 97) or age at first experience of symptoms (n = 2).
dLifetime abuse/dependency diagnosis of alcohol/cannabis/other drugs: 16/17/12 %.
eLifetime somatic illness, included cardiovascular (2 %), respirational (9 %), endocrinological (1 %), neurological (1 %), or cancer (0 %). Missing: n = 6.
fLifetime psychotic/depressive/manic episode, based on the SCID-interview (n = 99/90/98), age at first contact with the mental health service due to an episode (n = 0/6/0), or age at first experience of SCID-verified symptoms of an episode (n = 0/1/1).
gMissing: n = 2.
hDefined daily dose. Missing: antipsychotics, n = 8; antiepileptics, n = 6; antidepressants, n = 8; anxiolytics, n = 10.
iMissing in SZ/HC groups: AUDIT, n = 4/1; DUDIT, n = 4/2.
jDaily smoking (yes/no) in the previous year. Missing: n = 23.
Experimental Paradigm
The experimental paradigm was an n-back task with consecutive presentations of pairs of numbers between 1 and 9.34,35 In a 0-back condition, participants were instructed to press a response button when the 2 numbers were identical. In a 2-back condition, the numbers in each stimulus pair were identical and participants were instructed to press a response button when they were the same as the ones presented 2 trials earlier. The paradigm is identical to the one used in Brandt et al33 except for the inclusion of the 0-back in addition to 2-back condition (supplementary methods).
MRI Acquisition
MRI data were acquired on a 1.5 T Siemens Magnetom Sonata (Siemens Medical Solutions) supplied with a standard head coil at Oslo University Hospital. T2*-weighted functional imaging with 164 BOLD-sensitive whole brain volumes per run was obtained with an echo-planar imaging (EPI) pulse sequence. Structural data used for registration were acquired using a repeated 3D T1-weighted magnetization prepared rapid acquisition gradient echo (MPRAGE) sequence (supplementary methods).
MRI Preprocessing
T1-weighted datasets were processed using FreeSurfer (http://surfer.nmr.mgh.harvard.edu) including surface reconstruction and full brain segmentation.36 The segmented volume was used in order to obtain high quality brain masks for registration purposes. fMRI data were processed using FEAT, part of FSL (FMRIB’s Software Library; http://www.fmrib.ox.ac.uk/fsl).37 Conventional preprocessing included motion correction,38 nonbrain removal,39 spatial smoothing using a Gaussian kernel of FWHM = 6mm, and high-pass temporal filtering with a 90 s window. Registration from fMRI to structural space was carried out using FLIRT,38 and fMRI data were warped to MNI space via the high-resolution structural volume using FNIRT (http://fsl.fmrib.ox.ac.uk/fsl/fslwiki/FNIRT).
ICA and Dual Regression
Group ICA was performed using Multivariate Exploratory Linear Optimized Decomposition into Independent Components (MELODIC),40 using the temporal concatenation approach. To avoid bias, a sample of 99 patients and 99 controls matched on sex and age was used for decomposition. The number of components was calculated using a Laplace approximation of the posterior probability of the model order,41 yielding 22 components. Spatial maps and time frequency characteristics of the associated group average time series were inspected (supplementary methods), and 7 components reflecting well-known large-scale functional brain networks were used in further analyses. The group-average spatial maps were used to generate subject-specific maps and associated time series using dual regression (supplementary methods).42,43 In order to investigate between-network connectivity, full and partial correlations between each component time series were calculated from the subject-specific time series using FSLNets (http://fsl.fmrib.ox.ac.uk/fsl/fslwiki/FSLNets).32 This resulted in one 242×7 × 7 matrix per condition per coefficient (full and partial), which were converted to z-scores by means of Fischer’s r-to-z transformation and submitted to statistical analyses. The current approach shares features with psychophysiological interaction (PPI) analysis.44
Statistical Analysis
To investigate main effects of load and diagnosis on functional connectivity, as well as load × diagnosis interaction effects, a 2-way repeated measures ANOVA was performed with load (0-back, 2-back) and diagnosis (SZ, HC) as independent variables and the subject-specific full correlations (z-scores) as dependent variable. The statistical threshold was set to P < .0024, corresponding to a Bonferroni-correction for 21 correlations, but effects with a nominal P < .05 are also reported in order to facilitate comparisons with previous and future studies.
Task performance was assessed using d-prime34 (supplementary methods) and response time (RT) on correct responses. Repeated measures ANOVAs were performed with load (0-back, 2-back), diagnosis (SZ, HC) and performance to test for main effects of load and diagnosis and their interactions on d-prime and RT. Post hoc tests were performed to assess effects of possible confounders and their influence on the main results, including in-scanner subject motion, age, sex, task performance, IQ, education, substance use, medication, duration of illness, symptom level, and lifetime episodes (supplementary methods).
In order to assess consistency across connectivity definitions and dimensionalities, the main analysis was also performed using regularized partial correlations32 (lambda = 0.1, 1.0, 10) and different model orders (d = 40, 60). Since effects of task-design on estimated connectivity patterns are unknown, 2 additional analyses were performed to provide converging evidence across approaches. First, we used time series residuals after regressing out variance related to the design. Second, we used experimental on-blocks only (supplementary methods).
Results
Task Performance
Group differences in d-prime and RT were found in both conditions (table 2), indicating reduced target discrimination and increased RTs in patients. In addition to main effects of load and diagnosis on d-prime (load: F = 212.8; diagnosis: F = 39.1; P < .001) and RT (load: F = 104.9; diagnosis: F = 15.0; P < .001), there was also a load × diagnosis interaction effect on both measures (d-prime: F = 40.0, P < .001; RT: F = 10.7, P = .001), indicating larger group differences during 2-back compared to 0-back.
Table 2.
Task Performance
| SZ | HC | t | P | |
|---|---|---|---|---|
| 0-back | ||||
| Accuracy—% hits (SD) | 99.4 (1.4) | 99.7 (0.9) | 2.1 | <.05 |
| d-prime—mean (SD)a | 3.98 (0.30) | 4.05 (0.17) | 2.0 | <.05 |
| RT hits, ms—mean (SD)b | 552.4 (117.1) | 520.5 (81.3) | 2.4 | <.05 |
| RT total, ms—mean (SD)b | 553.7 (121.0) | 520.5 (81.8) | 2.5 | <.05 |
| 2-back | ||||
| Accuracy—% hits (SD) | 94.0 (6.2) | 97.7 (3.0) | 6.1 | <.001 |
| d-prime—mean (SD)c | 3.05 (0.89) | 3.68 (0.59) | 6.6 | <.001 |
| RT hits, ms—mean (SD)b | 689.9 (213.5) | 591.4 (151.0) | 4.0 | <.001 |
| RT total, ms—mean (SD)b | 703.7 (210.3) | 601.3 (150.8) | 4.2 | <.001 |
Note: SZ, schizophrenia; HC, healthy controls; RT, response time.
aMax score: 4.13.
bMissing in SZ/HC groups: n = 14/4.
cMax score: 4.16.
Independent Component Analysis
Figure 1 shows the 7 networks (components) obtained from ICA which were used in analyses: (1) Bilateral fronto-parietal network (FP) overlapping with effort-mode/working memory network; (2) default-mode network (DMN); (3) visual network, secondary areas (VIS2); (4) motor network (MOT); (5) visual network, primary areas (VIS1); (6) insula network (INS), overlapping with salience/cingulo-opercular network; and (7) left fronto-parietal network (LFP), overlapping with ventral attention network.18,19 Supplementary figure S1 shows the clustering of these networks based on time series correlations across conditions.
Fig. 1.

Functional networks (components) included in the analyses: Bilateral fronto-parietal network (FP; 1), default-mode network (DMN; 2), visual network (VIS2; 3), motor network (MOT; 4), visual network (VIS1; 5), insula network (INS; 6), left fronto-parietal network (LFP; 7).
Effects of Cognitive Load, Diagnosis, and Their Interactions on Functional Connectivity
Main effects of load (P < .0024) were found in 12 of 21 correlations (figure 2A, supplementary figure S3, supplementary table S1), including both increased (FP–VIS2 [1–3], FP–LFP [1–7], DMN–MOT [2–4], DMN–VIS1 [2–5], DMN–INS [2–6], VIS2–LFP [3–7], MOT–VIS1 [4–5]) and decreased (FP–DMN [1–2], FP–VIS1 [1–5], DMN–LFP [2–7], VIS1–LFP [5–7], VIS2–INS [3–6]) connectivity in 2-back compared to 0-back. Three additional correlations (VIS2–MOT, MOT–INS, INS–LFP) showed load effects at the nominal alpha level (P < .05).
Fig. 2.

Effects of load, diagnosis, and their interactions on functional connectivity as revealed by (A) main analysis based on entire time series; (B) additional analyses based on residuals and experimental on-blocks only, yielding converging results across approaches. Numbers represent network numbers: (1) FP, (2) DMN, (3) VIS2, (4) MOT, (5) VIS1, (6) INS, and (7) LFP. Colors represent effect sizes (partial eta squared) for significant (P < .05, Bonferroni) correlations, where warm/cold colors represent increasing/decreasing connectivity, respectively, with increasing load. White dots show trend effects (nominal P < .05). Effects above the diagonal are based on partial correlations, while effects below the diagonal are based on full correlations.
Main effects of diagnosis (P < .0024) were found in 2 correlations, DMN–INS and VIS2–INS, indicating reduced connectivity in patients compared with controls (figures 2A and 3). Average time series of these networks within groups and task conditions are shown in supplementary figure S4. Four additional correlations showed nominally significant (P < .05) diagnosis effects (FP–VIS2, FP–INS, VIS2–LFP, and MOT–INS).
Fig. 3.
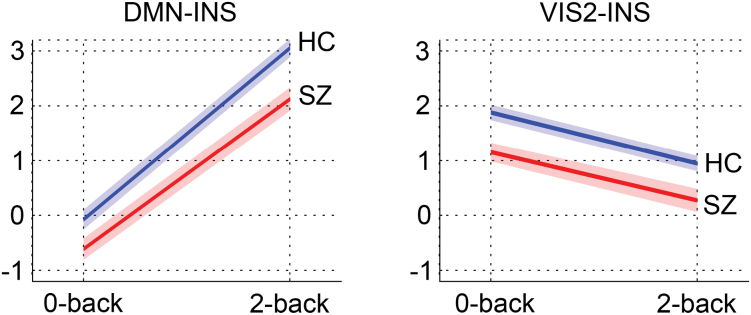
Mean connectivity (z-scores) and standard errors within task conditions for each group in functional connections (correlations) showing effects of diagnosis in the main analysis.
No interactions between load and diagnosis on brain connectivity were found (figure 2A, supplementary figure S3). Five correlations showed nominally significant interactions (FP–LFP, DMN–VIS1, VIS1–INS, VIS2–VIS1, and MOT–INS), mainly indicating stronger diagnosis effects during 2-back compared to 0-back. None of the correlations showing a nominally significant interaction effect showed main effect of diagnosis (DMN–INS: P = .213; VIS2–INS: P = .853).
Effects of Subject Motion, Age, Sex, IQ, and Education on Functional Connectivity
There were no effects of load or diagnosis on relative subject motion (load: F = 0.067, P = .796; diagnosis: F = 3.06, P = .082; load × diagnosis: F = 2.20, P = .139). Further, mean relative motion across tasks did not influence the main results, but there was a unique effect of motion on the strength of 6 out of 12 correlations showing main effects of load or group (supplementary table S2), indicating increasing between-network correlations with increasing motion. Including age in the model did not influence the main results, but there was a unique effect of age in 5 of 12 correlations (supplementary table S2), as well as load × diagnosis interactions in 3 correlations when controlling for age (FP–LFP: P = .006; DMN–MOT: P = .012; DMN–VIS1: P = .004), indicating larger group differences in 2-back compared to 0-back. Including sex did not influence the main results. IQ was associated with DMN–INS in 2-back (t = 2.4, P = .019), and the effect of diagnosis remained in both correlations with group effects when controlling for IQ (DMN–INS: P = .037, VIS2–INS: P = .002). Similar results were found for education, which correlates highly with IQ (r = .55, P < .001). Analysis performed using difference scores between 2-back and 0-back correlations yielded no associations with IQ or education.
Effects of Task Performance on Functional Connectivity
Associations were found between d-prime and the strength of 6 out of 12 correlations during 2-back (FP–VIS1: t = −3.5, P = .001; FP–LFP: t = 3.8, P < .001; DMN–VIS1: t = 2.5, P = .012; DMN–INS: t = 4.8, P < .001; MOT–VIS1: t = 2.4, P = .019; VIS1–LFP: t = −3.2, P = .002), mainly indicating higher correlations with increasing target discrimination (supplementary table S3). Most of these associations remained when controlling for diagnosis. Healthy controls showed associations between d-prime and FP–LFP (t = 3.9, P < .001) and VIS1–LFP (t = −2.6, P = .010), while patients showed associations with FP–VIS1 (t = −3.3, P = .001), DMN–INS (t = 4.3, P < .001), and MOT–VIS1 (t = 2.5, P = .013), and a trend in VIS2–INS (t = 1.9, P = .061). For the correlations showing main effects of diagnosis (DMN–INS, VIS2–INS), the effect within conditions remained when covarying for d-prime, except for DMN–INS during 2-back, which showed trend effects (t = 1.8, P = .067). Analysis performed using difference scores yielded associations with d-prime in DMN–INS (0-back: t = 2.8, P = .005; 2-back: t = 3.5, P = .001). RT on correct responses was associated with VIS1–LFP in 0-back (t = 2.0, P = .044) and FP–DMN in 2-back (t = −2.2, P = .027).
Effects of Clinical Variables on Functional Connectivity
Correlations showing main effects of diagnosis were associated with medication level (defined daily dose) during 2-back, but not 0-back, including antipsychotics (DMN–INS: t = −2.8, P = .007; VIS2–INS: t = 2.7, P = .008), antidepressants (DMN–INS: t = −2.8, P = .006; VIS2–INS: t = 2.7, P = .009), and anxiolytics (DMN–INS: t = −2.1, p = .04; VIS2–INS: t = 2.7, P = .008). Current symptoms (psychotic, depressive, elevated mood) and duration of illness were not associated with the strength of these correlations. Having a comorbid disorder of substance use was associated with DMN–INS in 0-back (t = −2.7, P = .010), indicating reduced connectivity in patients with substance use disorder. Further, alcohol and illicit drug use did not influence the main effects of diagnosis, and smoking was not associated with these correlations. There was an effect of lifetime depression on DMN–INS in 0-back (t = −2.4, P = .019), indicating reduced connectivity in patients with a history of depression, but no effect of lifetime mania. Analysis performed using difference scores yielded similar results for medication, symptoms, illness duration, substance use, and smoking, while no associations were found for substance use disorder or lifetime symptoms. Excluding patients with schizophreniform and schizoaffective disorders did not remove the main effects of diagnosis.
Additional Connectivity Analyses
Rerunning the main analysis using regularized partial correlations yielded highly consistent main effects of load, diagnosis, and interactions (supplementary figure S5A). Employing higher model orders yielded several main effects of load and diagnosis implicating similar networks (insula, default-mode, and visual) (supplementary figure S5B and C). The additional analyses based on either residuals or experimental blocks only yielded convergent results, and all effects of load and diagnosis remained (P < .0024, figure 2B).
Discussion
Utilizing a data-driven approach for delineation of brain networks and their temporal dynamics, we assessed the modulation of functional brain connectivity by cognitive load, schizophrenia case–control status, and their interactions. We report significant load effects in a majority of the functional connections, suggesting that the strength of the connections is modulated by cognitive effort. The strength of 2 connections involving insular, default-mode, and visual networks was significantly reduced in schizophrenia compared with healthy controls. Importantly, we have shown that functional connectivity alterations in schizophrenia generalize across load conditions, extending recent findings.45,46
The present results provide novel insight into the complex brain dynamics underlying cognitive effort. Previous work on working memory and effort-related signal amplitude modulations have indicated either increased or decreased relative activation in schizophrenia.4,33 In a recently published study33 utilizing an overlapping sample, amplitude modulations within brain networks during 2-back were observed. Here, by targeting connectivity between networks and an additional load level, we extend these findings by showing that the main effects of load revealed an intricate pattern of between-network synchronization and de-synchronization with increasing effort. Functional connections showing positive associations with effort included fronto-parietal networks, which are considered core hubs in a generalized multiple-demand or effort-based system,47 and which together with the default-mode network (DMN) play an essential role in cognition.23,48,49 The bilateral fronto-parietal network showed reduced correlations with the DMN with increasing load, indicating dynamic network-specific configurations. Most connections showed consistent connectivity patterns across conditions, ie, positive (eg, FP-LFP and FP-VIS2) or negative correlations (DMN-MOT) at both load levels. For others, the sign of the correlation shifted when increasing load (eg, FP-DMN). These effort-related modulations of brain network connectivity suggest a pattern that extends a simple task-positive and task-negative division. Indeed, the DMN, which is often referred to as a task-negative network, was positively correlated with a canonical task-positive fronto-parietal network during low effort, but negatively correlated during higher load. The observed load effects were strong, confirming that the method used is sensitive in detecting connectivity changes in response to altering levels of cognitive effort, and extend previous reports of load effects on functional connectivity in healthy individuals22,25,50 and clinical samples.31,51,52
In addition to providing novel clues about the modulation of brain network dynamics by cognitive effort, the results suggest a “hypoconnectivity” effect in schizophrenia related to a network consisting of insula and connected brain regions overlapping with a “salience network”27 and a “cingulo-opercular network,”53 as well as default-mode and visual networks. The insular network was involved in connections showing group differences not only at a strict statistical threshold, but also in several connections showing trend effects, pointing to a relatively widespread insular network dysconnectivity in schizophrenia. Whereas the neurobiological mechanisms remain unclear, the present results extend recent findings27,45,46,54 by showing that the implicated networks generalize across levels of cognitive effort. This is in line with recent reports of reduced connectivity in schizophrenia across load conditions.31
The lack of interactions between cognitive effort and diagnosis indicates that the functional dysconnectivity in schizophrenia is not specifically related to increased cognitive demands, at least when considering the connectivity between (as opposed to within) networks. However, whether effects of diagnosis on brain connectivity generalize across cognitive domains is still unclear. An intriguing hypothesis is that brain network dysfunction in schizophrenia is not specifically related to cognitive effort or domain-specific contexts, but is rather a manifestation of intrinsic neuronal dysfunction. Further studies assessing a range of cognitive domains and effort levels are needed to test this hypothesis of a domain- and effort-nonspecific dysfunction in schizophrenia.
The DMN,55 as well as visual brain regions56 and visual/insula connections,46 are previously implicated in schizophrenia. In a resting-state fMRI study, Palaniyappan et al46 observed a failure of directed influence from visual cortex to insula, and a failure of both feedforward and reciprocal influence between insula and dorsolateral prefrontal cortex. These results indicate that insula constitutes a link in abnormal hierarchical processing in schizophrenia, between sensory regions, the insular (“salience”) network and a prefrontal executive network.46 Further studies employing causal modelling of component time series are warranted.
Most connections did not show group effects, indicating that the differences in brain connectivity between patients and controls are not “pervasive.” Instead, they seem to be related to specific networks. Imaging studies comprising other clinical groups have reported abnormalities in overlapping brain networks, particularly the DMN,55 although insular dysfunction has also been reported in depression,57 autism,58,59 and dementia.60 This suggests that the current network dysfunction may not be specific to schizophrenia, but rather partly reflect a common brain dysfunction across disorders. Further studies including a variety of disorders of brain biology and network dysfunction are needed.
A range of demographic and clinical factors influence functional connectivity patterns,10,20,61–66 and may partly explain previous inconsistencies. We performed post hoc analyses in order to delineate effects of potential confounders. All main effects of load and diagnosis remained when statistically controlling for age, sex, and subject motion. Current symptomatology, substance use, and medication did not have major effects on the results. Patients presented with relatively low symptom levels, which were not associated with connections showing group effects. Further, there were no effects of substance use on brain connectivity across groups. Medication (antipsychotics, antidepressants, and anxiolytics) was associated with the strength of the connections showing group effects at high load, indicating decreasing and increasing connectivity with increasing use in the DMN/insula and visual/insula connections, respectively. However, since this is a naturalistic study, there is an inherent association between clinical severity, symptoms, and medication status, which is difficult to disentangle. Also, since all patients were medicated, it is not possible to isolate effects of disease from effects of medication. It is therefore unclear to which degree the current findings reflect brain abnormalities related to vulnerability and secondary disease-related effects, respectively, and further studies in high-risk individuals are needed.67–70
Patients showed reduced target discrimination and slower responses compared with controls. Several connections in 2-back, but not 0-back, were associated with target discrimination across groups, indicating increasing connectivity with increasing performance, even when controlling for diagnosis. Also, in connections showing effects of diagnosis, the group difference in connectivity within each task condition remained when controlling for performance, except for the DMN/insula connection during 2-back, which was only marginally significant. This connection was associated with target discrimination within patients, indicating not only a reduced DMN/insula connectivity, but also an even more reduced connectivity in low performing patients. These results indicate that task performance is associated with functional connectivity patterns at high load, and that differences in performance may partly explain group differences in connectivity between default-mode and insula networks. However, since cognitive dysfunction is partly a direct consequence of pathophysiological mechanisms of schizophrenia, dissociating the unique cognitive and pathophysiological contributions is nontrivial, both statistically and conceptually. Also, due to ceiling effects on task performance, the present findings must be interpreted with caution.
We assessed brain connectivity using a blocked paradigm. Whereas low and high effort runs were identical in terms of number and duration of on- and off-blocks, the task design could potentially influence the results. Two additional and complementary analytical approaches provided highly converging results, demonstrating that whereas the estimated connectivity matrices are related to the design, the effects of cognitive load and diagnosis cannot be explained by task design per se. Cerebellum was omitted from the field of view in several participants, and was therefore not included in the analyses. Thus, we cannot draw any conclusions about cerebellar networks and their role in schizophrenia. Whereas the true dimensionality of the fMRI brain network space is unknown, the relatively low model order in the current study yielded distinct canonical components that were not divided into subnetworks, allowing for interpretations on the level of large-scale networks which show high reliability and reproducibility across methodological approaches. Although we found similar results at higher dimensionalities, future studies are needed to characterize effects of cognitive effort and schizophrenia across dimensionalities and levels in the network hierarchy.
Conclusively, the current results outline a complex and dynamic interplay between brain networks involved in cognitive effort, and provide evidence of reduced functional connectivity in schizophrenia that is independent of cognitive effort and specifically related to insular, default-mode, and visual networks. These novel results point to a relatively generalized system-level brain connectivity dysfunction in schizophrenia and have implications for the understanding of schizophrenia pathophysiology.
Supplementary Material
Supplementary material is available at http://schizophreniabulletin.oxfordjournals.org.
Funding
Research Council of Norway (204966/F20, 223273, 213837); South-Eastern Norway Regional Health Authority (2015073, 2011-080, 2013-123); Kristian Gerhard Jebsen Foundation.
Supplementary Material
Acknowledgments
The authors would like to thank the participants of the study for their contribution, and the clinicians who were involved in patient recruitment and clinical assessments. A special thanks to Anne Hilde Farstad and the staff at the Department of Radiology and Nuclear Medicine, and Eivind Bakken and Thomas D. Bjella in the TOP study, for providing technical assistance. K.H. has stock ownership in the NordicNeuroLab, Inc which has supplied audio-visual and other hardware equipment for the fMRI image acquisitions, as well as software for fMRI data analysis. All other authors report no conflicts of interest.
References
- 1. Green MF. Cognitive impairment and functional outcome in schizophrenia and bipolar disorder. J Clin Psychiatry. 2006;67(suppl 9):3–8; discussion 36–42. [PubMed] [Google Scholar]
- 2. Kahn RS, Keefe RS. Schizophrenia is a cognitive illness: time for a change in focus. JAMA Psychiatry. 2013;70:1107–1112. [DOI] [PubMed] [Google Scholar]
- 3. Stefansson H, Meyer-Lindenberg A, Steinberg S, et al. CNVs conferring risk of autism or schizophrenia affect cognition in controls. Nature. 2014;505:361–366. [DOI] [PubMed] [Google Scholar]
- 4. Glahn DC, Ragland JD, Abramoff A, et al. Beyond hypofrontality: a quantitative meta-analysis of functional neuroimaging studies of working memory in schizophrenia. Hum Brain Mapp. 2005;25:60–69. [DOI] [PMC free article] [PubMed] [Google Scholar]
- 5. Rimol LM, Hartberg CB, Nesvåg R, et al. Cortical thickness and subcortical volumes in schizophrenia and bipolar disorder. Biol Psychiatry. 2010;68:41–50. [DOI] [PubMed] [Google Scholar]
- 6. Rimol LM, Nesvåg R, Hagler DJ, Jr, et al. Cortical volume, surface area, and thickness in schizophrenia and bipolar disorder. Biol Psychiatry. 2012;71:552–560. [DOI] [PubMed] [Google Scholar]
- 7. Gur RE, Gur RC. Functional magnetic resonance imaging in schizophrenia. Dialogues Clin Neurosci. 2010;12:333–343. [DOI] [PMC free article] [PubMed] [Google Scholar]
- 8. Friston KJ, Frith CD. Schizophrenia: a disconnection syndrome? Clin Neurosci. 1995;3:89–97. [PubMed] [Google Scholar]
- 9. van den Heuvel MP, Fornito A. Brain networks in schizophrenia. Neuropsychol Rev. 2014;24:32–48. [DOI] [PubMed] [Google Scholar]
- 10. Pettersson-Yeo W, Allen P, Benetti S, McGuire P, Mechelli A. Dysconnectivity in schizophrenia: where are we now? Neurosci Biobehav Rev. 2011;35:1110–1124. [DOI] [PubMed] [Google Scholar]
- 11. Friston KJ. Functional and effective connectivity: a review. Brain Connect. 2011;1:13–36. [DOI] [PubMed] [Google Scholar]
- 12. Meehan TP, Bressler SL. Neurocognitive networks: findings, models, and theory. Neurosci Biobehav Rev. 2012;36:2232–2247. [DOI] [PubMed] [Google Scholar]
- 13. van den Heuvel MP, Sporns O. Network hubs in the human brain. Trends Cogn Sci. 2013;17:683–696. [DOI] [PubMed] [Google Scholar]
- 14. Bullmore E, Sporns O. Complex brain networks: graph theoretical analysis of structural and functional systems. Nat Rev Neurosci. 2009;10:186–198. [DOI] [PubMed] [Google Scholar]
- 15. van den Heuvel MP, Hulshoff Pol HE. Exploring the brain network: a review on resting-state fMRI functional connectivity. Eur Neuropsychopharmacol. 2010;20:519–534. [DOI] [PubMed] [Google Scholar]
- 16. Friston KJ, Frith CD, Liddle PF, Frackowiak RS. Functional connectivity: the principal-component analysis of large (PET) data sets. J Cereb Blood Flow Metab. 1993;13:5–14. [DOI] [PubMed] [Google Scholar]
- 17. Allen EA, Erhardt EB, Damaraju E, et al. A baseline for the multivariate comparison of resting-state networks. Front Syst Neurosci. 2011;5:2. [DOI] [PMC free article] [PubMed] [Google Scholar]
- 18. Cole DM, Smith SM, Beckmann CF. Advances and pitfalls in the analysis and interpretation of resting-state FMRI data. Front Syst Neurosci. 2010;4:8. [DOI] [PMC free article] [PubMed] [Google Scholar]
- 19. Smith SM, Fox PT, Miller KL, et al. Correspondence of the brain’s functional architecture during activation and rest. Proc Natl Acad Sci U S A. 2009;106:13040–13045. [DOI] [PMC free article] [PubMed] [Google Scholar]
- 20. Biswal BB, Mennes M, Zuo XN, et al. Toward discovery science of human brain function. Proc Natl Acad Sci U S A. 2010;107:4734–4739. [DOI] [PMC free article] [PubMed] [Google Scholar]
- 21. Cole MW, Bassett DS, Power JD, Braver TS, Petersen SE. Intrinsic and task-evoked network architectures of the human brain. Neuron. 2014;83:238–251. [DOI] [PMC free article] [PubMed] [Google Scholar]
- 22. Ma L, Steinberg JL, Hasan KM, et al. Working memory load modulation of parieto-frontal connections: evidence from dynamic causal modeling. Hum Brain Mapp. 2012;33:1850–1867. [DOI] [PMC free article] [PubMed] [Google Scholar]
- 23. Cocchi L, Zalesky A, Fornito A, Mattingley JB. Dynamic cooperation and competition between brain systems during cognitive control. Trends Cogn Sci. 2013;17:493–501. [DOI] [PubMed] [Google Scholar]
- 24. Cocchi L, Halford GS, Zalesky A, et al. Complexity in relational processing predicts changes in functional brain network dynamics. Cereb Cortex. 2014;24:2283–2296. [DOI] [PubMed] [Google Scholar]
- 25. Newton AT, Morgan VL, Rogers BP, Gore JC. Modulation of steady state functional connectivity in the default mode and working memory networks by cognitive load. Hum Brain Mapp. 2011;32:1649–1659. [DOI] [PMC free article] [PubMed] [Google Scholar]
- 26. Fornito A, Zalesky A, Pantelis C, Bullmore ET. Schizophrenia, neuroimaging and connectomics. Neuroimage. 2012;62:2296–2314. [DOI] [PubMed] [Google Scholar]
- 27. Palaniyappan L, Liddle PF. Does the salience network play a cardinal role in psychosis? An emerging hypothesis of insular dysfunction. J Psychiatry Neurosci. 2012;37:17–27. [DOI] [PMC free article] [PubMed] [Google Scholar]
- 28. Rubinov M, Bullmore E. Schizophrenia and abnormal brain network hubs. Dialogues Clin Neurosci. 2013;15:339–349. [DOI] [PMC free article] [PubMed] [Google Scholar]
- 29. Deserno L, Sterzer P, Wüstenberg T, Heinz A, Schlagenhauf F. Reduced prefrontal-parietal effective connectivity and working memory deficits in schizophrenia. J Neurosci. 2012;32:12–20. [DOI] [PMC free article] [PubMed] [Google Scholar]
- 30. Fornito A, Yoon J, Zalesky A, Bullmore ET, Carter CS. General and specific functional connectivity disturbances in first-episode schizophrenia during cognitive control performance. Biol Psychiatry. 2011;70:64–72. [DOI] [PMC free article] [PubMed] [Google Scholar]
- 31. Repovš G, Barch DM. Working memory related brain network connectivity in individuals with schizophrenia and their siblings. Front Hum Neurosci. 2012;6:137. [DOI] [PMC free article] [PubMed] [Google Scholar]
- 32. Smith SM, Miller KL, Salimi-Khorshidi G, et al. Network modelling methods for FMRI. Neuroimage. 2011;54:875–891. [DOI] [PubMed] [Google Scholar]
- 33. Brandt CL, Eichele T, Melle I, et al. Working memory networks and activation patterns in schizophrenia and bipolar disorder: comparison with healthy controls. Br J Psychiatry. 2014;204:290–298. [DOI] [PubMed] [Google Scholar]
- 34. Haatveit BC, Sundet K, Hugdahl K, et al. The validity of d prime as a working memory index: results from the “Bergen n-back task”. J Clin Exp Neuropsychol 2010;32:871–880. [DOI] [PubMed] [Google Scholar]
- 35. Hugdahl K, Rund BR, Lund A, et al. Brain activation measured with fMRI during a mental arithmetic task in schizophrenia and major depression. Am J Psychiatry. 2004;161:286–293. [DOI] [PubMed] [Google Scholar]
- 36. Fischl B, Salat DH, Busa E, et al. Whole brain segmentation: automated labeling of neuroanatomical structures in the human brain. Neuron. 2002;33:341–355. [DOI] [PubMed] [Google Scholar]
- 37. Jenkinson M, Beckmann CF, Behrens TE, Woolrich MW, Smith SM. FSL. Neuroimage. 2012;62:782–790. [DOI] [PubMed] [Google Scholar]
- 38. Jenkinson M, Bannister P, Brady M, Smith S. Improved optimization for the robust and accurate linear registration and motion correction of brain images. Neuroimage. 2002;17:825–841. [DOI] [PubMed] [Google Scholar]
- 39. Smith SM. Fast robust automated brain extraction. Hum Brain Mapp. 2002;17:143–155. [DOI] [PMC free article] [PubMed] [Google Scholar]
- 40. Beckmann CF, DeLuca M, Devlin JT, Smith SM. Investigations into resting-state connectivity using independent component analysis. Philos Trans R Soc Lond B Biol Sci. 2005;360:1001–1013. [DOI] [PMC free article] [PubMed] [Google Scholar]
- 41. Beckmann CF, Smith SM. Probabilistic independent component analysis for functional magnetic resonance imaging. IEEE Trans Med Imaging. 2004;23:137–152. [DOI] [PubMed] [Google Scholar]
- 42. Beckmann CF, Mackay CE, Filippini N, Smith SM. Group comparison of resting-state FMRI data using multi-subject ICA and dual regression. OHBM; 2009. [Google Scholar]
- 43. Filippini N, MacIntosh BJ, Hough MG, et al. Distinct patterns of brain activity in young carriers of the APOE-epsilon4 allele. Proc Natl Acad Sci U S A. 2009;106:7209–7214. [DOI] [PMC free article] [PubMed] [Google Scholar]
- 44. O’Reilly JX, Woolrich MW, Behrens TE, Smith SM, Johansen-Berg H. Tools of the trade: psychophysiological interactions and functional connectivity. Soc Cogn Affect Neurosci. 2012;7:604–609. [DOI] [PMC free article] [PubMed] [Google Scholar]
- 45. Manoliu A, Riedl V, Zherdin A, et al. Aberrant dependence of default mode/central executive network interactions on anterior insular salience network activity in schizophrenia. Schizophr Bull. 2014;40:428–437. [DOI] [PMC free article] [PubMed] [Google Scholar]
- 46. Palaniyappan L, Simmonite M, White TP, Liddle EB, Liddle PF. Neural primacy of the salience processing system in schizophrenia. Neuron. 2013;79:814–828. [DOI] [PMC free article] [PubMed] [Google Scholar]
- 47. Duncan J. The structure of cognition: attentional episodes in mind and brain. Neuron. 2013;80:35–50. [DOI] [PMC free article] [PubMed] [Google Scholar]
- 48. Spreng RN, Stevens WD, Chamberlain JP, Gilmore AW, Schacter DL. Default network activity, coupled with the frontoparietal control network, supports goal-directed cognition. Neuroimage. 2010;53:303–317. [DOI] [PMC free article] [PubMed] [Google Scholar]
- 49. Fornito A, Harrison BJ, Zalesky A, Simons JS. Competitive and cooperative dynamics of large-scale brain functional networks supporting recollection. Proc Natl Acad Sci U S A. 2012;109:12788–12793. [DOI] [PMC free article] [PubMed] [Google Scholar]
- 50. Honey GD, Bullmore ET, Sharma T. De-coupling of cognitive performance and cerebral functional response during working memory in schizophrenia. Schizophr Res. 2002;53:45–56. [DOI] [PubMed] [Google Scholar]
- 51. Çetin MS, Christensen F, Abbott CC, et al. Thalamus and posterior temporal lobe show greater inter-network connectivity at rest and across sensory paradigms in schizophrenia. Neuroimage. 2014;97:117–126. [DOI] [PMC free article] [PubMed] [Google Scholar]
- 52. Meyer-Lindenberg AS, Olsen RK, Kohn PD, et al. Regionally specific disturbance of dorsolateral prefrontal-hippocampal functional connectivity in schizophrenia. Arch Gen Psychiatry. 2005;62:379–386. [DOI] [PubMed] [Google Scholar]
- 53. Dosenbach NU, Fair DA, Miezin FM, et al. Distinct brain networks for adaptive and stable task control in humans. Proc Natl Acad Sci U S A. 2007;104:11073–11078. [DOI] [PMC free article] [PubMed] [Google Scholar]
- 54. Wylie KP, Tregellas JR. The role of the insula in schizophrenia. Schizophr Res. 2010;123:93–104. [DOI] [PMC free article] [PubMed] [Google Scholar]
- 55. Broyd SJ, Demanuele C, Debener S, et al. Default-mode brain dysfunction in mental disorders: a systematic review. Neurosci Biobehav Rev. 2009;33:279–296. [DOI] [PubMed] [Google Scholar]
- 56. Butler PD, Silverstein SM, Dakin SC. Visual perception and its impairment in schizophrenia. Biol Psychiatry. 2008;64:40–47. [DOI] [PMC free article] [PubMed] [Google Scholar]
- 57. Manoliu A, Meng C, Brandl F, et al. Insular dysfunction within the salience network is associated with severity of symptoms and aberrant inter-network connectivity in major depressive disorder. Front Hum Neurosci. 2013;7:930. [DOI] [PMC free article] [PubMed] [Google Scholar]
- 58. Uddin LQ, Menon V. The anterior insula in autism: under-connected and under-examined. Neurosci Biobehav Rev. 2009;33:1198–1203. [DOI] [PMC free article] [PubMed] [Google Scholar]
- 59. Uddin LQ, Supekar K, Lynch CJ, et al. Salience network-based classification and prediction of symptom severity in children with autism. JAMA Psychiatry. 2013;70:869–879. [DOI] [PMC free article] [PubMed] [Google Scholar]
- 60. Seeley WW. Anterior insula degeneration in frontotemporal dementia. Brain Struct Funct. 2010;214:465–475. [DOI] [PMC free article] [PubMed] [Google Scholar]
- 61. Mowinckel AM, Espeseth T, Westlye LT. Network-specific effects of age and in-scanner subject motion: a resting-state fMRI study of 238 healthy adults. Neuroimage. 2012;63:1364–1373. [DOI] [PubMed] [Google Scholar]
- 62. Zeng LL, Wang D, Fox MD, et al. Neurobiological basis of head motion in brain imaging. Proc Natl Acad Sci U S A. 2014;111:6058–6062. [DOI] [PMC free article] [PubMed] [Google Scholar]
- 63. Cousijn J, Vingerhoets WA, Koenders L, et al. Relationship between working-memory network function and substance use: a 3-year longitudinal fMRI study in heavy cannabis users and controls. Addict Biol. 2014;19:282–293. [DOI] [PubMed] [Google Scholar]
- 64. Wojtalik JA, Barch DM. An FMRI study of the influence of a history of substance abuse on working memory-related brain activation in schizophrenia. Front Psychiatry. 2014;5:1. [DOI] [PMC free article] [PubMed] [Google Scholar]
- 65. Nejad AB, Ebdrup BH, Glenthøj BY, Siebner HR. Brain connectivity studies in schizophrenia: unravelling the effects of antipsychotics. Curr Neuropharmacol. 2012;10:219–230. [DOI] [PMC free article] [PubMed] [Google Scholar]
- 66. Röder CH, Hoogendam JM, van der Veen FM. FMRI, antipsychotics and schizophrenia. Influence of different antipsychotics on BOLD-signal. Curr Pharm Des. 2010;16:2012–2025. [DOI] [PubMed] [Google Scholar]
- 67. Lui S, Yao L, Xiao Y, et al. Resting-state brain function in schizophrenia and psychotic bipolar probands and their first-degree relatives. Psychol Med. 2015;45:97–108. [DOI] [PMC free article] [PubMed] [Google Scholar]
- 68. Schmidt A, Borgwardt S. Abnormal effective connectivity in the psychosis high-risk state. Neuroimage. 2013;81:119–120. [DOI] [PubMed] [Google Scholar]
- 69. Anticevic A, Tang Y, Cho YT, et al. Amygdala connectivity differs among chronic, early course, and individuals at risk for developing schizophrenia. Schizophr Bull. 2014;40:1105–1116. [DOI] [PMC free article] [PubMed] [Google Scholar]
- 70. Anticevic A, Corlett PR, Cole MW, et al. N-methyl-D-aspartate receptor antagonist effects on prefrontal cortical connectivity better model early than chronic schizophrenia. Biol Psychiatry. July 30, 2014; doi:10.1016/j.biopsych.2014.07.022. [DOI] [PubMed] [Google Scholar]
Associated Data
This section collects any data citations, data availability statements, or supplementary materials included in this article.