

Abstract
In this study, we investigated the mechanisms through which microRNAs (miRNAs or miRs) regulate lung development after birth, as well as the role of miRNAs in the development of bronchopulmonary dysplasia (BPD). For this purpose, a total of 90 neonatal Wistar rats were randomly and equally assigned to either a model group or a control group. On postnatal days 3, 7 and 14, the lung tissues were collected for histological analysis to determine morphological changes. The expression levels of proliferating cell nuclear antigen (PCNA) and platelet endothelial cell adhesion molecule-1 (PECAM-1, also known as CD31) were measured by RT-qPCR and western blot analysis. A miRCURY™ LNA array was employed to screen for differentially expressed miRNAs, and the possible target genes of those miRNAs were predicted. Our results revealed that, compared with the control group, the following changes induced by hyperoxia were observed in the model group over time: a decrease in the number, but an increase in the size of the alveoli, and a decrease in the number of secondary septa formed. In the model group, from postnatal days 3–14, the mRNA and protein expression levels of PCNA and CD31 were significantly lower than those in the control group. The differentially expressed miRNAs between the 2 groups were identified on days 3, 7 and 14 after birth. Possible target genes were identified for 32 differentially expressed miRNAs. Taken together, these findings suggest that during the development of BPD, an alveolarization disorder with microvascular dysplasia co-exists with the differential expression of certain miRNAs during the different stages of alveolar development in a neonatal rat model of hyperoxia-induced BPD. This indicates that miRNAs may participate in the occurrence and development of BPD.
Keywords: microRNA, microarray, lung development, alveolarization, bronchopulmonary dysplasia
Introduction
Bronchopulmonary dysplasia (BPD) is a serious respiratory complication, affecting premature infants. In recent years, the administration of antenatal steroids and postnatal pulmonary surfactants, coupled with the advancements in rescue technologies for very low birth weight and extremely low birth weight infants, has meant that the pathological characteristics of BPD have changed so now the disease is characterized as an alveolarization disorder with microvascular dysplasia (1). The reported incidence of BPD is 42% for premature infants with a birth weight between 501–750 g and 25% for those with a birth weight between 751–1,000 g (2). Patients with BPD often have an increased risk of hospital readmission as a result of developing respiratory disorders after discharge and a greater probability of requiring drug intervention (3), and they are also more susceptible to nervous system developmental disorders involving recognition, speech, motion and behavioural problems (4).
The lungs arise from the anterior foregut endoderm, and normal human lung development is commonly divided into five stages: the embryonic stage (4–7 weeks post-conception), pseudoglandular stage (5–17 weeks post-conception), canalicular stage (16–24 weeks post-conception), saccular stage (24–35 weeks post-conception) and alveolar stage (36 weeks post-conception to 2 years postnatal). During the final stage, the secondary septa divide the saccular units, increasing the alveolar number and reducing the alveolar size. The majority of the gas exchange surface is formed during this stage. The alveolar stage is a critical stage in the development of BPD (5,6).
It has been demonstrated that the disruption of the formation of secondary septa and arrested alveolarization in BPD may be caused by the abnormal accumulation of extracellular matrix components (including elastins) and angiodysplasia (7,8). These studies have only partially elucidated the mechanisms responsible for alveolarization arrest in BPD and thus, further investigations are required to fully elucidate the mechanisms responsible for the development of BPD in order to establish effective treatment methods.
MicroRNAs (miRNAs or miRs) are a group of endogenous non-coding RNAs that are 22–25 nucleotides (nt) in length, and their 5′-seed sequence specifically binds to the 3′-UTR base sequence of target mRNAs to cause the degradation or translational suppression of target mRNAs, and thus they play a role in regulating gene expression at the post-transcriptional level (9). Studies have demonstrated that miRNAs participate widely in various life processes, such as cell differentiation, proliferation and apoptosis, as well as organ development, tumorigenesis and immune response, and are highly conserved among species (10,11). It has been confirmed that miRNA expression during lung development changes dynamically, indicating that miRNAs participate in the regulation of lung development (12). miRNAs have also been found to play an important role in the development of lung diseases such as asthma, idiopathic pulmonary fibrosis and lung cancer (13–15).
Studies have revealed the functions of miRNAs in embryonic lung development. miR-17 and its homologous genes miR-20a and miR-106b were found to have high levels of expression during the pseudoglandular stage of lung development (16). In mice with an overexpression of the miR-17–92 cluster, the proliferation of pulmonary epithelial progenitors takes place, but cell differentiation is suppressed, demonstrating an abnormal lethal phenotype (17). The miR-17 family alters E-cadherin expression and distribution, as well as β-catenin activity by regulating STAT3 and MAPK14, which eventually increases the number and area of terminal branches (18). Navarro et al (19) found that let-7 expression was downregulated in the pseudoglandular stage of lung development. Let-7 suppresses the Ras-Raf-MAP kinase pathway and thus, causes a decrease in cell viability and the proliferation rate. Bhaskaran et al (20) found the highest expression level of miR-127 during the late stage of rat embryonic lung development (E21, saccular stage) and that miR-127 expression shifted from mesenchymal cells to epithelial cells during embryonic lung development. In lung tissue cultures, the overexpression of miR-127 resulted in a defect in pulmonary branch formation. Zhang et al (21) observed that A549 cell proliferation was significantly suppressed following transfection with miR-127. Yet, little is known about the role of miRNAs in the regulation of postnatal lung development and in the development of BPD.
Thus, in the present study, we investigated the mechanisms through which miRNAs regulate lung development after birth, as well as the role of miRNAs in the development of bronchopulmonary dysplasia (BPD) using a rat model of BPD induced by hyperoxia.
Materials and methods
Animal models
All animal procedures were approved by the Committee on the Ethics of Animal Experiments of China Medical University, Shenyang, China. All surgeries were performed under chloral hydrate anesthesia, and all efforts were made to minimize animal suffering.
Full-term newborn Wistar rats (purchased from the Experimental Animal Center of Shengjing Hospital of China Medical University, Shenyang, China) were randomly assigned to either the model group (n=45) or the control group (n=45) within 12 h after birth. The neonatal rats in the model group were kept in a glass chamber with an oxygen concentration between 60–85%, monitored continuously by an oxygen analyzer. The newborn rats in the control group inhaled fresh air (21% oxygen). All other conditions and control factors were the same as those of the model group. The nursing rats were exchanged between the 2 groups every 24 h to avoid oxygen toxicity.
Lung tissue preparation
On postnatal days 3, 7 and 14, 15 pups from both groups were anesthetized by intraperitoneal injection of 10% chloral hydrate. The chest of the rats was then opened, and whole lungs were collected. The inferior lobe of the right lung was fixed in 4% paraformaldehyde for hematoxylin and eosin (H&E) staining. The remaining lung tissue was preserved in liquid nitrogen: the left lungs were used for mRNA detection and microarray analysis, while the right lungs were used for western blot analysis. From each group and at each time point, 10 inferior lobes from the right lungs (one from each litter) were randomly selected for morphological evaluation. Five left lungs were randomly selected for the measurement of mRNA expression, while 3 left lungs were selected for microarray analysis and 5 right lungs were selected for the measurement of protein expression.
Lung histology
The inferior lobes from the right lungs were fixed in 4% paraformaldehyde for 24 h, and then dehydrated in gradient ethanol, vitrified in xylene and embedded in paraffin. The paraffin-embedded sections (4-µm-thick) were stained with H&E. Morphological changes were evaluated using an optical microscope (×40 magnification; AX70+U-PHOTO; Olympus, Tokyo, Japan). Ten fields were randomly selected for analysis from each section. The radial alveolar count (RAC) was counted with a method developed by Emery and Mithal, as described in our previous study (22), to assess the level of alveolarization. The counting was carried out by 2 independent pathologists who were blinded to the experimental design.
Western blot analysis
The protein expression levels were determined using rabbit polyclonal anti-proliferating cell nuclear antigen (PCNA) antibody (ab2426, 1:200 dilution) and anti-platelet endothelial cell adhesion molecule-1 (PECAM-1, also known CD31) antibody (ab32457, 1:1,000 dilution) (both from Abcam, Cambridge, UK). Briefly, total protein extracted from lung tissue was quantified using a BCA protein assay kit, 20 µl of protein was then loaded onto a 12% SDS-PAGE gel and transferred onto polyvinylidene difluoride membranes (Millipore, Billerica, MA, USA). The membranes were blocked with 5% skimmed milk for 1 h, then incubated with anti-PCNA or anti-CD31 antibody diluted in PBS overnight at 4°C. After being washed in Tris-buffered saline + 1% Tween-20 (TBST), the membranes were incubated for 2 h with horseradish peroxidase-conjugated secondary antibody and then imaged using enhanced chemiluminescence reagents. The density of the protein bands was analyzed using ImageJ software. GAPDH was used as an internal control.
RNA extraction
Total RNA was isolated following the manufacturer's instructions using TRIzol reagent (Invitrogen, Carlsbad, CA, USA) and the miRNeasy mini kit (Qiagen, Hilden, Germany). It was then qualified and quantified using a NanoDrop spectrophotometer (ND-1000; NanoDrop Technologies, Wilmington, DE, USA).
Reverse transcription-quantitative polymerase chain reaction (RT-qPCR)
A total of 1 µg of RNA was reverse-transcribed into cDNA using the PrimeScript™ RT reagent kit (Takara Biotechnology, Dalian, China), according to the manufacturer's instructions. qPCR was performed on a LightCycler (Applied Biosystems 7500 Fast Real-Time PCR System; Applied Biosystems, Carlsbad, CA, USA). Appropriate primers were designed using Primer Premier 5.0 software (Premier Biosoft International, Palo Alto, CA, USA) and the primer sequences are listed in Table I. The reaction was carried out at 95°C for 30 sec, 60°C for 34 sec, and 72°C for 1 min for 40 cycles. The relative transcript levels were normalized to GAPDH and evaluated using the ΔΔCT method.
Table I.
Sequences of primers used for RT-qPCR.
| Gene name | Primer sequences |
|---|---|
| CD31 | F: CTGGGAGGTATCGAATGGGC |
| R: CCCGAGACTGAGGAATGACG | |
| PCNA | F: TAAGGGCTGAAGATAATGCTGAT |
| R: CCTGTTCTGGGATTCCAAGTT | |
| GAPDH | F: AGACAGCCGCATCTTCTTGT |
| R: CTTGCCGTGGGTAGAGTCAT |
F, forward; R, reverse; RT-qPCR, reverse transcription-quantitative polymerase chain reaction.
miRNA microarray
We used the seventh generation of the miRCURY™ LNA array (v.18.0) (Exiqon, Vedbaek, Denmark), which covered all rat miRNAs in the miRBase 18.0, to detect the expression of miRNAs in rat lungs.
RNA labeling
Total RNA was labeled with the miRCURY™ Hy3™/Hy5™ Power labeling kit (Exiqon) according to the manufacturer's instructions. Briefly, 1 µg of RNA was added to the mixture of 1.0 µl of CIP buffer and 1.0 µl of CIP (Exiqon), incubated for 30 min at 37°C and terminated by incubation for 5 min at 95°C. Subsequently, 3.0 µl of labeling buffer, 1.5 µl of fluorescent label (Hy3™), 2.0 µl of DMSO and 2.0 µl of T4 RNA ligase were added to the mixture. The labeling reaction was incubated for 1 h at 16°C and terminated by incubation for 15 min at 65°C.
Array hybridization
The Hy3™-labeled samples were hybridized with the miRCURY™ LNA array (v.18.0), according to the manufacturer's instructions. A total of 25 µl of samples, mixed with the equivalent amount of hybridization buffer, was first denatured for 2 min at 95°C, incubated on ice for 2 min, and then hybridized to the microarray for 16–20 h at 56°C. The 12-Bay Hybridization system (Nimblegen Systems, Inc., Madison, WI, USA) controls active mixing action and temperature, enabling uniform hybridization and an enhanced signal. Subsequently, the slides were washed several times with the wash buffer kit (Exiqon), dried by centrifugation at 400 rpm for 5 min, and then scanned using an Axon GenePix 4000B microarray scanner (Axon Instruments, Foster City, CA, USA).
Data analysis
Grid alignment and data extraction were carried out using GenePix Pro 6.0 software (Axon Instruments). Replicated miRNAs were averaged, and miRNAs with intensities of ≥30 were selected from all the samples for calculation of the normalization factor. Data were normalized with a median normalization. Significantly differentially expressed miRNAs between the 2 groups were then confirmed with volcano plot filtering. Hierarchical clustering was accomplished with MEV software (v4.6, TIGR).
miRNA target prediction
The significantly differentially expressed miRNAs were ran through 3 online databases, miRBase (http://www.ebi.ac.uk/enright-srv/microcosm/htdocs/targets/v5/), miRanda (http://www.microrna.org/microrna/home.do) and miRDB (http://mirdb.org/miRDB/) for target prediction. The overlapping section was obtained from these databases.
Statistical analysis
We used SPSS17.0 software for statistical analysis. Values are presented as the means ± standard deviation (SD); statistical significance was determined using the Student's t-test. A P-value of <0.05 was considered to indicate a statistically significant difference.
Results
Histology
On postnatal day 3, the alveolar wall in the model group was slightly thicker than that of the control group (Fig. 1A and B). By day 7, the number of alveoli had significantly decreased, and the formation of the secondary septa was reduced; the alveolar size was also slightly increased in the model group (Fig. 1C and D). On day 14, the following changes between the 2 groups became more apparent: thickening of the alveolar wall, a decrease in the number of alveoli, reduced numbers of secondary septa, and alveolar structural abnormalities (Fig. 1E and F). Compared with the control group, the RAC value in the BPD model group had markedly decreased by postnatal day 7 (P<0.05), and the difference between the 2 groups was even greater by day 14 (P<0.01) (Fig. 2). These results indicated that the formation of secondary septa was impaired and that alveolarization was suppressed in the rats in the model group, indicative of BPD.
Figure 1.

Changes in lung morphology. Lung sections were stained with H&E and images were captured under a light microscope (magnification, ×40). (A andB) On postnatal day 3, the alveolar walls were slightly thicker in the model group (M3d) compared to the control group (C3d). (C and D) On postnatal day 7, the number of alveoli had markedly decreased, secondary septa formation was reduced, and the alveolar size was slightly increased in the model group (M7d) compared to the control group (C7d). (E and F) On postnatal day 14, the following changes between the 2 groups became more apparent: thickening of the alveolar wall, decrease in the number of alveoli, reduced numbers of secondary septa, and alveolar structural abnormalities (control group, C14d; model group, M14d). Model group refers to the bronchopulmonary dysplasia (BPD) group.
Figure 2.
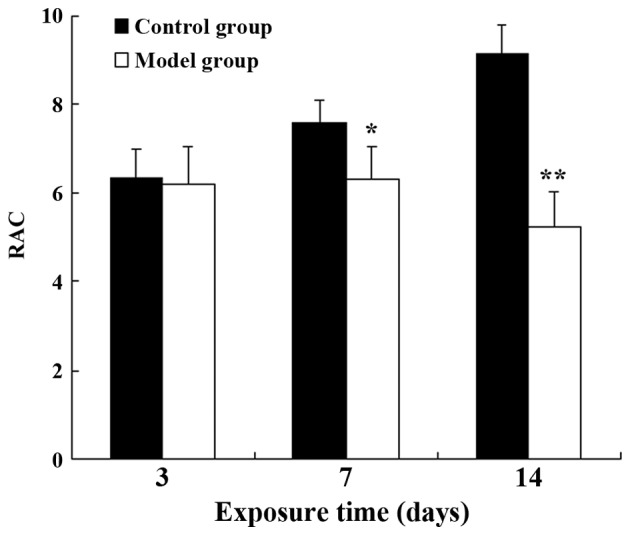
Effects on alveolarization measured using RAC values. In the control group, the RAC values increased over time. The same change was not observed in the bronchopulmonary dysplasia (BPD) model group. By postnatal days 7 and 14, the RAC values of the control group were significantly higher than those of the BPD model group. *P<0.05 and **P<0.01 vs. the control groups on the same day.
Expression of PCNA and CD31 in rat lung tissue
The mRNA and protein expression levels of PCNA and CD31 in the model group were significantly lower than those in the control group on postnatal days 3, 7 and 14 (CD31: P<0.05 on day 7; P<0.01 at the other time points; PCNA: P<0.05 at all time points) (Fig. 3). A similar effect was observed in the protein expression levels (PCNA: P<0.05 on day 3; P<0.01 at the other time points; CD31: P<0.05 at all time points) (Fig. 4).
Figure 3.
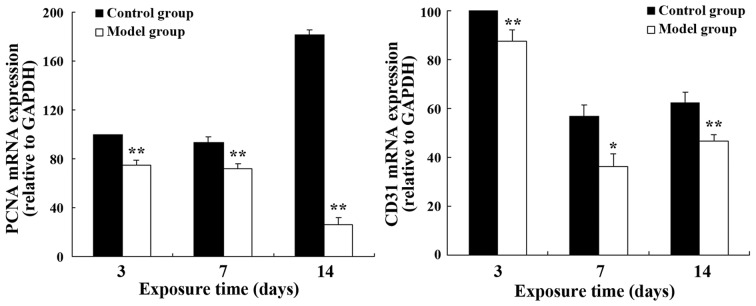
Relative mRNA expression of PCNA and CD31 in lung tissue. *P<0.05 and **P<0.01 vs. the control group on the same day.
Figure 4.

Protein expression of PCNA and CD31. *P<0.05 and **P<0.01 vs. the control group on the same day. C refers to the control group; M refers to the bronchopulmonary dysplasia (BPD) model group.
miRNA expression profiles in rat lung tissue
A total of 50 differentially expressed miRNAs passed the fold change and t-test filter between the 2 groups (fold change >2.0; P<0.05), and the upregulated and downregulated miRNAs are listed in Tables II and III, respectively.
Table II.
Differentially expressed and upregulated miRNAs at 3 time points between the 2 groups.
| M3d vs. C3d
|
M7d vs. C7d
|
M14d vs. C14d
|
|||
|---|---|---|---|---|---|
| Name | FC | Name | FC | Name | FC |
| rno-miR-490-3p | 2.05 | rno-miR-3584-3p | 6.38 | rno-miR-34c-3p | 2.25 |
| rno-miR-1193-3p | 5.06 | rno-let-7b-5p | 2.25 | ||
| rno-miR-3068-5p | 7.76 | ||||
| rno-miR-872-5p | 6.49 | ||||
| rno-miR-183-5p | 2.05 | ||||
| rno-miR-33-5p | 3.80 | ||||
| rno-miR-182 | 2.70 | ||||
| rno-miR-322-3p | 5.31 | ||||
| rno-miR-340-3p | 3.05 | ||||
| rno-miR-142-3p | 2.42 | ||||
| rno-miR-141-5p | 5.63 | ||||
| rno-miR-96-5p | 5.12 | ||||
| rno-let-7f-5p | 5.09 | ||||
| rno-miR-15b-5p | 7.81 | ||||
| rno-miR-449a-5p | 4.84 | ||||
| rno-miR-22-5p | 6.62 | ||||
| rno-miR-362-3p | 49.02 | ||||
| rno-miR-301a-3p | 4.08 | ||||
| rno-miR-365-3p | 3.03 | ||||
FC, fold change; M3d, model group on day 3; C3d, control group on day 3; M7d, model group on day 7; C7d, control group on day 7; M14d, model group on day 14; C14d, control group on day 14.
Table III.
Differentially expressed and downregulated miRNAs at 3 time points between the 2 groups.
| M3d vs. C3d
|
M7d vs. C7d
|
M14d vs. C14d
|
|||
|---|---|---|---|---|---|
| Name | FC | Name | Name | FC | Name |
| rno-miR-377-3p | 0.14 | rno-miR-542-5p | 0.43 | rno-miR-181c-3p | 0.30 |
| rno-miR-99a-3p | 0.35 | rno-miR-465-5p | 0.37 | ||
| rno-miR-139-5p | 0.26 | rno-miR-382-5p | 0.24 | ||
| rno-miR-208a-3p | 0.32 | rno-miR-208a-3p | 0.15 | ||
| rno-miR-33-5p | 0.43 | rno-miR-351-5p | 0.25 | ||
| rno-miR-190a-5p | 0.40 | rno-miR-503-3p | 0.25 | ||
| rno-miR-335 | 0.39 | rno-miR-127-3p | 0.18 | ||
| rno-miR-708-3p | 0.35 | rno-miR-664-2-5p | 0.30 | ||
| rno-miR-15b-5p | 0.45 | rno-miR-298-5p | 0.17 | ||
| rno-miR-674-3p | 0.45 | rno-miR-376a-3p | 0.49 | ||
| rno-miR-188-5p | 0.18 | rno-miR-186-5p | 0.35 | ||
| rno-miR-134-3p | 0.35 | ||||
| rno-miR-92a-3p | 0.48 | ||||
| rno-miR-378a-3p | 0.40 | ||||
| rno-miR-541-5p | 0.19 | ||||
| rno-miR-154-5p | 0.10 | ||||
FC, fold change; M3d, model group on day 3; C3d, control group on day 3; M7d, model group on day 7; C7d, control group on day 7; M14d, model group on day 14; C14d, control group on day 14.
We identified 1 downregulated miRNA (miR-377-3p) and 2 upregulated miRNAs (miR-490-3p and miR-1193-3p) on postnatal day 3 in the model group compared to the control group (M3d vs. C3d); 11 downregulated miRNAs (miR-542-5p, miR-99a-3p, miR-139-5p, miR-208a-3p, miR-33-5p, miR-190a-5p, miR-335, miR-708-3p, miR-15b-5p, miR-674-3p and miR-188-5p) and 1 upregulated miRNA (miR-3584-3p) on day 7 in the model group compared to the control group (M7d vs. C7d); and 16 downregulated miRNAs (miR-181c-3p, miR-465-5p, miR-382-5p, miR-208a-3p, miR-351-5p, miR-503-3p, miR-127-3p, miR-664-2-5p, miR-298-5p, miR-376a-3p, miR-186-5p, miR-134-3p, miR-92a-3p, miR-378a-3p, miR-541-5p and miR-154-5p) and 19 upregulated miRNAs (miR-34c-3p, let-7b-5p, miR-3068-5p, miR-872-5p, miR-183-5p, miR-33-5p, miR-182, miR-322-3p, miR-340-3p, miR-142-3p, miR-141-5p, miR-96-5p, let-7f-5p, miR-15b-5p, miR-449a-5p, miR-22-5p, miR-362-3p, miR-301a-3p and miR-365-3p) on day 14 in the model group compared to the control group (M14d vs. C14d).
We also identified miRNAs with a change in expression during septation in both groups by making comparisons of the 2 groups (model and control group) between days 14 and 3 (FC≥2, P<0.05). We found that compared with the control group on day 3 (C3d), 27 miRNAs were upregulated, and 20 were downregulated in the control group on day 14 (C14d); compared with the model group on day 3 (M3d), 19 miRNAs were upregulated, whereas 26 were downregulated in the model group on day 14 (M14d). The upregulated and downregulated miRNAs in the 2 groups on day 14 compared to day 3 are listed in Table IV.
Table IV.
Differentially expressed miRNAs of the 2 groups during septation.
| C14d vs. C3d
|
M14d vs. M3d
|
||||||
|---|---|---|---|---|---|---|---|
| Up
|
Down
|
Up
|
Down
|
||||
| Name | FC | Name | FC | Name | FC | Name | FC |
| rno-miR-425-5p | 2.85 | rno-miR-542-5p | 0.34 | rno-miR-31a-5p | 19.28 | rno-miR-665 | 0.47 |
| rno-miR-21-3p | 6.39 | rno-miR-218a-5p | 0.39 | rno-let-7b-5p | 2.38 | rno-miR-542-5p | 0.39 |
| rno-miR-181a-5p | 4.52 | rno-miR-3571 | 0.22 | rno-miR-10a-5p | 2.31 | rno-miR-329-3p | 0.19 |
| rno-miR-181c-3p | 2.71 | rno-miR-139-5p | 0.11 | rno-miR-146b-5p | 2.44 | rno-miR-668 | 0.31 |
| rno-miR-465-5p | 6.44 | rno-miR-33-5p | 0.28 | rno-miR-128-3p | 7.30 | rno-miR-466c-3p | 0.21 |
| rno-miR-23a-3p | 2.92 | rno-miR-24-1-5p | 0.34 | rno-miR-194-5p | 2.86 | rno-miR-3571 | 0.25 |
| rno-miR-208a-3p | 3.03 | rno-miR-342-3p | 0.31 | rno-miR-221-3p | 6.03 | rno-miR-434-3p | 0.39 |
| rno-miR-351-5p | 2.74 | rno-miR-503-5p | 0.28 | rno-miR-224-5p | 5.53 | rno-miR-136-5p | 0.44 |
| rno-miR-674-5p | 2.63 | rno-miR-142-3p | 0.50 | rno-miR-193-3p | 2.17 | rno-miR-431 | 0.13 |
| rno-miR-503-3p | 3.73 | rno-let-7e-5p | 0.29 | rno-miR-30d-3p | 4.32 | rno-miR-344b-2-3p | 0.38 |
| rno-miR-664-2-5p | 8.32 | rno-miR-448-5p | 0.28 | rno-miR-34b-5p | 2.37 | rno-miR-322-3p | 0.38 |
| rno-miR-298-5p | 3.45 | rno-miR-96-5p | 0.26 | rno-miR-24-2-5p | 2.55 | rno-miR-466b-2-3p | 0.27 |
| rno-miR-186-5p | 4.30 | rno-miR-7a-5p | 0.36 | rno-miR-222-3p | 3.78 | rno-miR-335 | 0.40 |
| rno-miR-25-3p | 3.07 | rno-miR-15b-5p | 0.12 | rno-miR-324-3p | 3.64 | rno-miR-127-3p | 0.27 |
| rno-miR-106b-3p | 2.24 | rno-miR-449a-5p | 0.20 | rno-miR-34a-5p | 2.69 | rno-miR-3572 | 0.40 |
| rno-miR-30d-3p | 3.72 | rno-miR-22-5p | 0.18 | rno-miR-100-5p | 2.26 | rno-miR-376a-3p | 0.16 |
| rno-miR-222-3p | 4.03 | rno-miR-455-5p | 0.18 | rno-let-7a-1-3p/rno-let-7c-2-3p | 3.45 | rno-miR-410-3p | 0.06 |
| rno-let-7e-3p | 3.39 | rno-miR-362-3p | 0.02 | rno-miR-143-5p | 2.21 | rno-miR-503-5p | 0.38 |
| rno-miR-30a-3p | 3.34 | rno-miR-301a-3p | 0.24 | rno-miR-146a-5p | 2.47 | rno-miR-667-3p | 0.31 |
| rno-miR-125a-3p | 4.42 | rno-miR-365-3p | 0.48 | rno-miR-185-3p | 0.24 | ||
| rno-miR-22-3p | 2.26 | rno-miR-134-3p | 0.35 | ||||
| rno-miR-30c-1-3p | 8.68 | rno-miR-466b-1-3p | 0.25 | ||||
| rno-miR-181b-5p | 4.92 | rno-miR-466d | 0.39 | ||||
| rno-miR-664-1-5p | 2.79 | rno-miR-541-5p | 0.15 | ||||
| rno-miR-339-5p | 3.88 | rno-miR-742-3p | 0.23 | ||||
| rno-miR-143-5p | 3.91 | rno-miR-3596c | 0.34 | ||||
| rno-miR-378a-3p | 2.09 | ||||||
FC, fold change; C14d, control group on day 14; C3d, control group on day 3; M14d, model group on day 14; M3d, model group on day 3.
Hierarchical clustering was carried out to illustrate the distinguishable miRNA expression profiles between the 2 groups at different time points. The heatmap is shown in Fig. 5.
Figure 5.

Hierarchical clustering of the 2 groups (M, model group; C, control group) on days 3, 7 and 14. The heatmap shows the result of the two-way hierarchical clustering of miRNAs and samples. Each row represents a miRNA and each column represents a sample. The miRNA clustering tree is shown on the left, and the sample clustering tree appears at the top. The color scale shown at the top illustrates the relative expression level of an miRNA in the certain slide: red color denotes a high relative expression level; green color denotes a low relative expression level. M3d, model group on day 3; C3d, control group on day 3; M7d, model group on day 7; C7d, control group on day 7; M14d, model group on day 14; C14d, control group on day 14.
Target prediction
The target genes for 36, 38 and 46 miRNAs were successfully predicted using the miRBase, miRanda and miRDB databases, respectively. Each miRNA had one or more predicted target genes. The overlapping section of the 3 databases contained target genes for 32 miRNAs (Table V).
Table V.
Target prediction: the overlapping of miRBase, miRanda and miRDB.
| miRNA_name | Gene symbol |
|---|---|
| rno-let-7b-5p | Adrb3, Apbb3, Ikbkap |
| rno-let-7f-5p | Adrb2, Adrb3, Apbb3, Ptafr |
| rno-miR-127-3p | Odf4, Sept7 |
| rno-miR-139-5p | Btg3, Fbxo9, Galnt3, Gclc, Gdf10, Gpr56, Nxph1, Sell, Serpini1, Slc25a3, Syn2, Tspan3, Ube2f |
| rno-miR-142-3p | Cask, Serinc1, Stx12, Tsen34 |
| rno-miR-154-5p | Aldh1a2, Cdca4, Chrm2, Cops2, Tmem35 |
| rno-miR-15b-5p | B4galt7, Btrc, Ccdc19, Cdc25a, Cops2, Glud1, Inhbc, Itpr1, Kcnc2, MGC114483, Mkks, Mlycd, Ppp1r11, Pth, RGD1308059, RGD1311739, Rnf10, Srpr, Usp14, Wbp11, Wee1, Wipi2 |
| rno-miR-182 | Adcy6, Anxa11, Arf4, Ccr5, Cd38, Cttn, Dazap2, Dnajb9, Gyg1, Il2rg, LOC500148, Lphn2, Pc, RGD1310861, Rnf44, Rtn4, Stk19, Tmem50b, Txnl1 |
| rno-miR-183-5p | Ap3m1, Btg1, Katna1, Ppp2cb, Ppp2r1a, Rcn2, Snx1, Spry2, Tmpo, Zfp451 |
| rno-miR-186-5p | Aldh6a1, Clcn3, Drg1, Dusp13, Eif4b, Fbxo30, Hhex, Irgm, LOC257650, Paqr3 Prkaa2, Psph, Sema4a, Serinc3, Sycp1, Tmco1, Ttc12, Xrcc4 |
| rno-miR-188-5p | Dcps, Pde4a, Psmc3ip, Ptprr, RGD1359108, Tmem30a, Tomm70a, Ube2i |
| rno-miR-190a-5p | Ambn, Ctbs, Epb4.1l5, Neurod1, Nlgn1, Stard3nl |
| rno-miR-208a-3p | Slc39a3, Srr |
| rno-miR-22-5p | Arhgef2, Ndrg2, Rdh11, Rgs1, Vrk1 |
| rno-miR-298-5p | Arhgdia, Arl3, Atp6v0e1, Btrc, Cd14, Eral1, Mustn1, Vdr |
| rno-miR-301a-3p | Arfip1, Cbfb, Clcn4-2, Dynll2, Enpp5, Esm1, Gadd45a, Il6st, Irf1, Laptm4a, Manba, Ndel1, Pparg, Rab30, RGD621098, Slfn8, Snx7, St18, St8sia3, Tdrd7, Wee1 |
| rno-miR-322-3p | Arhgap17, Cox8a, Dcun1d3, Dspp, Galnt11, Gpm6b, Lcp2, Ly49i6, Mycn, Ndufs1, Nit2 |
| rno-miR-33-5p | Cdc42bpa, Crot, Gria3, Hadhb, Hsd17b12, Kcns3, Lap3, Lum, Mdm4, Nr4a2, Slc39a8, St18, Tph2 |
| rno-miR-335 | Apeh, C4bpa, Chfr, Cln8, Cyp2u1, Il7, Klhl25, LOC499331, Ndfip1, Neu2, Nnt, Ikbkap, Rab11b |
| rno-miR-340-3p | Sept9 |
| rno-miR-34c-3p | Kif22, Lias, Sfrp4 |
| rno-miR-351-5p | Ahrr, Fcgr3a, Galnt14, Itga7, Prim2, RGD1359378, Rhot2, Slc35a4, Taz |
| rno-miR-365-3p | Adm, Arrb2, Crbn, Eltd1, Ing3, Pebp1, RGD1305235, Ublcp1 |
| rno-miR-378a-3p | Camlg, Kcna4, Sbds |
| rno-miR-382-5p | Dld, Eef1a1, Pkia, RGD1311863, Slc6a8, Smpx, Uqcrc2 |
| rno-miR-449a-5p | Capn8, Eno3, Fbxo30, Gmfb, Ldha, Mycn, Rai14, Stag3, Tmem109, Tmem22 |
| rno-miR-541-5p | Ly49i6, Rnd3 |
| rno-miR-674-3p | Emb, LOC500118, Lrrc4, Plcl1, Plp2, Slc12a2 |
| rno-miR-708-3p | Ctgf, Fmr1, Nedd9, Slfn8, Vim |
| rno-miR-872-5p | Azin1, Cntf, Sqstm1 |
| rno-miR-92a-3p | Adcy3, Adm, Ccnh, Cd69, Col1a2, Dkk3, Dnajc4, Fmr1, Gata2, Gria3, Ibsp, Klf4, Nelf, Pigv, Ptpro, RGD1308059, Ugp2, Wrnip1 |
| rno-miR-96-5p | Btg4, Klhl7, MGC105560, Morf4l2, Ppp3r1, RGD1310794, ST7 |
Discussion
BPD is a common respiratory disease affecting premature infants. In recent years, due to the increasing rescue success rates for very low birth weight and extremely low birth weight infants, as well as the wide application of pulmonary surfactants, extremely premature infants with a gestational age lower than 28 weeks have become the major group experiencing BPD. These infants were born towards the end of the canalicular stage or at the saccular stage of lung development; therefore, the entire alveolarization and microvascularization process occurred postnatally. This is different from the 'old BPD', as suggested by Northway et al (23), which mainly manifested with 'acute lung injury, pneumonedema, extensive airway epithelial metaplasia, pulmonary fibrosis, and airway and vascular smooth muscle hyperplasia'. The 'new BPD', in these extremely premature infants is characterized by 'alveolar hypoplasia and impaired pulmonary vascular development' (1).
In the present study, we found that the RAC value in the BPD model group was markedly decreased by postnatal day 7 (P<0.05) as compared with the control group, and that the difference between the 2 groups was even greater by day 14 (P<0.01). This indicated that the formation of secondary septa was impaired and that alveolarization was suppressed in the model of BPD. The results from western blot analysis and RT-qPCR for PCNA expression revealed that the expression levels in the model group were lower than those in the control group by postnatal day 3, and this difference persisted and reached a peak by day 14. This suggests that cell proliferation may be suppressed in BPD. Similarly, CD31 expression was lower in the model group than in the control group at all time points, indicating that vascular development may be suppressed in the model group.
The role of miRNAs in BPD has been previously investigated using microarray assays (21,24,25), and the results were partially consistent with ours. For example, Bhaskaran et al (24) and Zhang et al (21) found that the expression level of miR-335 was downregulated, and Zhang et al also observed the upregulation of miR-449a and let-7f expression. There are few studies available which have investigated the association between miRNAs and BPD. Bhaskaran et al (24) confirmed that one of the miR-150 targets was glycoprotein nonmetastatic melanoma protein b (GPNMB), which may participate in the regulation of angiogenesis. Narasaraju et al (26) further confirmed the regulatory role of miR-150 in angiogenesis in BPD. Dong et al (25) found that miR-29 expression was upregulated in BPD and suggested that miR-29 may suppress lung development by inhibiting Ntrk2. However, we failed to detect these 2 miRNAs, possibly due to the different animal species and modeling method used. Most of the other miRNAs that had expression changes have not been previously reported in studies of BPD to the best of our knowledge.
In rats, alveolarization occurs mainly during postnatal days 5–14. By postnatal day 3, alveolarization has not yet begun, so we observed only a few differentially expressed miRNAs between the 2 groups. To date, downregulated miR-377-3p and upregulated miR-1193-3p have not been reported, to the best of our knowledge. Gu et al found that the overexpression of miR-490-3p in the A549 cell line had an effect on the targeted downregulation of CCND1 expression. As CCND1 plays an important role in the G1/S transition, the cell cycle was arrested in the G1 phase, and thus, cell proliferation was suppressed (27).
In our study, alveolarization reached a peak 7 days after birth when the difference in miRNA expression between the 2 groups was significant. The upregulation of miR-3584-3p has not yet been reported to the best of our knowledge. The expression of the following miRNAs was downregulated: miR-542-5p, miR-99a-3p, miR-139-5p, miR-208a-3p, miR-33-5p, miR-190a-5p, miR-335, miR-708-3p, miR-15b-5p, miR-674-3p and miR-188-5p. Bray et al (28) found that miR-542-5p had a tumor inhibitory effect on neuroblastoma. In colorectal cancer, esophageal cancer and breast cancer, the mechanisms of action of miR-139-5p as a tumor inhibitory factor have also been reported (29–32). Wang et al (33) observed the downregulated expression of miR-335 in NSCLC tissues and an increased apoptotic rate in the miR-335-transfected cell line. In the same study, miR-355 was shown to suppress the invasive ability of tumor cells through the targeted regulation of Bcl-w and SP1. Other downregulated miRNAs have not yet been reported to the best of our knowledge.
By postnatal day 14, alveolarization was almost complete, and the manifestations of BPD were also observed in the lung tissues of the model group. In addition, differences in the miRNA expression levels between the 2 groups were increasingly apparent. Now, it is widely recognized that the pulmonary microvascularization stage begins on postnatal day 14, during which the double layers of the microvascular network in the normal secondary septa will fuse into one layer. Therefore, differentially expressed miRNAs on day 14 may also be associated with the failure of microvascularization caused by the absence of secondary septa in the BPD model group. Jiang et al found that downregulated miR-127-3p inhibited the proliferation of tumor cells in malignant glioma by suppressing SKI and activating the TGF-β signaling pathway, and promoted metastasis through the targeted inhibition of SEPT7 (34,35). Zha et al found that miR-134-3p inhibited tumor metastasis in hepatocellular carcinoma through the targeted regulation of ITGB1 (36). The decreased expression of miR-378a-3p in colorectal cancer has been shown to increase the phosphorylated ERK1/2 protein level (37), and the downregulated expression of miR-378a-3p is also present in rhabdomyosarcoma (38). Both these studies suggest that miR-378a-3p suppresses tumor growth by inhibiting the expression of the target gene, IGF1R. Of the upregulated miRNAs, miR-34c-3p caused the arrest of glioma cells in the S phase, reduced the number of cells in the G0/G1 phase, and induced cell apoptosis (39). miR-34c-3p caused SiHa cells to arrest in the S phase and to undergo apoptosis, and inhibited metastasis and invasion in cervical cancer (40). Similarly, let-7b-5p inhibited the proliferation of multiple myeloma cells through the targeted regulation of IGF1R and promoted cell cycle arrest and apoptosis (41). Zhu et al (42) found that hsa-miR-182 was highly expressed in pulmonary adenocarcinoma, which led to the inhibition of cell proliferation through the downregulation of RASA1. Stenvold et al (43) found that the expression of miR-182 was well correlated with FGF2, HIF2α and MMP-7 in NSCLC, indicating its possible role in angiogenesis. Patients with squamous cell carcinoma (SCC) and stage II patients, expressing high levels of miR-182 had a better prognosis. Yang et al (44) observed the role of miR-182 in the targeted regulation of FOXO3 and found that in early-stage lung cancer, Sp1 stimulated miR-182 expression and led to the downregulated expression of FOXO3, thus allowing tumor growth. In advanced lung cancer, Sp1 and miR-182 were both downregulated, while FOXO3 expression was upregulated, leading to lung cancer metastasis. Wang et al (45) found that PDCD4 was also one of the target genes for miR-182. miR-182 was upregulated in the lung cancer cell lines, A549 and SPC-A-1, which resulted in a decrease in PDCD4 expression, thus weakening the inhibitory effect of PDCD4 on tumor growth. Zhang et al (46) observed that miR-182 inhibited tumor cell proliferation and promoted tumor cell apoptosis through the targeted regulation of the cortactin (CTTN) gene. In the miR-182-transfected A549 cell line, most cells were arrested in G0/G1 phase, and the percentages of cells in the S and G2/M phase were greatly decreased. Sun et al (47) found that RGS17 was a target gene of miR-182 and that the overexpression of transfected miR-182 inhibited RGS17 mRNA transcription and thus, suppressed tumor cell proliferation, leading to the recurrence of cell adherence. Lei et al (48) observed that the high expression of TGF-β1 in NSCLC upregulated miR-142-3p expression, and the latter targeted TGF-βR1, thus inhibiting its expression, weakening SMAD3 phosphorylation, and promoting tumor growth. Carraro et al (49) found that miR-142-3p kept the balance between the proliferation and differentiation of mesenchymal cells during lung development. miR-142 participated in the regulation of the Wnt-CTNNB1 pathway (Apc binds to CTNNB1 to induce its ubiquitination and degradation) by binding to Apc mRNA, and its downregulation promoted the differentiation of parabronchial smooth muscle ancestral cells. In colorectal cancer cells, miR-96-5p decreased cyclin D1 expression but increasesd p27-CDKN1A expression through the targeted regulation of KRAS, thus slowing cell growth (50). miR-96-5p regulated GPC1 to inhibit the proliferation of pancreatic cancer cells (51). Other miRNAs have not yet been reported to the best of our knowledge.
During septation, compared with the control group on day 3 (C3d), 27 miRNAs were upregulated, and 20 were downregulated in the control group on day 14 (C14d); compared with the model group on day 3 (M3d), 19 miRNAs were upregulated, while 26 were downregulated in the model group on day14 (M14d) (Table IV). Several miRNAs were shared by the model and control groups, including highly upregulated miR-143-5p and miR-222-3p and markedly downregulated miR-542-5p and miR-503-5p. These data demonstrated similarities between septation in the 2 groups during, suggesting that these miRNAs play an important role during septation, despite the cause of the injury related to hyperoxia.
Three online databases were used to predict the target genes of 32 differentially expressed miRNAs, according to the base sequence complementation principle, and some miRNAs even helped to predict several target genes (Table V). However, the prediction results were not able to indicate the actual presence of these targeted regulations in vivo. Regarding the regulation of miRNA in other diseases, the target genes of some miRNAs have been confirmed experimentally, for example, Sept7 is the target gene of miR-127-3p (40), while CTTN is the target gene of rno-miR-182 (51). Some target genes that were confirmed in previous studies were not found in our results, possibly because we only selected the intersection set of results from three databases, so some target molecules may have been missed. In the future, we may construct luciferase reporter vectors for the miRNA of interest to further validate the targeted relationships between miRNA and the predicted genes.
In conclusion, the majority of the miRNAs we found still play an unknown role in the development of BPD, and some of them have not been previously reported to the best of our knowledge. Currently available data also revealed that the regulation of miRNA is complex regarding life processes. Further study is necessary to understand the effects of miRNA in the development of BPD.
In this study, we screened possible miRNAs that participated in the development of BPD during the alveolar septation phase using microarray assays and identified the important role of miRNAs in the development of normal lungs and BPD. In the future, we aim to further investigate the functions of these miRNAs, in order to broaden our understanding of the pathogenesis of BPD.
Acknowledgments
This study was supported by grant from the Natural Science Foundation of China (no. 81471489).
References
- 1.Hilgendorff A, Reiss I, Ehrhardt H, Eickelberg O, Alvira CM. Chronic lung disease in the preterm infant. Lessons learned from animal models. Am J Respir Cell Mol Biol. 2014;50:233–245. doi: 10.1165/rcmb.2013-0014TR. [DOI] [PMC free article] [PubMed] [Google Scholar]
- 2.Bhandari A, Bhandari V. Pitfalls, problems, and progress in bronchopulmonary dysplasia. Pediatrics. 2009;123:1562–1573. doi: 10.1542/peds.2008-1962. [DOI] [PubMed] [Google Scholar]
- 3.Bhandari A, McGrath-Morrow S. Long-term pulmonary outcomes of patients with bronchopulmonary dysplasia. Semin Perinatol. 2013;37:132–137. doi: 10.1053/j.semperi.2013.01.010. [DOI] [PubMed] [Google Scholar]
- 4.Anderson PJ, Doyle LW. Neurodevelopmental outcome of bronchopulmonary dysplasia. Semin Perinatol. 2006;30:227–232. doi: 10.1053/j.semperi.2006.05.010. [DOI] [PubMed] [Google Scholar]
- 5.Herriges M, Morrisey EE. Lung development: orchestrating the generation and regeneration of a complex organ. Development. 2014;141:502–513. doi: 10.1242/dev.098186. [DOI] [PMC free article] [PubMed] [Google Scholar]
- 6.Warburton D, El-Hashash A, Carraro G, Tiozzo C, Sala F, Rogers O, De Langhe S, Kemp PJ, Riccardi D, Torday J, et al. Lung organogenesis. Curr Top Dev Biol. 2010;90:73–158. doi: 10.1016/S0070-2153(10)90003-3. [DOI] [PMC free article] [PubMed] [Google Scholar]
- 7.Hadchouel A, Franco-Montoya ML, Delacourt C. Altered lung development in bronchopulmonary dysplasia. Birth Defects Res A Clin Mol Teratol. 2014;100:158–167. doi: 10.1002/bdra.23237. [DOI] [PubMed] [Google Scholar]
- 8.Madurga A, Mizíková I, Ruiz-Camp J, Morty RE. Recent advances in late lung development and the pathogenesis of bronchopulmonary dysplasia. Am J Physiol Lung Cell Mol Physiol. 2013;305:L893–L905. doi: 10.1152/ajplung.00267.2013. [DOI] [PubMed] [Google Scholar]
- 9.Du T, Zamore PD. microPrimer: the biogenesis and function of microRNA. Development. 2005;132:4645–4652. doi: 10.1242/dev.02070. [DOI] [PubMed] [Google Scholar]
- 10.Ambros V. The functions of animal microRNAs. Nature. 2004;431:350–355. doi: 10.1038/nature02871. [DOI] [PubMed] [Google Scholar]
- 11.Bartel DP. MicroRNAs: genomics, biogenesis, mechanism, and function. Cell. 2004;116:281–297. doi: 10.1016/S0092-8674(04)00045-5. [DOI] [PubMed] [Google Scholar]
- 12.Dong J, Jiang G, Asmann YW, Tomaszek S, Jen J, Kislinger T, Wigle DA. MicroRNA networks in mouse lung organogenesis. PLoS One. 2010;5:e10854. doi: 10.1371/journal.pone.0010854. [DOI] [PMC free article] [PubMed] [Google Scholar]
- 13.Tay HL, Plank M, Collison A, Mattes J, Kumar RK, Foster PS. MicroRNA: potential biomarkers and therapeutic targets for allergic asthma? Ann Med. 2014;46:633–639. doi: 10.3109/07853890.2014.958196. [DOI] [PubMed] [Google Scholar]
- 14.Lino Cardenas CL, Kaminski N, Kass DJ. Micromanaging microRNAs: using murine models to study microRNAs in lung fibrosis. Drug Discov Today Dis Models. 2013;10:e145–e151. doi: 10.1016/j.ddmod.2012.11.003. [DOI] [PMC free article] [PubMed] [Google Scholar]
- 15.Joshi P, Middleton J, Jeon YJ, Garofalo M. MicroRNAs in lung cancer. World J Methodol. 2014;4:59–72. doi: 10.5662/wjm.v4.i2.59. [DOI] [PMC free article] [PubMed] [Google Scholar]
- 16.Lu Y, Thomson JM, Wong HY, Hammond SM, Hogan BL. Transgenic overexpression of the microRNA miR-17-92 cluster promotes proliferation and inhibits differentiation of lung epithelial progenitor cells. Dev Biol. 2007;310:442–453. doi: 10.1016/j.ydbio.2007.08.007. [DOI] [PMC free article] [PubMed] [Google Scholar]
- 17.Ventura A, Young AG, Winslow MM, Lintault L, Meissner A, Erkeland SJ, Newman J, Bronson RT, Crowley D, Stone JR, et al. Targeted deletion reveals essential and overlapping functions of the miR-17 through 92 family of miRNA clusters. Cell. 2008;132:875–886. doi: 10.1016/j.cell.2008.02.019. [DOI] [PMC free article] [PubMed] [Google Scholar]
- 18.Carraro G, El-Hashash A, Guidolin D, Tiozzo C, Turcatel G, Young BM, De Langhe SP, Bellusci S, Shi W, Parnigotto PP, Warburton D. miR-17 family of microRNAs controls FGF10-mediated embryonic lung epithelial branching morphogenesis through MAPK14 and STAT3 regulation of E-Cadherin distribution. Dev Biol. 2009;333:238–250. doi: 10.1016/j.ydbio.2009.06.020. [DOI] [PMC free article] [PubMed] [Google Scholar]
- 19.Navarro A, Marrades RM, Viñolas N, Quera A, Agustí C, Huerta A, Ramirez J, Torres A, Monzo M. MicroRNAs expressed during lung cancer development are expressed in human pseudoglandular lung embryogenesis. Oncology. 2009;76:162–169. doi: 10.1159/000201569. [DOI] [PubMed] [Google Scholar]
- 20.Bhaskaran M, Wang Y, Zhang H, Weng T, Baviskar P, Guo Y, Gou D, Liu L. MicroRNA-127 modulates fetal lung development. Physiol Genomics. 2009;37:268–278. doi: 10.1152/physiolgenomics.90268.2008. [DOI] [PMC free article] [PubMed] [Google Scholar]
- 21.Zhang X, Peng W, Zhang S, Wang C, He X, Zhang Z, Zhu L, Wang Y, Feng Z. MicroRNA expression profile in hyperoxia-exposed newborn mice during the development of bronchopulmonary dysplasia. Respir Care. 2011;56:1009–1015. doi: 10.4187/respcare.01032. [DOI] [PubMed] [Google Scholar]
- 22.Yang H, Fu J, Xue X, Yao L, Qiao L, Hou A, Jin L, Xing Y. Epithelial-mesenchymal transitions in bronchopulmonary dysplasia of newborn rats. Pediatr Pulmonol. 2014;49:1112–1123. doi: 10.1002/ppul.22969. [DOI] [PubMed] [Google Scholar]
- 23.Northway WH, Jr, Rosan RC, Porter DY. Pulmonary disease following respirator therapy of hyaline-membrane disease. Bronchopulmonary dysplasia. N Engl J Med. 1967;276:357–368. doi: 10.1056/NEJM196702162760701. [DOI] [PubMed] [Google Scholar]
- 24.Bhaskaran M, Xi D, Wang Y, Huang C, Narasaraju T, Shu W, Zhao C, Xiao X, More S, Breshears M, Liu L. Identification of microRNAs changed in the neonatal lungs in response to hyperoxia exposure. Physiol Genomics. 2012;44:970–980. doi: 10.1152/physiolgenomics.00145.2011. [DOI] [PMC free article] [PubMed] [Google Scholar]
- 25.Dong J, Carey WA, Abel S, Collura C, Jiang G, Tomaszek S, Sutor S, Roden AC, Asmann YW, Prakash YS, Wigle DA. MicroRNA-mRNA interactions in a murine model of hyperoxia-induced bronchopulmonary dysplasia. BMC Genomics. 2012;13:204. doi: 10.1186/1471-2164-13-204. [DOI] [PMC free article] [PubMed] [Google Scholar]
- 26.Narasaraju T, Shukla D, More S, Huang C, Zhang L, Xiao X, Liu L. Role of microRNA-150 and glycoprotein nonmetastatic melanoma protein B in angiogenesis during hyperoxia-induced neonatal lung injury. Am J Respir Cell Mol Biol. 2015;52:253–261. doi: 10.1165/rcmb.2013-0021OC. [DOI] [PMC free article] [PubMed] [Google Scholar]
- 27.Gu H, Yang T, Fu S, Chen X, Guo L, Ni Y. MicroRNA-490-3p inhibits proliferation of A549 lung cancer cells by targeting CCND1. Biochem Biophys Res Commun. 2014;444:104–108. doi: 10.1016/j.bbrc.2014.01.020. [DOI] [PubMed] [Google Scholar]
- 28.Bray I, Tivnan A, Bryan K, Foley NH, Watters KM, Tracey L, Davidoff AM, Stallings RL. MicroRNA-542-5p as a novel tumor suppressor in neuroblastoma. Cancer Lett. 2011;303:56–64. doi: 10.1016/j.canlet.2011.01.016. [DOI] [PMC free article] [PubMed] [Google Scholar]
- 29.Song M, Yin Y, Zhang J, Zhang B, Bian Z, Quan C, Zhou L, Hu Y, Wang Q, Ni S, et al. MiR-139-5p inhibits migration and invasion of colorectal cancer by downregulating AMFR and NOTCH1. Protein Cell. 2014;5:851–861. doi: 10.1007/s13238-014-0093-5. [DOI] [PMC free article] [PubMed] [Google Scholar]
- 30.Shen K, Mao R, Ma L, Li Y, Qiu Y, Cui D, Le V, Yin P, Ni L, Liu J. Post-transcriptional regulation of the tumor suppressor miR-139-5p and a network of miR-139-5p-mediated mRNA interactions in colorectal cancer. FEBS J. 2014;281:3609–3624. doi: 10.1111/febs.12880. [DOI] [PubMed] [Google Scholar]
- 31.Liu R, Yang M, Meng Y, Liao J, Sheng J, Pu Y, Yin L, Kim SJ. Tumor-suppressive function of miR-139-5p in esophageal squamous cell carcinoma. PLoS One. 2013;8:e77068. doi: 10.1371/journal.pone.0077068. [DOI] [PMC free article] [PubMed] [Google Scholar]
- 32.Krishnan K, Steptoe AL, Martin HC, Pattabiraman DR, Nones K, Waddell N, Mariasegaram M, Simpson PT, Lakhani SR, Vlassov A, et al. miR-139-5p is a regulator of metastatic pathways in breast cancer. RNA. 2013;19:1767–1780. doi: 10.1261/rna.042143.113. [DOI] [PMC free article] [PubMed] [Google Scholar]
- 33.Wang H, Li M, Zhang R, Wang Y, Zang W, Ma Y, Zhao G, Zhang G. Effect of miR-335 upregulation on the apoptosis and invasion of lung cancer cell A549 and H1299. Tumour Biol. 2013;34:3101–3109. doi: 10.1007/s13277-013-0878-9. [DOI] [PubMed] [Google Scholar]
- 34.Jiang H, Hua D, Zhang J, Lan Q, Huang Q, Yoon JG, Han X, Li L, Foltz G, Zheng S, Lin B. MicroRNA-127-3p promotes glioblastoma cell migration and invasion by targeting the tumor-suppressor gene SEPT7. Oncol Rep. 2014;31:2261–2269. doi: 10.3892/or.2014.3055. [DOI] [PubMed] [Google Scholar]
- 35.Jiang H, Jin C, Liu J, Hua D, Zhou F, Lou X, Zhao N, Lan Q, Huang Q, Yoon JG, et al. Next generation sequencing analysis of miRNAs: MiR-127-3p inhibits glioblastoma proliferation and activates TGF-beta signaling by targeting SKI. OMICS. 2014;18:196–206. doi: 10.1089/omi.2013.0122. [DOI] [PMC free article] [PubMed] [Google Scholar]
- 36.Zha R, Guo W, Zhang Z, Qiu Z, Wang Q, Ding J, Huang S, Chen T, Gu J, Yao M, He X. Genome-wide screening identified that miR-134 acts as a metastasis suppressor by targeting integrin β1 in hepatocellular carcinoma. PLoS One. 2014;9:e87665. doi: 10.1371/journal.pone.0087665. [DOI] [PMC free article] [PubMed] [Google Scholar]
- 37.Li H, Dai S, Zhen T, Shi H, Zhang F, Yang Y, Kang L, Liang Y, Han A. Clinical and biological significance of miR-378a-3p and miR-378a-5p in colorectal cancer. Eur J Cancer. 2014;50:1207–1221. doi: 10.1016/j.ejca.2013.12.010. [DOI] [PubMed] [Google Scholar]
- 38.Megiorni F, Cialfi S, McDowell HP, Felsani A, Camero S, Guffanti A, Pizer B, Clerico A, De Grazia A, Pizzuti A, et al. Deep Sequencing the microRNA profile in rhabdomyosarcoma reveals downregulation of miR-378 family members. BMC Cancer. 2014;14:880. doi: 10.1186/1471-2407-14-880. [DOI] [PMC free article] [PubMed] [Google Scholar]
- 39.Wu Z, Wu Y, Tian Y, Sun X, Liu J, Ren H, Liang C, Song L, Hu H, Wang L, Jiao B. Differential effects of miR-34c-3p and miR-34c-5p on the proliferation, apoptosis and invasion of glioma cells. Oncol Lett. 2013;6:1447–1452. doi: 10.3892/ol.2013.1579. [DOI] [PMC free article] [PubMed] [Google Scholar]
- 40.López JA, Alvarez-Salas LM. Differential effects of miR-34c-3p and miR-34c-5p on SiHa cells proliferation apoptosis, migration and invasion. Biochem Biophys Res Commun. 2011;409:513–519. doi: 10.1016/j.bbrc.2011.05.036. [DOI] [PubMed] [Google Scholar]
- 41.Xu H, Liu C, Zhang Y, Guo X, Liu Z, Luo Z, Chang Y, Liu S, Sun Z, Wang X. Let-7b-5p regulates proliferation and apoptosis in multiple myeloma by targeting IGF1R. Acta Biochim Biophys Sin (Shanghai) 2014;46:965–972. doi: 10.1093/abbs/gmu089. [DOI] [PubMed] [Google Scholar]
- 42.Zhu YJ, Xu B, Xia W. Hsa-miR-182 downregulates RASA1 and suppresses lung squamous cell carcinoma cell proliferation. Clin Lab. 2014;60:155–159. doi: 10.7754/clin.lab.2013.121131. [DOI] [PubMed] [Google Scholar]
- 43.Stenvold H, Donnem T, Andersen S, Al-Saad S, Busund LT, Bremnes RM. Stage and tissue-specific prognostic impact of miR-182 in NSCLC. BMC Cancer. 2014;14:138. doi: 10.1186/1471-2407-14-138. [DOI] [PMC free article] [PubMed] [Google Scholar]
- 44.Yang WB, Chen PH, Hsu T, Fu TF, Su WC, Liaw H, Chang WC, Hung JJ. Sp1-mediated microRNA-182 expression regulates lung cancer progression. Oncotarget. 2014;5:740–753. doi: 10.18632/oncotarget.1608. [DOI] [PMC free article] [PubMed] [Google Scholar]
- 45.Wang M1, Wang Y, Zang W, Wang H, Chu H, Li P, Li M, Zhang G, Zhao G. Downregulation of microRNA-182 inhibits cell growth and invasion by targeting programmed cell death 4 in human lung adenocarcinoma cells. Tumour Biol. 2014;35:39–46. doi: 10.1007/s13277-013-1004-8. [DOI] [PubMed] [Google Scholar]
- 46.Zhang L, Liu T, Huang Y, Liu J. microRNA-182 inhibits the proliferation and invasion of human lung adenocarcinoma cells through its effect on human cortical actin-associated protein. Int J Mol Med. 2011;28:381–388. doi: 10.3892/ijmm.2011.679. [DOI] [PubMed] [Google Scholar]
- 47.Sun Y, Fang R, Li C, Li L, Li F, Ye X, Chen H. Hsa-miR-182 suppresses lung tumorigenesis through downregulation of RGS17 expression in vitro. Biochem Biophys Res Commun. 2010;396:501–507. doi: 10.1016/j.bbrc.2010.04.127. [DOI] [PubMed] [Google Scholar]
- 48.Lei Z, Xu G, Wang L, Yang H, Liu X, Zhao J, Zhang HT. MiR-142-3p represses TGF-beta-induced growth inhibition through repression of TGFbetaR1 in non-small cell lung cancer. FASEB J. 2014;28:2696–2704. doi: 10.1096/fj.13-247288. [DOI] [PubMed] [Google Scholar]
- 49.Carraro G, Shrestha A, Rostkovius J, Contreras A, Chao CM, El Agha E, Mackenzie B, Dilai S, Guidolin D, Taketo MM, et al. miR-142-3p balances proliferation and differentiation of mesenchymal cells during lung development. Development. 2014;141:1272–1281. doi: 10.1242/dev.105908. [DOI] [PMC free article] [PubMed] [Google Scholar]
- 50.Ress AL, Stiegelbauer V, Winter E, Schwarzenbacher D, Kiesslich T, Lax S, Jahn S, Deutsch A, Bauernhofer T, Ling H, et al. MiR-96-5p influences cellular growth and is associated with poor survival in colorectal cancer patients. Mol Carcinog. 2014 Sep 25; doi: 10.1002/mc.22218. Epub ahead of print. [DOI] [PubMed] [Google Scholar]
- 51.Li C, Du X, Tai S, Zhong X, Wang Z, Hu Z, Zhang L, Kang P, Ji D, Jiang X, et al. GPC1 regulated by miR-96-5p, rather than miR-182-5p, in inhibition of pancreatic carcinoma cell proliferation. Int J Mol Sci. 2014;15:6314–6327. doi: 10.3390/ijms15046314. [DOI] [PMC free article] [PubMed] [Google Scholar]