Abstract
Modern pre-clinical radiation therapy (RT) research requires high precision and accurate dosimetry to facilitate the translation of research findings into clinical practice. Several systems are available that provide precise delivery and on-board imaging capabilities, highlighting the need for a quality management program (QMP) to ensure consistent and accurate radiation dose delivery. An ongoing, simple, and efficient QMP for image-guided robotic small animal irradiators used in pre-clinical RT research is described. Protocols were developed and implemented to assess the dose output constancy (based on the AAPM TG-61 protocol), cone-beam computed tomography (CBCT) image quality and object representation accuracy (using a custom-designed imaging phantom), CBCT-guided target localization accuracy and consistency of the CBCT-based dose calculation. To facilitate an efficient read-out and limit the user dependence of the QMP data analysis, a semi-automatic image analysis and data representation program was developed using the technical computing software MATLAB. The results of the first six months experience using the suggested QMP for a Small Animal Radiation Research Platform (SARRP) are presented, with data collected on a bi-monthly basis. The dosimetric output constancy was established to be within ±1 %, the consistency of the image resolution was within ±0.2 mm, the accuracy of CBCT-guided target localization was within ±0.5 mm, and dose calculation consistency was within ±2 s (± 3 %) per treatment beam. Based on these results, this simple quality assurance program allows for the detection of inconsistencies in dosimetric or imaging parameters that are beyond the acceptable variability for a reliable and accurate pre-clinical RT system, on a monthly or bi-monthly basis.
Keywords: Radiation therapy, Small animal irradiator, Quality assurance, Image-guidance
INTRODUCTION
Technical advances in pre-clinical radiation therapy (RT) during the last few years have provided several platforms for precise and accurate delivery of high-dose external beam radiation to small animals. (Matinfar et al. 2008, Wong et al. 2008, Clarkson et al. 2011, Verhaegen et al. 2011, Bazalova et al. 2014) At the same time, the advances in pre-clinical radiation biology are at a point where accurate dosimetry and dose delivery is paramount in order to conduct meaningful radiobiological investigations. (Williams et al. 2010) This in turn leads to an increased demand for quality assurance (QA) of small animal irradiators, making sure that the correct dose is delivered to precisely the right location within the animal.
The Small Animal Radiation Research Platform (SARRP, XStrahl, Surray, UK) was developed at Johns Hopkins University (Baltimore, MD, USA) and consists of a gantry-mounted x-ray tube capable of delivering up to 220 kV x-rays either as an open field or using high-precision removable collimators. (Matinfar et al. 2008, Wong et al. 2008, Tryggestad et al. 2009) The standard collimator set consists of a 10 mm × 10 mm collimator, a 9 mm × 3 mm collimator, a 5 mm × 5 mm collimator, a 3 mm × 3 mm collimator, and circular collimators with 1 mm or 0.5 mm diameter. The SARRP is equipped with an amorphous Silicon flat panel detector providing on-board cone-beam computed tomography (CBCT) imaging and a revolving robotic couch providing four degrees of freedom for beam/target alignments. The image-guided target localization and treatment planning capability of the SARRP is an example of a system that allows precise and accurate radiation delivery for pre-clinical experiments. However, to ensure the correct utilization of these tools requires accurate and consistent radiation dose output, geometric positioning accuracy, geometric object representation, general image quality and the correct alignment of imaging and radiation isocenters. Some comprehensive protocols have been published to ensure accurate commissioning and dosimetric characterization as well as calibration of the beam alignment.(Matinfar et al. 2009, Rodriguez et al. 2009, Tryggestad et al. 2009, Pidikiti et al. 2011, Lindsay et al. 2014) These procedures, although comprehensive, are quite time consuming and are more appropriate for machine commissioning and annual system checks, rather than ongoing monthly or weekly QA. A recent paper presented an elegant solution for everyday QA measures using a mouse-sized metal oxide semiconductor field effect transistor (MOSFET) phantom capable of measuring daily output consistency, beam energy, cone profiles and some simple image quality measures such as noise and uniformity, although no assessment for materials of varying x-ray density was included.(Ngwa et al. 2012)
A QA strategy was developed for testing the month-to-month stability of the SARRP with respect to radiation dose output, CBCT imaging for objects of different x-ray density, consistency in image resolution and object representation, isocenter alignment and dose calculation using the treatment planning system. Results are presented for the first six months of applying these QA procedures on the SARRP. While the results are specific to the SARRP, the tests and the implemented methodologies are not dependent on this specific platform, and therefore can be applied for the quality assurance of any robotically controlled small animal irradiation system that uses CT or CBCT for image guidance.
MATERIALS AND METHODS
Dosimetric output constancy
To estimate the dosimetric output consistency for the SARRP at the Institute for Onco-Physics at Albert Einstein College of Medicine (AECOM) a dosimetry formalism based on the recommendations in the TG-61 protocol for 40-300 kV x-ray beam dosimetry was set up. (Ma et al. 2001) First, the dose output was measured in water for an open field geometry according to the TG-61 protocol using an Exradin A12 farmer type ion chamber (Standard Imaging, Inc., Middleton, WI, USA). Following this a pressure and temperature corrected charge measurement in air was obtained for the same open field geometry using an Exradin P11 parallel plate chamber (Standard Imaging, Inc., Middleton, WI, USA) with an active detector volume of 0.62 cm3. Using this temperature and pressure corrected charge measurement and the previously measured dose to water at 2 cm depth, a conversion factor was derived that allowed the conversion of charge measured in air with a parallel plate chamber to absorbed dose in water at 2 cm depth. This reading was then corrected to the dose at dmax (2 mm at 220 kVp) using a measured open field percentage depth dose curve. These measurements include accounting for correction factors related to polarity correction, ion recombination and electrometer calibration (all obtained following SARRP installation and commissioning).
So for each QA session output constancy was measured using the parallel plate chamber in air (placed on a thin carbon fiber table top) at a source-axis-distance of 35 cm, setup in open field geometry (20 × 20 cm2 at 35 cm), i.e. with no collimators attached (Fig. 1).
Figure 1.
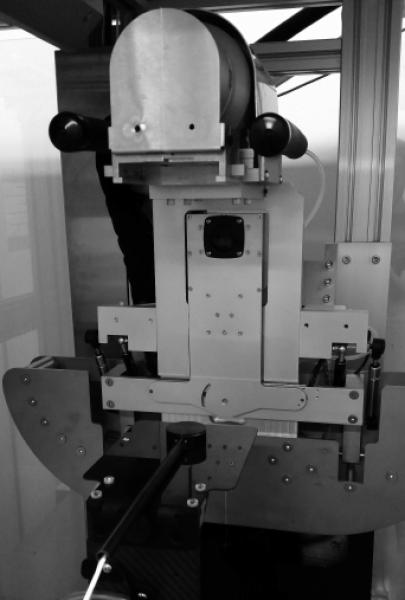
Parallel plate chamber placed on a carbon fiber table for the free-in-air measurement setup. The chamber is placed with the active detector area at isocenter distance using the horizontal and vertical setup lasers, with the gantry at 0° angle.
A minimum of three 60 s measurements were taken at each output consistency check using a 0.15 mm Copper beam filter, 220 kVp beam energy and 13 mA tube current, which represent the standard and recommended tube parameters for small animal irradiation when using the SARRP. The average measured ionization charge, corrected for temperature and air pressure at the time of measurement, was then used to compute the dose rate to water at dmax.
Consistency of image quality and object representation
Small animal imaging phantom
To measure the image quality consistency relevant to pre-clinical RT a small animal cylindrical imaging phantom was designed, manufactured from high-density polyethylene, with density 0.97 g/cm3, which is close to that of soft tissue. As illustrated in Fig. 2, one end of the phantom was designed to contain three 1/4 inch cavities of different density materials to check the consistency of CBCT images over different intensities. The other end was designed to contain air cavities of different diameters to check the consistency of image resolution and object size representation.
Figure 2.
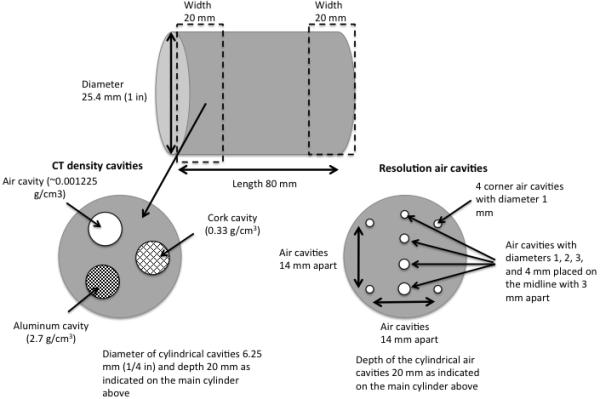
Detailed design of the high-density polyethylene small animal imaging phantom including all dimensions and materials.
Imaging procedure
The SARRP at AECOM is equipped with a 512 × 512 pixel amorphous Silicon detector panel for CBCT imaging providing a voxel resolution of 0.275 × 0.275 × 0.275 mm3 with the current reconstruction protocol. For imaging a 1 mm Al filter was used and the recommended pre-clinical imaging parameters (50 kV beam energy and 0.7 mA tube current) with the gantry set at 90° facing the imager while the treatment couch rotates 360° in the orthogonal plane during image acquisition. A detector calibration was performed before each imaging QA procedure and the imaging phantom was then CBCT scanned, after first scanning a water reference, to help determine the consistency in image intensity.
Due to the differences in image acquisition, Hounsfield units (HU) from a CBCT scan will differ from those resulting from a helical CT scan.(Mah et al. 2010) To obtain CBCT HU for the different materials in the imaging phantom the pixel intensities were normalized to the intensity of the water reference, included with each CBCT scan, according to:
| (1) |
where Ij is the pixel intensity in the jth pixel and Iwater is the averaged pixel intensity obtained from a region of interest (ROI) in the water reference.
Semi-automatic analysis of image quality parameters
The analyses were all performed using the technical computing software MATLAB (The MathWorks, Inc., Natick, MA) using a semi-automatic image quality and object representation program developed in-house (sample MATLAB code can be provided by the authors upon request), analyzing the following parameters:
CBCT HU of water reference and polyethylene ROIs, as well as those of the air, cork and aluminum cavities (averaged over the five closest CBCT slices), computed by drawing circular ROIs in the middle of each material cavity
The diameter of the resolution air cavities with increasing diameter, obtained by drawing line profiles across the cavities, both in a transversal and in a sagittal CBCT slice
The diameter of the 1 mm corner air cavities in a transverse slice, obtained by horizontal and vertical line profiles to test the consistency of image resolution in both planes
The distance between resolution air cavities, obtained from a vertical line profile drawn through all cavities
The diameter and length of the entire imaging phantom, obtained from line profiles drawn on a sagittal slice
All line profiles were drawn in the resolution part of the phantom, sufficiently far from the aluminum cavity to not be affected by the photon starvation surrounding this high-density material. For the resolution consistency measures these diameters and distances between air cavities were automatically computed using a cutoff HU value to classify pixels as belonging to either air cavities or the surrounding polyethylene material. Since the HU of the polyethylene material near an air cavity will be different from that in an area with homogeneous polyethylene material, and the HU throughout an air cavity are different from that of air outside the phantom, an empirical cutoff value was used to dichotomize between the two. Here, the average HUCBCT,cork + 115 correctly classified pixels belonging to either air cavities or surrounding polyethylene, based on manual visual confirmation.
Image–guided target localization (Imaging to radiation isocenter alignment test)
To check the alignment of the radiation to imaging isocenter a phantom with a high-CT density BB pellet with 1 mm diameter was CBCT scanned, and the imaging coordinates of the BB located on the scan, and sent to the SARRP interface. The phantom was then electronically positioned using these coordinates and the 5 mm × 5 mm collimator mounted to the treatment head. Images were taken at 90° gantry angle using the amorphous Silicon panel and at 0° gantry angle using the portal imager (the 0° gantry angle was not part of the original QA program but was added later to allow for a more complete assessment of targeting accuracy, and as such only limited data are available) and the centering of the BB in these images was analyzed. Any misalignment between radiation and imaging isocenter caused by potential mechanical inaccuracy during CBCT image acquisition rotation would result in blurry images with poor resolution, and would be detected in the image quality analysis.
Dose calculation stability
To check the effects of imaging consistency and potential changes in pixel intensity over time on the stability of the treatment plan dose calculation, a QA treatment plan was created consisting of four beams from 0°, 90°, 180° and −90° planned to 10 Gy using the 10 mm × 10 mm collimator. The aim of this test was to employ a simple and easily reproducible test for the dose calculation stability. The isocenter was set off-axis at the bottom point of the cylindrical cork cavity in the imaging phantom to allow for a reproducible treatment setup, as in Fig. 3, the plan was then calculated in the treatment planning system and the corresponding treatment time was registered for each of the four beams. The uncertainty due to setup reproducibility was tested and estimated to be within ± 1 s for each treatment beam. The variation in treatment time can be converted into the corresponding variation in radiation dose based on the dose rate.
Figure 3.
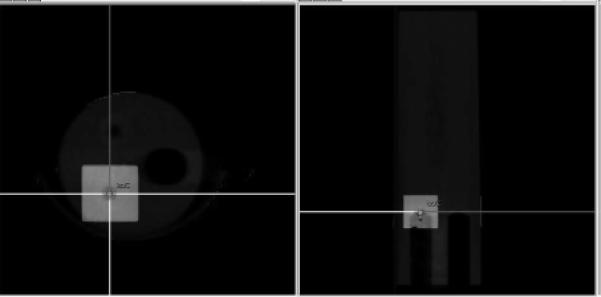
Example showing the field setup for checking dose calculation stability. The selected isocenter is depicted in the center of the crosshairs of the applied radiation beams. Notice the isocenter is placed on the top part of the cork cavity to allow a consistent isocenter setup between measurements.
RESULTS
Dosimetric output constancy
In terms of dose output constancy the SARRP proved to be very stable over the six-month course of QA measurements with a variation in dose rate of less than 1% (Fig. 4). During the six-month measurement period the mean temperature and air pressure in the SARRP room was 24.2 ± 1.2 °C and 762.5 ± 5.8 mmHg.
Figure 4.
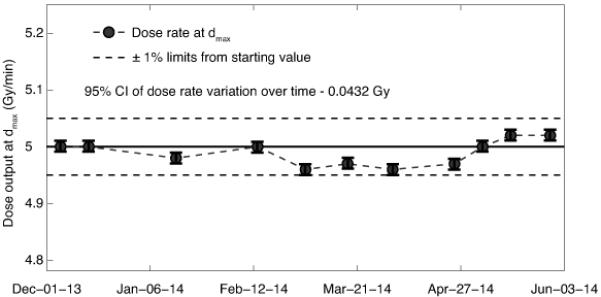
Long-term dose output consistency showing the dose rate to water at dmax. The solid line shows the dose rate at the starting date (5.0 Gy/min) and dashed lines show the ±1% limits from the starting value, uncertainty bars represent 95% confidence intervals of the dose measurements.
Consistency of image quality and resolution
Regarding the image quality assessment there is a higher frequency of measurements at the start of the six-month period. This was due to a collision between the robotic stage and the gantry arm of the SARRP, which seemed to have worsened the CBCT image resolution (something that served as a further impetus for developing an efficient image quality management program). A number of CBCT scans of the imaging phantom were performed while attempting to correct this issue, which was fixed at the indicated time point in Fig. 5 by re-aligning the imaging and radiation isocenter and performing a full re-calibration of the system. This time point is therefore marked on all figures pertaining to image resolution consistency.
Figure 5.
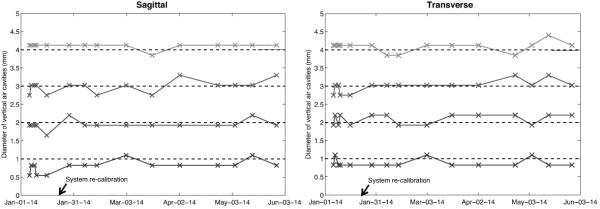
Data showing the diameters of the air resolution cavities varying in size from 1 to 4 mm, as derived from the CBCT images, in the transverse and sagittal plane respectively. The dashed lines represent the true diameter of the air cavities and the black arrow marks the date of the full system re-calibration.
The increasing diameters of the resolution air cavities (1 to 4 mm) were well represented when derived from the transverse as well as the sagittal slice orientation, as presented in Fig. 5. The phantom is positioned so that the line profile through the cavities is drawn vertically, and these plots do not indicate any problems with object representation even before the system re-calibration, except perhaps for the smallest diameter in the sagittal direction.
The diameters of the corner air cavities were obtained from horizontal and vertical line profiles in the CBCT images. Fig. 6a presents the estimated diameters and here it is clear that the image resolution is sub-optimal before the post-collision re-calibration, over- and underestimating the diameter in the horizontal and vertical directions, respectively. After re-calibration the image resolution has consistently been sufficient to estimate the diameters of the corner air cavities with an accuracy of within ± 0.2 mm of the true value. A visual example of good compared to poor image resolution is illustrated in Fig. 6b.
Figure 6.
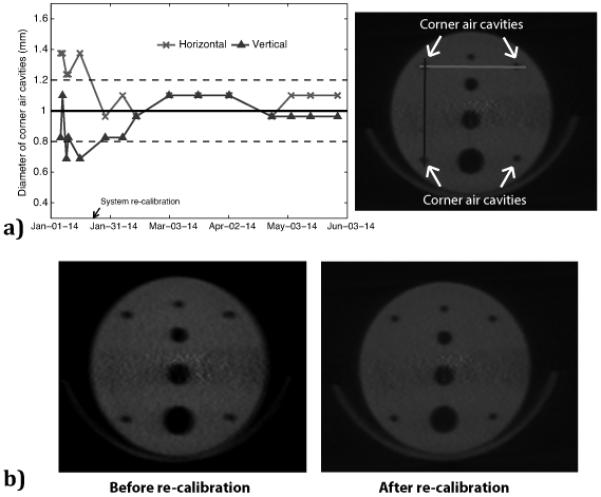
a) The left hand panel shows the corner air cavity diameters estimated from the CBCT images (average of two corner cavities), where the solid line shows the true value of 1 mm and the dashed lines represent a variation of ±0.2 mm in resolution consistency. The right hand panel shows an image of the resolution air cavities with corresponding line profiles of horizontal diameters (light grey line) and vertical diameters (dark grey line). b) Visual example of poor image resolution (left hand panel), especially evident in the horizontal direction, compared to good image resolution (right hand panel).
Object representation consistency
Table 1 shows the distances between resolution air cavities computed from the line profiles of the CBCT scans. For all three distances between the air cavities of increasing diameter, the edge-to-edge distances are somewhat larger compared to the true 3 mm. Based on the estimated distances between the corner air cavities, it is clear that before the system re-calibration there was an underestimation of the horizontal distance by almost 1 mm, which was reduced to within 0.2 mm after re-calibration.
Table 1.
Edge-to-edge distances between resolution cavities in CBCT scans and estimated width and length of the imaging phantom. Results are presented as deviation from the true values, 3 mm between air cavities, 14 mm between corner air cavities, 25.4 mm phantom diameter and 80 mm phantom length.
| Dates of QA check |
Deviation in distances between air cavities in transverse/sagittal slices (mm) |
Deviation in distances between corner air cavities (mm) |
Deviation in phantom representation (mm) |
||||
|---|---|---|---|---|---|---|---|
|
| |||||||
| 1mm→ 2mm |
2mm→ 3mm |
3mm→ 4mm |
Horizontal | Vertica l |
Diameter | Lengt h |
|
|
|
|||||||
| January 6 | 0/+0.3 | +0.6/+0.6 | +0.3/+0.3 | −0.5 | 0 | −0.1 | −0.2 |
| January 7 | +0.3/0 | 0/+0.3 | +0.3/+0.3 | −0.8 | −0.2 | −0.4 | −0.2 |
| January 9 | 0/0 | +0.3/+0.3 | +0.3/+0.3 | −0.8 | +0.3 | +1.1 | −0.5 |
| January 10 | 0/+0.3 | +0.6/+0.3 | +0.3/+0.6 | −0.8 | +0.3 | +0.2 | −0.2 |
| January 16 | +0.3/+0.6 | +0.3/+0.6 | +0.6/+0.3 | −0.8 | +0.3 | −0.1 | −1.1 |
| Isocenter re-alignment and system re-calibration on January 23 | |||||||
| January 29 | 0/0 | +0.3/+0.3 | +0.3/+0.3 | −0.2 | +0.3 | +1.0 | +0.3 |
| February 7 | 0/+0.3 | +0.3/+0.6 | +0.6/+0.3 | −0.2 | +0.3 | +1.0 | 0 |
| February 14 | +0.6/+0.3 | +0.3/+0.6 | +0.3/+0.3 | −0.5 | 0 | +1.0 | +0.6 |
| March 3 | 0/0 | +0.3/+0.3 | +0.3/+0.3 | −0.2 | +0.3 | +0.2 | 0 |
| March 18 | 0/+0.3 | +0.3/+0.3 | +0.3/+0.6 | −0.2 | 0 | +0.7 | +0.3 |
| April 25 | 0/+0.3 | +0.3/+0.3 | +0.3/+0.3 | −0.2 | 0 | +0.2 | +0.3 |
| April 3 | 0/+0.3 | +0.3/+0.3 | 0/+0.3 | −0.2 | −0.2 | −0.1 | 0 |
| May 5 | 0/+0.3 | +0.3/+0.3 | +0.3/+0.3 | −0.2 | +0.3 | +0.5 | 0 |
| May 15 | 0/0 | 0/+0.3 | 0/+0.3 | −0.2 | +0.3 | −0.1 | +0.3 |
| May 29 | 0/+0.3 | +0.3/+0.3 | +0.3/+0.3 | −0.5 | +0.3 | +0.2 | +0.3 |
Table 1 also presents the estimated diameter and length of the imaging phantom. For the phantom diameter it should be noted that the treatment couch is inevitably included in the measurement, slightly overestimating the phantom diameter.
Consistency of image intensity and Hounsfield Units
The results of the consistency in image intensity represented by CBCT HU are presented in Fig. 7 along with the pixel intensity values for the water reference scan, used to normalize the HU of the other materials, and the effects on pixel intensities from consecutive detector calibrations.
Figure 7.
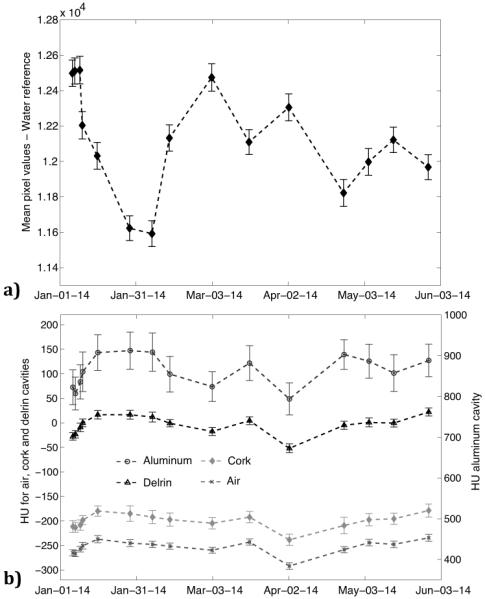
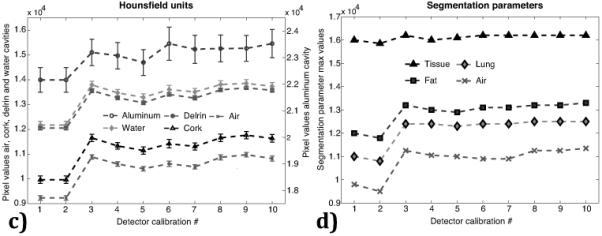
The change in mean pixel value intensity over time for the water reference is presented in (a) and the change in mean Hounsfield units over time is presented for the air, cork and polyethylene regions of interest (left axis) and for the aluminum (right axis) in (b). The variation in Hounsfield units is presented in (c) and parameters for tissue segmentation in (d) from subsequent detector calibrations. Uncertainty bars represent one standard deviation of the pixel values in the respective region of interest measurements.
There is considerable variation between time points for the water reference, with differences in intensity of up to 7%. Since the HU are normalized to the water reference this variation is less pronounced for the air, cork, polyethylene and aluminum ROIs, although still exceeding several standard deviations for some time points. Despite these instances of quite large variation in HU the representation of image intensity is fairly consistent throughout the six-month time period, without trends of systematic increases or decreases in intensity.
The seemingly random variation in the pixel intensity was not a result of changes accumulating over time but a direct result of the detector calibration performed before each CBCT scan as part of the QA protocol. As illustrated in Fig. 7c this variation is present even after performing 10 consecutive sets, all performed on the same day, of a detector calibration followed by a CBCT scan of the imaging phantom. As a result including a detector calibration in the QA process is not recommended as this in turn affects the segmentation parameters used to correctly classify different tissues in the treatment planning software (Fig. 7d).
Target localization accuracy
For the target localization test there was good and consistent agreement for the 90° gantry angle with a mean isocenter displacement of 0.3 ± 0.1 mm in the left-to-right plane and 0.4 ± 0.2 mm top-to-bottom, estimated from the BB images. The image at 0° gantry angle using the on-board portal imager was not part of the original QA protocol so it should be noted that this metric is based on only a few data points, showing an estimated left-to-right displacement of 0.1 ± 0.1 mm and a 0.7 ± 0.1 mm displacement top-to-bottom. The 0.7 mm displacement is fairly large although the image quality of the portal imager is quite poor and only a few measurements were performed for this so it was difficult to estimate the displacement in the 0° direction with certainty.
Dose calculation stability
For the dose calculation stability there are some variations in the treatment time of up to 3 s (approximately 5% of delivered dose per beam), as presented in Fig. 8, reflecting the changes in pixel intensities as a result of the detector calibrations that lead to non-uniformity in the setting of segmentation parameters prior to dose calculation. Since the treatment times are not systematically increasing or decreasing, deviations in calculated treatment times larger than ±1 s are not expected if the estimated HU remain constant.
Figure 8.
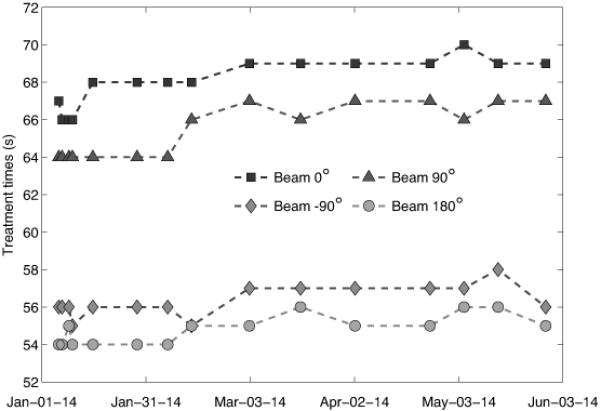
The change in calculated treatment time for each of the four beams in the quality assurance treatment plan, illustrating the consistency in dose calculation over time.
Recommendations
Based on this six-month experience, Table 2 summarizes the tests performed as part of the quality management program (QMP) and provides recommended tolerances based on the presented results. These tests were performed on a bi-monthly basis in this study although it is estimated that performing this QA procedure once a month, and immediately following any incident potentially affecting the irradiator performance, should be sufficient.
Table 2.
Tests included in the proposed quality management program and recommended tolerances for long-term consistency measures.
| Performance | Tests | Tolerance |
|---|---|---|
| Output consistency | Measure dose-rate the at isocenter using an appropriately calibrated ion chamber |
± 1% |
| Image resolution consistency / Object representation |
Use a CBCT scan of the imaging phantom to derive diameters of all resolution air cavities by vertical and horizontal line profiles. Derive distances between cavities from the same line profiles. Check the length and diameter of the imaging phantom in a sagittal slice. |
± 0.2 mm for resolution ± 0.5 mm for distances ± 1.0 mm for object size representation |
| Accuracy of image- guided target localization |
Locate a well-defined target using the high-CT density BB phantom and then verify that its location identified on the CBCT coincides with the radiation isocenter using the 5 × 5 mm2 collimator at gantry angles 0° and 90°. |
± 0.5 mm |
| Dose calculation consistency |
Calculate a four-field 10 × 10 mm2 treatment plan for 10 Gy on a reproducible isocenter in the imaging phantom and record the treatment times. |
± 2 s (± 3%) per treatment field |
DISCUSSION
In this paper a proposal for a simple and efficient QMP for modern day robotically controlled image-guided small animal irradiators is presented. Also presented are the results of the first six-month experience after implementation of this program.
The recommendations presented in Table 2 were based on the results obtained over six months and the need to consistently deliver accurate doses of radiation to precise anatomical targets. The recommendations of 0.2 mm, 0.5 mm and 1.0 mm, respectively, for resolution consistency, distances and object representation were chosen so that the normal performance of the irradiator would fall within these limits, and that a sub-optimal performance of the system would be detected. This is of course dependent on the available imager-detector setup and for a system with even better resolution it might be relevant to use stricter recommendations. The recommendations for dose constancy were based on a treatment plan with four beams delivering a total of 10 Gy with treatment times of about 55-70 s from each beam. The recommended ± 2 s thus represents approximately a ± 3 % change in the dose delivered from each beam, with the dose to the target depending on the change in each of the four beams.
The dose constancy is managed by performing free-in-air output check measurements to obtain the dose rate to water at dmax. This is appropriate for controlling the long-term performance and dose consistency of the machine but may not be enough for rigorous day-to-day treatment field verification. An alternative for daily treatment verification could be the use of a MOSFET phantom measuring treatment field uniformity (Ngwa et al. 2012) while using the presented QMP to assess long-term performance. For machine commissioning or yearly QA assessments, however, it is recommended to use one of the more comprehensive protocols available in the literature, which include depth dose curves and lateral dose profiles.(Tryggestad et al. 2009, Clarkson et al. 2011, Pidikiti et al. 2011, Lindsay et al. 2014)
For the resolution consistency parameters the QA analysis procedure is semi-automatic in order to limit the required manual input. This does, however, mean that the results will depend on the chosen cut-off values, e.g. classifying which pixels are air when measuring the parameters for the resolution cavities. This could potentially lead to misclassification of pixels due to the relative changes in pixel intensity values, and as such this method should be even more robust if there is little variation in the HU.
The tests for image resolution consistency were able to detect an error introduced by a mechanical collision, which was resolved by a full system recalibration. Although this error was a result of an accidental collision, one could potentially introduce intentional errors, such as placing attenuating material in the open field and misplacing the dose calculation isocenter, to test the ability of the dosimetric output constancy and dose calculation stability tests to detect errors.
When performing the QA analysis on the CBCT images it is important to choose a CT slice that is close to the same part of the phantom each time. This is mainly due to photon starvation that occurs because of the high-density aluminum in one of the HU cavities, and the placement of ROIs should be as reproducible as possible to limit the variation related to this photon starvation. For this study the imaging phantom was positioned based on the isocenter of the setup lasers to obtain a reproducible imaging setup.
There was considerable variation in image intensity across the different x-ray densities of the imaging phantom, exceeding ±1 standard deviation of pixel values, something that was attributed to the detector calibration performed before each quality assurance session. Thus, the detector calibration procedure was excluded from the QMP, leading to less variation in the absolute pixel values although not eliminating it completely, as some of the variation can likely be attributed to the response of the detector panel itself.
All in all, the entire QMP procedure and subsequent image analysis takes about 1 hour with the current setup. Whether it should be performed weekly, bi-monthly or once per month depends on the reliability of the system, although based on the presented results a monthly test is recommended. Although all the measurements presented here have been performed on a SARRP unit the proposed QMP is applicable to any robotic image-guided small animal irradiation device, as long as a simple imaging phantom as the one presented here is available or can be constructed/purchased. Combining the proposed monthly or bi-monthly quality assurance program with a day-to-day protocol for checking relative dosimetry and treatment field uniformity, examples of which have been previously published (Ngwa et al. 2012), would provide a complete pre-clinical QA setup, increasing the dosimetric accuracy of pre-clinical experimental studies. Applying a standardized QMP is vital to ensure that the results of pre-clinical investigations are accurate and reproducible.
Acknowledgements
This work has been supported in part by grant U19-AI091175 from the United States National Institutes of Health (NIH). Its contents are solely the responsibility of the authors and do not necessarily represent the official views of the NIH.
Short author bio

Dr. Patrik Brodin holds a MSc degree in Medical Physics from Lund University in Sweden and a PhD degree in Medical Physics from Copenhagen University in Denmark. Dr. Brodin is currently working as a postdoctoral researcher at the Albert Einstein College of Medicine in New York where he is focusing on studying radiation-driven immunotherapy, risk-adaptive radiation therapy and countermeasures for effects of acute radiation exposure.
Introductory sentence describing the paper
This paper presents a proposal for a simple and efficient quality management program for image-guided small animal irradiators. The suggested procedures are aimed at ensuring the correct delivery of radiation in pre-clinical experiments, both with regards to target localization and dosimetric output. Results are presented for the first 6 months after implementation of this protocol with respect to dose output consistency, image resolution consistency, cone-beam computed tomography target localization and dose calculation consistency.
Footnotes
Conflict of interest statement
The authors have no conflicts of interest to declare in regards to this work.
Reference list
- Bazalova M, Nelson G, Noll JM, Graves EE. Modality comparison for small animal radiotherapy: A simulation study. Medical physics. 2014;41:011710. doi: 10.1118/1.4842415. [DOI] [PMC free article] [PubMed] [Google Scholar]
- Clarkson R, Lindsay PE, Ansell S, Wilson G, Jelveh S, Hill RP, Jaffray DA. Characterization of image quality and image-guidance performance of a preclinical microirradiator. Medical physics. 2011;38:845–56. doi: 10.1118/1.3533947. [DOI] [PMC free article] [PubMed] [Google Scholar]
- Lindsay PE, Granton PV, Gasparini A, Jelveh S, Clarkson R, van Hoof S, Hermans J, Kaas J, Wittkamper F, Sonke JJ, Verhaegen F, Jaffray DA. Multi-institutional dosimetric and geometric commissioning of image-guided small animal irradiators. Medical physics. 2014;41:031714. doi: 10.1118/1.4866215. [DOI] [PubMed] [Google Scholar]
- Ma CM, Coffey CW, DeWerd LA, Liu C, Nath R, Seltzer SM, Seuntjens JP. American Association of Physicists in M. Aapm protocol for 40-300 kv x-ray beam dosimetry in radiotherapy and radiobiology. Medical physics. 2001;28:868–93. doi: 10.1118/1.1374247. [DOI] [PubMed] [Google Scholar]
- Mah P, Reeves TE, McDavid WD. Deriving hounsfield units using grey levels in cone beam computed tomography. Dento maxillo facial radiology. 2010;39:323–35. doi: 10.1259/dmfr/19603304. [DOI] [PMC free article] [PubMed] [Google Scholar]
- Matinfar M, Ford E, Iordachita I, Wong J, Kazanzides P. Image-guided small animal radiation research platform: Calibration of treatment beam alignment. Physics in medicine and biology. 2009;54:891–905. doi: 10.1088/0031-9155/54/4/005. [DOI] [PMC free article] [PubMed] [Google Scholar]
- Matinfar M, Iordachita I, Ford E, Wong J, Kazanzides P. Precision radiotherapy for small animal research. Medical image computing and computer-assisted intervention : MICCAI International Conference on Medical Image Computing and Computer-Assisted Intervention. 2008;11:619–26. doi: 10.1007/978-3-540-85990-1_74. [DOI] [PMC free article] [PubMed] [Google Scholar]
- Ngwa W, Tsiamas P, Zygmanski P, Makrigiorgos GM, Berbeco RI. A multipurpose quality assurance phantom for the small animal radiation research platform (sarrp) Physics in medicine and biology. 2012;57:2575–86. doi: 10.1088/0031-9155/57/9/2575. [DOI] [PubMed] [Google Scholar]
- Pidikiti R, Stojadinovic S, Speiser M, Song KH, Hager F, Saha D, Solberg TD. Dosimetric characterization of an image-guided stereotactic small animal irradiator. Physics in medicine and biology. 2011;56:2585–99. doi: 10.1088/0031-9155/56/8/016. [DOI] [PubMed] [Google Scholar]
- Rodriguez M, Zhou H, Keall P, Graves E. Commissioning of a novel microct/rt system for small animal conformal radiotherapy. Physics in medicine and biology. 2009;54:3727–40. doi: 10.1088/0031-9155/54/12/008. [DOI] [PMC free article] [PubMed] [Google Scholar]
- Tryggestad E, Armour M, Iordachita I, Verhaegen F, Wong JW. A comprehensive system for dosimetric commissioning and monte carlo validation for the small animal radiation research platform. Physics in medicine and biology. 2009;54:5341–57. doi: 10.1088/0031-9155/54/17/017. [DOI] [PMC free article] [PubMed] [Google Scholar]
- Verhaegen F, Granton P, Tryggestad E. Small animal radiotherapy research platforms. Physics in medicine and biology. 2011;56:R55–83. doi: 10.1088/0031-9155/56/12/R01. [DOI] [PubMed] [Google Scholar]
- Williams JP, Brown SL, Georges GE, Hauer-Jensen M, Hill RP, Huser AK, Kirsch DG, Macvittie TJ, Mason KA, Medhora MM, Moulder JE, Okunieff P, Otterson MF, Robbins ME, Smathers JB, McBride WH. Animal models for medical countermeasures to radiation exposure. Radiation research. 2010;173:557–78. doi: 10.1667/RR1880.1. [DOI] [PMC free article] [PubMed] [Google Scholar]
- Wong J, Armour E, Kazanzides P, Iordachita I, Tryggestad E, Deng H, Matinfar M, Kennedy C, Liu Z, Chan T, Gray O, Verhaegen F, McNutt T, Ford E, DeWeese TL. High-resolution, small animal radiation research platform with x-ray tomographic guidance capabilities. International journal of radiation oncology, biology, physics. 2008;71:1591–9. doi: 10.1016/j.ijrobp.2008.04.025. [DOI] [PMC free article] [PubMed] [Google Scholar]


