

Abstract
A novel method for estimating specificity of the Single Intradermal Comparative Cervical Tuberculin (SICCT) test for bovine tuberculosis (bTB) using surveillance tests results is reported. The specificity of the SICCT test at three cut-offs was estimated from the dates, locations and skinfold measurements of all routine tests carried out in Officially TB Free (OTF) cattle herds in Great Britain (GB) between 2002 and 2008, according to their separation (by distance and time) from known infected (OTF-withdrawn) herds. The proportion of animals that tested positive was constant (P>0.20) when the distance between tested herds and nearest infected herd exceeded 8 km. For standard cut-off, calculated specificity was 99.98 per cent (95 per cent confidence interval ±0.004 per cent), equating to one false positive result per 5000 uninfected animals tested. For severe cut-off it was 99.91 per cent (±0.013 per cent) and for ultrasevere cut-off (selecting all reactors and inconclusive reactors) it was 99.87 per cent (±0.017 per cent). The estimated positive predictive value of the test averaged 91 per cent and varied by regional prevalence. This study provides further evidence of the high specificity of the SICCT test under GB conditions, suggests that over 90 per cent of cattle currently culled using this test in GB were infected, and endorses slaughter of at least these cattle for bTB control.
Keywords: Specificity, Comparative Tuberculin Skin Test, Bovine tuberculosis, Cattle, Great Britain, Diagnostics
Introduction
Bovine tuberculosis (bTB) is a notifiable infectious disease of cattle caused by Mycobacterium bovis. This disease is the subject of a statutory national eradication programme in Great Britain (GB) that began in 1950 (MacRae 1961). The programme was initially successful, but bTB prevalence has risen since the 1980s and at least 31,700 cattle were slaughtered in GB as reactors to the Single Intradermal Comparative Cervical Tuberculin (SICCT) test in 2014 (Defra 2015).
The SICCT test is the primary screening test for bTB in cattle in GB and measures the delayed hypersensitivity to purified protein derivatives of standard cultures of Mycobacterium avium and M bovis, called tuberculins (Downs and others 2013). The supplementary Bovigam interferon-γ blood test (Prionics AG, Switzerland) is also sometimes used to help resolve bTB incidents on farms. Neither of these tests has perfect sensitivity or specificity. When specificity is less than 100 per cent, a proportion of animals not infected with M bovis will have a (false) positive reaction to the test, which leads to their slaughter (European Union 2013). A false positive test result can initiate or prolong a bTB herd incident (breakdown) during which the Official Tuberculosis Free (OTF) status of the herd is suspended (OTFS), and can also prolong an incident in which OTF status is withdrawn (OTFW). Imperfect specificity of surveillance tests would increase the costs of bTB eradication campaigns to farmers and government and undermine stakeholder confidence.
In the SICCT test, one can adjust the interpretation (cut-off) criterion that defines a positive result to manipulate the balance between sensitivity and specificity. Lowering the cut-off to increase test sensitivity tends to reduce its specificity, and vice versa. In GB, the standard interpretation of the SICCT test is used for OTF herds and OTFS herd incidents. ‘Severe interpretation’, which uses a more sensitive cut-off, is usually applied in OTFW herd incidents, in which characteristic bTB lesions are detected in a SICCT test reactor, or M bovis is isolated in laboratory cultures.
Detection of tuberculous lesions in the carcases of SICCT reactors and identification of M bovis from carcase tissues can help confirm the presence of bTB in a herd, but these methods are insensitive (Corner and others 1990, Crawshaw and others 2008). Thus, estimation of the specificity of the SICCT test using results from postmortem analyses is imperfect. To address this problem, studies have been conducted in assumed bTB-free cattle populations in various countries and specificity estimated based on the assumption that all positive responses were spurious. These studies have reported specificities for the SICCT test in the range 88.8–100.0 per cent, although importantly each study used a slightly different approach to conduct the SICCT test (reviewed in Monaghan and others 1994, de la Rua-Domenech and others 2006, Schiller and others 2010, Downs and others 2011, EFSA 2012, Hartnack and Torgerson 2012, van Dijk 2013).
This paper reports a novel method for estimating specificity in SICCT tested cattle, based mainly on epidemiological principles, rather than each animal's postmortem test results. The prevalence of reactors in SICCT surveillance tests is known to decrease with their distance from herds known to be infected with M bovis (Nicholson and others 2013, APHA 2014). The method employs the hypotheses that (1) the decrease in reactor prevalence is a result of decreasing prevalence of true M bovis infection, (2) there is a threshold distance beyond which further increases in distance do not significantly change the proportion of animals that react to the SICCT test, and (3) that this threshold denotes the distance beyond which the prevalence of M bovis infection is negligible in comparison with the prevalence of false-positive SICCT test results. Specificity was estimated from SICCT surveillance test results conducted beyond the threshold distance, for each of three different interpretations of the SICCT test.
Materials and methods
Data were downloaded from the Animal and Plant Health Agency (APHA) bTB surveillance database (APHA-SAM) into a Microsoft (MS) Access 2003 file at the start of April 2014. The data recorded all tuberculin tests performed on cattle in GB, including geographical locations, dates and results of SICCT tests in cattle herds. Further classification of the data was performed using MS Access 2003 queries, and the results were transferred to MS Excel 2010 files for statistical analysis and presentation.
The SICCT herd testing events used for calculating specificity were performed during the seven years between January 1, 2002 and December 31, 2008 by trained practicing veterinarians and APHA-employed veterinarians. For each event, records were selected for the herd identity, the total number of animals tested, the animals in these herds that had been identified as inconclusive reactors (IRs) and reactors, along with the sizes (in mm) of their reactions to bovine and avian tuberculin.
SICCT test interpretation
In this study, an animal was considered positive to the SICCT test according to each of three interpretations (cut-offs) of 72-hour reactions to tuberculins (Fig 1):
Standard cut-off: the reaction to bovine tuberculin (Bov) was greater than the reaction to avian tuberculin (Av) by more than 4 mm (European Union 2013);
Severe cut-off: Bov was greater than Av by more than 2 mm;
Ultrasevere cut-off: Bov was greater than Av.
FIG 1:

Skin test results: the cut-offs used for combinations of 72-hour increases in Single Intradermal Comparative Cervical Tuberculin (SICCT) test reactions to bovine and avian tuberculin (mm), where oedema was not present at the injection site. Based on the TB64 diagram for England and Scotland issued by the predecessor of APHA in January 2010. The arrows show the direction in which the diagram would be expanded for measurements greater than 7 mm. APHA, Animal and Plant Health Agency
Following APHA custom, the calculations assumed that any Bov or Av reaction equal or smaller than 2 mm was negligible; it was treated as if 0 mm.
An increase in the size of the cut-off for the net reaction to bovine tuberculin is accompanied by a reduction in sensitivity so that standard interpretation is less sensitive than severe interpretation and severe interpretation less sensitive than ultrasevere interpretation. The ultrasevere cut-off would require the slaughter not only of reactors according to severe and standard cut-offs, but also IRs.
Herds with OTF-withdrawn incidents from which M bovis transmission might occur
UK Ordnance Survey grid references of all herds were extracted from APHA-SAM; these enabled calculation of the minimum distance between each non-OTFW herd and the closest herd that was a possible source of infection. A herd with its OTF status withdrawn was considered to be a possible source of transmission to other herds in the 60 months preceding the start of its bTB incident, during its incident, and in the 60 months following the end of its incident; OTFW herds in this time widow will be termed hazardous OTFW herds. Data were therefore obtained for all OTFW incidents that were ongoing at any time between January 1, 1997 and December 31, 2013. In the 60 months before the start of an OTFW incident a herd may have acquired infection during (or shortly before) the previous surveillance test, which would have been performed between one year and four years beforehand. In the 60 months after OTF status was restored, the herd may have retained one or more infected animals (Wolfe and others 2010, Conlan and others 2012, Gallagher and others 2013). The study did not attempt to optimise the durations of these 60-month precautionary periods.
Selecting herds with negligible bTB prevalence for the estimation of apparent animal-level specificity
Data for routine surveillance tests at known times and distances from OTFW incidents were used in the calculation of the apparent test specificity. Some of these surveillance tests disclosed OTFS incidents, but most of them did not affect OTF status. To avoid herds with possible undetected infection, SICCT tests conducted because of a recognised risk of M bovis infection were excluded from analysis. Tests in a herd that had experienced any OTFW incident after the start of 1986, check tests that were 6 months and 18 months after the end of an OTFS incident and tests on individual animals in the herd (e.g. tests on animals traced from known infected herds) were excluded. Tests intended to be performed 42 days or 60 days after another test were also excluded, to avoid repeatedly measuring the same animal and the possible effects on the immune response (Coad and others 2010). Such tests included retests of IRs and short-interval tests during OTFS incidents.
Routine surveillance tests that marked the start of an OTFS incident were the only tests in which standard-interpretation reactors were counted. Any routine surveillance test that identified an IR for the first time provided additional data for calculating the results of severe or ultrasevere cut-offs.
As stated above, it was assumed that the suitability of test data for the calculation of specificity depended upon the distance between the surveillance-tested herd and the nearest hazardous OTFW herd in a five-year window. Identical analyses were performed for a series of 13 distance ranges. These were: >0–1 to >5–6 km in 1-km steps; >6–8 km; >8–10 km; >10–15 to >25–30 km in 5-km steps; and >30 km (Figs 2 and 3). Specificity reported in this paper is the estimate of specificity at a distance range that was not significantly different from the estimate of specificity at greater distances from the nearest hazardous OTFW incident. Where more than one estimate fulfilled this criterion, the estimate with the smallest 95 per cent confidence interval was selected.
FIG 2:

Estimates of specificity for standard, severe and ultrasevere interpretations, when the calculation is performed at various distances from the nearest herd with Officially TB Free (OTF) status withdrawn (currently, or in the previous or subsequent 60 months). Error bars represent 95% confidence intervals. Only the lower bar is shown for ultrasevere interpretation, to avoid clutter
FIG 3:

Estimates of apparent specificity for standard interpretation, when the calculation is performed at various distances from the nearest herd with Officially TB Free (OTF) status withdrawn (currently, or in the previous or subsequent 60 months). In comparison with Fig 2, the vertical axis has been expanded. Error bars represent 95% confidence intervals
Apparent animal-level specificity was calculated as 1.0 minus the proportion of animals in apparently bTB-free herds that were SICCT test reactors, at the standard, severe or ultrasevere cut-offs:
 |
therefore
 |
If M bovis infection is absent, apparent specificity is equal to true specificity.
SICCT test measurements (from APHA-SAM) were interpreted according to the TB64 chart for England (Fig 1). Information on oedema at the injection site was not available for all tests in 2002–2008 and has been omitted from Fig 1 because in practice it had little effect on the number of standard or severe reactors. The relationship between interpretations and cut-offs is shown in Table 1.
TABLE 1:
Use of the data falling into the coloured areas in Fig 1, showing the types of reactor that are reported by APHA field staff when the interpretation used is standard or severe, and the groups of presumed false positive animals used for the estimates of specificity at standard, severe and ultrasevere cut-offs
| Colour denoting type of reactor in Fig 1 | Bov -Av (mm)* | Interpretation (used by APHA field staff) |
Assumed false positive reactors used in the calculation of apparent specificity |
|||
|---|---|---|---|---|---|---|
| Standard | Severe | Standard cut-off |
Severe cut-off |
Ultrasevere cut-off |
||
| Pink (standard reactor) | >4 | Reactor (R) | Reactor (R) | INCLUDED | INCLUDED | INCLUDED |
| Orange (severe reactor) | 3, 4 | Inconclusive R | Reactor (R) | Excluded | INCLUDED | INCLUDED |
| Yellow (ultrasevere reactor) | 1, 2 | Inconclusive R | Inconclusive R | Excluded | Excluded | INCLUDED |
| Green (non-reactor) | ≤0 | Negative | Negative | Excluded | Excluded | Excluded |
*Bov and Av are the increases (mm) in skinfold thickness at the site of injection of bovine and avian tuberculin, respectively, 72 hours after injection. If the measurement for Bov or Av is 1 mm or 2 mm, it is treated as negative (0 mm) when the type of reactor is calculated
APHA, Animal and Plant Health Agency
Positive predictive value
The positive predictive value (PPV) is the proportion of animals with positive test results that are truly infected. The calculations in this paper assume that true specificity is homogeneous everywhere in GB. Values of PPV were calculated for the years 2002–2008, for which specificities have been estimated. It was assumed that tests in hazardous OTFW incidents were performed at severe interpretation and all other tests were performed at standard interpretation. Conventionally,
 |
But because the denominator represents [Total reactors], the equivalent expression will be is used:
 |
PPV was calculated for three groups of counties in GB that varied in bTB prevalence in 2013 (APHA 2014). Groups, called Risk Areas, have been defined for England by Defra (2015), and equivalent groups in Scotland and Wales are added here for completeness. The prevalence of bTB in each group is indicated by the median and interquartile range (IQR) of the proportion of herds under movement restriction (PHMRi) in each English county:
The counties with a high prevalence of bTB, which include the High Risk Area of England and counties in Wales that had a similarly high prevalence in 2013. The counties in Wales (as named by APHA-SAM) were Dyfed, Gwent, Powys and West Glamorgan. The median PHMR was 9.0 per cent and the IQR was 6.1–11.3;
The medium-prevalence counties, which comprise the so-called Edge Area in England (Defra 2015) and equivalent counties in Wales (Clwyd, Mid Glamorgan and South Glamorgan). Median PHMR was 1.7 per cent and IQR 0.9–4.3 per cent.
The low-prevalence counties, which comprises the Low-Risk Area of England (Defra 2015), two equivalent counties in Wales (Gwynedd and Anglesey), and the whole of Scotland. Median county PHMR was 0.3 per cent and IQR 0.2–0.5 per cent.
Statistical methods
For the production of specificity charts, the upper and lower confidence limits were calculated from the variance between specificity estimates for 14 six-month periods on the assumption that the estimates were independent and normally distributed.
The asymptotic regression equations used were of the form:
where y^ was fitted to a value such as apparent specificity and the calculated parameters were Asymptote, β and γ. To do this, the Solver tool in Excel 2010 was forced to minimise the sum of squares of deviations between y^ and observed values weighted by [SE]−2
The effect of distance on estimated specificity was calculated from the following comparisons: the estimates for >0–1 km and >1 km were compared, then the estimates for >1–2 km and >2 km, and so on until the estimates for >25–30 km and >30 km. The SEs of these comparisons were calculated from data for each six-month period, and the statistical significance of the comparisons was obtained using a t test. The test was one-tailed, because comparisons suitable for specificity calculations were those that did not increase with distance. Because several comparisons were conducted, a Šidák (1967) adjustment was applied to all significance probabilities to protect against overoptimistic attribution of significance:
 |
Changes in the proportion of incidents having more than one reactor were compared using Fisher's exact test (Ahmed 2013), also with one tail and a Šidák (1967) adjustment.
Results
Relation between apparent specificity and distance from the nearest potential source of infection
The increase in the apparent specificity of the SICCT test with the distance from hazardous OTFW incidents is shown in Fig 2, for standard, severe and ultrasevere cut-offs; the error bars represent 95 per cent confidence limits. The chart for standard cut-off is shown with an expanded vertical axis in Fig 3, and raw data are shown in Table 2. The threshold beyond which apparent specificity was unaffected by distance from hazardous OTFW herds was calculated from the same data.
TABLE 2:
Number of routine surveillance Single Intradermal Comparative Cervical Tuberculin (SICCT) tests* in 2002–2008 at various ranges of minimum distance from Official Tuberculosis Free status withdrawn (OTFW) incidents (currently, in the past five years or the next five years), and numbers of animals reacting to the SICCT test using standard, severe and ultrasevere cut-offs
| Distance range | Total number of animal tests (denominator) | Number of reactors according to: |
||
|---|---|---|---|---|
| Standard cut-off | Severe cut-off | Ultrasevere cut-off | ||
| >0 to 1 km | 1,244,179 | 862 | 4,304 | 6,924 |
| >1 to 2 km | 1,455,398 | 714 | 4,353 | 7,092 |
| > 2 to 3 km | 778,315 | 297 | 1,693 | 2,817 |
| >3 to 4 km | 516,352 | 119 | 791 | 1,285 |
| >4 to 5 km | 393,449 | 105 | 498 | 761 |
| >5 to 6 km | 338,391 | 78 | 341 | 534 |
| >6 to 8 km | 523,474 | 108 | 520 | 805 |
| >8 to 10 km | 358,505 | 49 | 284 | 435 |
| >10 to 15 km | 494,660 | 112 | 467 | 697 |
| >15 to 20 km | 222,064 | 38 | 195 | 272 |
| >20 to 25 km | 96,548 | 18 | 86 | 153 |
| >25 to 30 km | 55,284 | 14 | 66 | 102 |
| Over 30 km | 152,573 | 21 | 100 | 156 |
| Over 0 km | 6,629,192 | 2,535 | 13,698 | 22,033 |
| Over 1 km | 5,385,013 | 1,673 | 9,394 | 15,109 |
| Over 8 km† | 1,379,634 | 252‡ | 1,198 | 1,815 |
| Specificity estimate for >8 km | 99.982% | 99.913% | 99.868% | |
*Excluding tests applied when the perceived risk of Mycobacterium bovis is elevated, premovement tests and tests normally applied 42–60 days after a previous test
†These specificities, estimated from the aggregate data for over 8 km, differ slightly from those shown in the text, which are the means of specificity estimates for 14 six-month periods
‡In 209 distinct herds and 212 distinct testing occasions
The significance probabilities of pairs of comparisons between estimated specificity are shown in Table 3 for distances from hazardous OTFW incidents. Of the first four distance comparisons (down to ‘Over 4 km versus >3 to 4 km’), all were statistically significant (p<0.05) at the severe and ultrasevere cut-offs and three were significant (P<0.05) at the standard cut-off. At greater threshold distances fewer of the comparisons approached significance, except when >6–8 km was compared with >8 km at severe and ultrasevere cut-offs (P=0.046 and P=0.056). No comparison at greater distances showed any increase (all P were >0.20). For this reason, 8 km was considered to be the threshold distance from hazardous OTFW incidents, above which distance had no effect on apparent specificity. The distance from hazardous incidents below which the evidence for the presence of undetected infected animals was consistently significant was 4 km.
TABLE 3:
One-tailed significance probabilities for increases in estimates of apparent specificity as the threshold distance from hazardous Official Tuberculosis Free status withdrawn (OTFW) incidents increased, by the paired Student's t test, adjusted for multiple comparisons by the method of Šidák (1967)
| Distance ranges (km) from nearest OTFW being compared | Standard cut-off (P value) | Severe cut-off (P value) | Ultrasevere cut-off (P value) |
|---|---|---|---|
| Over 1 km v >0 to 1 km | <0.001 | <0.001 | <0.001 |
| Over 2 km v >1 to 2 km | <0.001 | <0.001 | <0.001 |
| Over 3 km v > 2 to 3 km | 0.001 | <0.001 | <0.001 |
| Over 4 km v >3 to 4 km | 0.844 | 0.008 | <0.003 |
| Over 5 km v >4 to 5 km | 0.490 | 0.179 | 0.221 |
| Over 6 km v >5 to 6 km | 0.710 | 0.248 | 0.204 |
| Over 8 km v >6 to 8 km | 0.550 | 0.046 | 0.056 |
| Over 10 km v >8 to 10 km* | 1.000 | 1.000 | 1.000 |
| Four comparisons for >15 km, >20 km, >25 km and >30 km (median P) | 0.790 | 0.736 | 0.696 |
*The large size of the non-significant P values for all cut-offs in this row resulted from the Šidák (1967) correction for multiple comparisons (see text)
Specificity estimated by asymptotic regression
The second method for estimating SICCT test specificity was also based on the distance of tests from hazardous OTFW incidents, but was calculated by asymptotic regression. The asymptote was the predicted value that apparent specificity would approach if the distance were infinitely large. If the assumption of homogeneous specificity holds, the asymptote would represent true specificity. Figs 2 and 3 show curved lines fitted by asymptotic regression to estimates of apparent specificity at the midpoints of all except the first and last distance ranges, weighted by the SE of the estimates to the power of −2. The asymptotic regression equations for apparent specificity, with chi-square (χ2), degrees of freedom (d.f.) and significance probability of χ2 (P), are:
Standard interpretation (per cent): 99.983−0.0778×e−0.528×[distance], χ²=9.46, 8 d.f., P=0.30;
Severe interpretation (per cent): 99.917−0.526×e−0.541×[distance], χ²=4.94, 8 d.f., P=0.76;
Ultrasevere interpretation (per cent): 99.876−0.911×e−0.545× [distance], χ²=8.37, 8 d.f., P=0.40.
The non-significant value χ2 represents a good fit. This method gives results that are well within the 95 per cent confidence limits of the estimates for distances exceeding 8 km (Table 4).
TABLE 4:
Specificity of the Single Intradermal Comparative Cervical Tuberculin (SICCT) test in Great Britain estimated by two methods: (a) using tests separated from herds with Official Tuberculosis Free (OTF) status withdrawn by more than 8 km and 60 months, and (b) as the asymptote of an asymptotic regression model of apparent specificity on separation distance
| Interpretation | (a) Specificity for distances >8 km* |
(b) Asymptotic regression |
||
|---|---|---|---|---|
| Estimate (%) | 95% confidence limits | Asymptote of specificity (%) | Goodness of fit (χ2, 8 d.f.) † |
|
| Standard | 99.983 | 99.979%, 99.987% | 99.983 | 9.46 (P=0.30) |
| Severe | 99.915 | 99.904%, 99.929% | 99.917 | 4.94 (P=0.76) |
| Ultrasevere | 99.871 | 99.853%, 99.887% | 99.876 | 8.37 (P=0.40) |
*The distance between the tests contributing to the specificity estimate and the nearest herd with its OTF status withdrawn (currently, in the previous five years, or in the next five years) was at least 8 km. The tabulated figures are derived from estimates of specificity for 14 half-years
†Non-significance indicates that asymptotic regression fitted the data well
Location of herds used in the estimation of specificity
Nearly half (14,598) of the 30,483 herd tests that were selected for the estimation of specificity were performed in Scotland (Fig 4). Herds in the north-west of Scotland were the furthest from herds that experienced a hazardous OTFW incident during the period of analysis. Less than five per cent (1484) of the selected herd tests were performed in Wales. The remaining 14,401 herd tests were in two of the risk areas defined by Defra (2015) for England, most of them being in the Low-Risk Area (12,629) with a smaller number in the Edge Area (1728).
FIG 4:
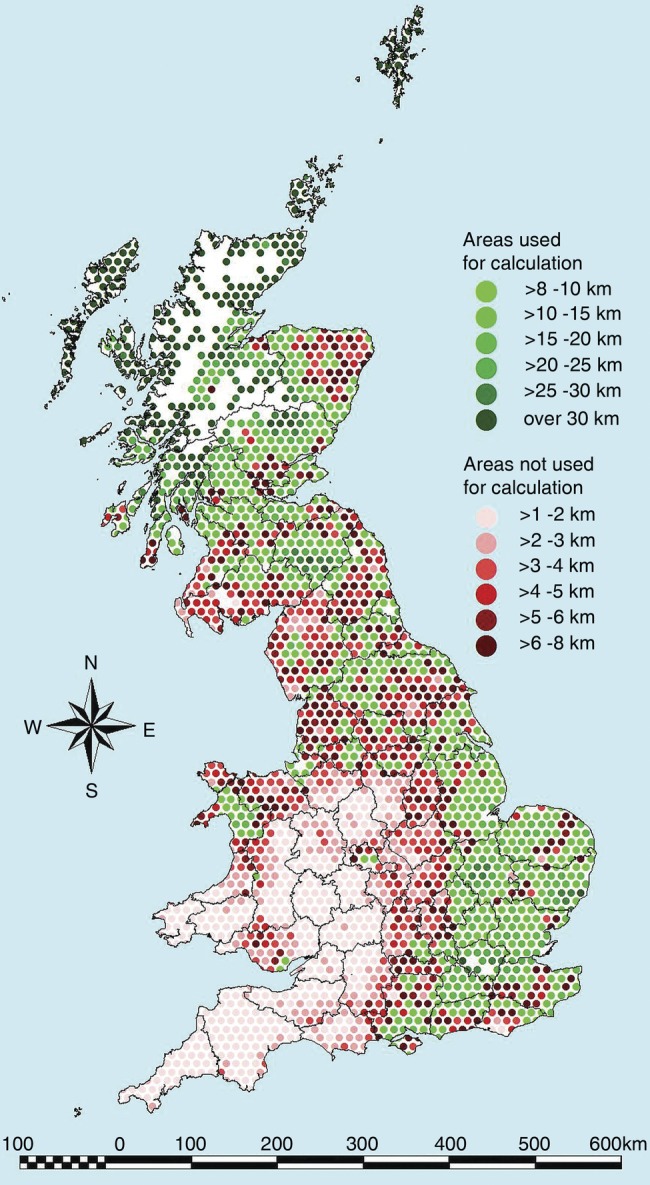
Regular 100 km² hexagonal cells in Great Britain classified according to the distance between herds Single Intradermal Comparative Cervical Tuberculin (SICCT)-tested for bovine tuberculosis (bTB) surveillance in 2002–2008 and the nearest herd that had its Officially TB Free (OTF) status withdrawn within a±60-month window. Cells where most of the herds were used for estimating specificity are marked with dots in shades of green, and other cells are marked in shades of red. In unmarked areas, no herds were surveillance-tested
Number of reactors in the disclosing test for OTFS incidents
There were 211 OTFS incidents with at least one reactor and 24 with more than one reactor disclosed among the 30,480 herd tests selected for the estimation of specificity (Table 5). This represented a proportion of 11.4 per cent of OTFS incidents with more than one reactor (95 per cent confidence interval 7.4, 16.5 per cent), or approximately 12.9 per cent of OTFS incidents calculated by asymptotic regression. At the disclosing tests of OTFS incidents, an average of 1.194 reactors was detected (1.163 by asymptotic regression). All these values are higher than expected from a purely random distribution of false positive reactors (unpublished calculations).
TABLE 5:
Number and proportion of Official Tuberculosis Free (OTF) status suspended herds having one, or more than one, reactor to the Single Intradermal Comparative Cervical Tuberculin (SICCT) test at the disclosing (first) test in Great Britain
| Distance range (km) | Number of OTFS incidents with 1 or >1 standard reactor in the disclosing test |
Proportion of OTFS incidents with >1 reactor in the disclosing tests |
||
|---|---|---|---|---|
| One standard reactor | More than 1 standard reactor * | At the distance range†(%) | Difference from the proportion at greater distances ‡ | |
| >0 to 1 | 400 | 166 | 29.3 | P<0.001 |
| >1 to 2 | 323 | 136 | 29.6 | P<0.001 |
| >2 to 3 | 149 | 48 | 24.4 | P=0.039 |
| >3 to 4 | 68 | 20 | 22.7 | P=0.22 |
| >4 to 5 | 75 | 13 | 14.8 | P=0.99 |
| >5 to 6 | 47 | 12 | 20.3 | P=0.53 |
| >6 to 8 | 73 | 14 | 16.1 | P=0.80 |
| > 8 | 187 | 24 | 11.4 | … |
| ALL DISTANCES | 1322 | 429 | 24.5 | … |
*If more than one reactor was found at the first (disclosing) test of the incident, the mean number of reactors was 3.03 at all distances, and 2.71 when the distance exceeded 8 km
†Asymptotic regressions were fitted for distances between more than 1 km and 30 km:
Proportion of disclosing tests with more than one reactor = 0.129 + 0.299 × e−0.385×Distance, χ² (7 d.f.) = 5.54, P = 0.59;
Number of reactors in disclosing tests with at least one reactor (not shown in Table 5) = 1.163 + 0.868 × e−0.389×Distance, χ² (7 d.f.) = 6.47, P = 0.60
‡By the one-tailed Fisher's exact test (Ahmed 2013), adjusted for multiple comparisons by the method of Šidák (1967)
OTFS, Official Tuberculosis Free status suspended
Positive predictive value
The number of SICCT reactors detected by the 28.50 million animal tests performed in the high-prevalence counties between 2002 and 2008 was 159,604 (APHA-SAM data). Severe interpretation of the SICCT test would have been used for most of the tests in OTFW incidents (10.94 million tests), and standard interpretation was used for the remaining 17.57 million tests. If false-positive rates (that is, 100 per cent minus specificity) were 0.017 and 0.085 per cent for standard and severe cut-offs, respectively, one would expect to find 2987 standard and 9295 severe false-positive reactors in the high-prevalence counties of GB. This would imply that the PPV of the test in the high-prevalence counties was 92.3 per cent (Table 6), as in:
 |
TABLE 6:
Calculation of the positive predictive value (PPV) for the Single Intradermal Comparative Cervical Tuberculin (SICCT) test in three groups of Great Britain (GB) counties that vary in bovine tuberculosis (bTB) prevalence, with 95% confidence intervals based on the confidence intervals of specificity
| Group of counties and description |
||||
|---|---|---|---|---|
| High prevalence | Medium prevalence | Low prevalence | ||
| GB High-Risk Area+4 Welsh counties | GB Edge Area +3 Welsh counties | GB Low-Risk Area+Gwynedd+Anglesey+Scotland | All of GB | |
| Numbers of herds, tests or reactors | ||||
| Average number of herds between 2002 and 2008 | 38,535 | 11,952 | 40,913 | 91,400 |
| Total number of animal SICCT tests | 28,503,486 | 2,196,242 | 5,212,417 | 35,912,145 |
| Tests at severe interpretation* | 10,935,657 | 259,673 | 273,017 | 11,468,347 |
| ∴Tests at standard interpretation | 17,567,829 | 1,936,569 | 4,939,400 | 24,443,798 |
| ∴Total false positive reactors (with 95% confidence interval)† | 12,282 (10,048 to 14,187) |
550 (436 to 660) |
1072 (836 to 1299) |
13,904 (11,320 to 16,143) |
| Actual number of reactors | 159,604 | 4,818 | 4649 | 169,071 |
| ∴PPV if the interpretation was severe only for OTFW incidents (with 95% confidence interval) |
92.3% (91.1 to 93.7%) |
88.6% (86.4 to 90.9%) |
76.9% (72.1 to 82.0%) |
91.8% (90.5 to 93.3%) |
| ∴PPV if all tests had been at severe interpretation (with 95% confidence interval) | 89.5% (88.2 to 91.3%) |
74.8% (71.6 to 79.0%) |
46.6 (39.7 to 55.4%) |
87.7 (86.1 to 89.7%) |
| ∴PPV if all tests had been at ultrasevere interpretation (with 95% confidence interval)‡ | 88.9% (87.4 to 90.3%) |
74.3 (70.7 to 77.5%) |
43.2 (35.3 to 50.3%) |
86.9 (85.1 to 88.6%) |
*This is based on the total number of tests performed during OTFW incidents
†The total number of false positive reactors
= (1–[specificity at standard interpretation]) × [number of tests at standard interpretation] + (1 – [specificity at severe interpretation]) × [number of tests at severe interpretation];
= 0.017% (95% confidence interval 0.013, 0.021%) × number of tests at standard interpretation + 0.085% (0.071, 0.096%) × number of tests at severe interpretation
OTFW, Official Tuberculosis Free status withdrawn
Details of the calculation of PPV estimates for the medium and low-prevalence counties of GB (88.6 per cent and 77.2 per cent, respectively) are also shown in Table 6. The PPV of the test for GB as a whole was 91.8 per cent.
Discussion
The relationship between estimated specificity and distance from the nearest hazardous OTFW incident suggests that the true specificity of the SICCT test is equal to apparent specificity in herds >8 km away that had OTF status withdrawn currently, or in the previous or next five years. Reactors within 8 km of known infected herds are more likely to harbour undetected infection than herds further away. The proportion of animals reacting to the SICCT test in OTFS disclosing tests is significantly elevated if hazardous OTFW herds are up to 4 km away, suggesting that some of them represent unconfirmed infected animals. This distance is similar to the median rate of advance of the edge of endemic bTB areas in GB between 2002 and 2012, which is around 4 km a year (Nicholson and others 2013).
Relevance of specificity estimates
The three estimates of specificity were based on all data from routine surveillance tests in herds >8 km from known M bovis infection hazards. Calculations have excluded data from contiguous, tracing, check tests, IR retests and within-incident tests. These test types were excluded because there was an elevated risk that some animals had been infected with M bovis. Premovement tests were not included because they were not performed in the first half of the study period. Specificity would have been unaffected unless these tests had been performed with a different precision from other tests.
Numbers of SICCT test reactors in OTFS incidents
The proportion of OTFS incidents with more than one reactor at the disclosing test was generally larger than the number that would be expected if they had been randomly distributed between herds. This was most prominent close to hazardous OTFW herds, but occurred even in herds more than 8 km away from any hazardous OTFW incident (Table 5). Two processes seem to be occurring: for all herds with OTFS incidents, the underlying risk of false positive reactors varied from herd to herd, possibly because of spatial clustering. Also, nearer to hazardous OTFW incidents (significantly within 3 km; Table 5), the number of OTFS disclosing tests with more than one reactor is increased, suggesting that some of the reactors are, in fact, infected. Surveillance maps also show this pattern, for example that for 2013 (APHA 2014, Figure 2.2). These observations are consistent with the practice in Ireland, where multireactor breakdowns are managed as if infected, irrespective of postmortem and microbiological results (Good and Duignan 2011).
Other estimates of skin test specificity in the literature
The 11 estimates of SICCT test specificity from field data reviewed by van Dijk (2013) ranged from 94.0 per cent to 100.0 per cent, with a Monte-Carlo simulated mean of 98.0 per cent, but these estimates included tests using different approaches and under different conditions from the UK. Some of the published specificity estimates used herd test data without regard to their proximity to infected herds, or have erroneously assumed that all test reactors that lack pathological or bacteriological confirmation of infection were false positive (uninfected) reactors (e.g. Hartnack and Torgerson 2012).
Recent studies using latent class analysis assume that no perfect reference (‘gold’) standard exists for bTB, but are forced by the methodology to use subpopulations with diverse disease prevalence. Some of these are likely to come from animals exposed to M bovis organisms or antigens (see Hartnack and Torgerson 2012; Clegg and others 2011; EFSA 2012), which are arguably inappropriate for specificity estimation. Analyses of GB data are more consistent with the results presented here. A median value of 100 per cent with a credible interval 99 per cent to 100 per cent was found in a Bayesian framework meta-analysis (Downs and others 2011, EFSA 2012), and modal posterior estimates of 99.977 per cent and 99.997 per cent were derived from GB data by Approximate Bayesian Computation in the within-herd models of Conlan and others (2012).
The assumption of spatially homogeneous specificity
The estimates of PPV assume that true specificity is not affected by distance from infected herds. The time between surveillance tests varied between one year and four years during the study, and herds closer to hazardous OTFW incidents tended to have shorter testing intervals owing to bTB control protocols. In contrast to possible increases in specificity in frequently tested animals (Coad and others 2010), proximity to hazardous OTFW incidents was actually associated with reduced apparent specificity (Figs 2 and 3). The smooth asymptotic relationship between apparent specificity and distance from hazardous OTFW incidents suggests that there are no abrupt changes in true specificity as the distance increases.
Low-prevalence areas are exactly the areas where specificity is of greatest importance in bTB control. Those areas provided the data from which specificity has been estimated in this study.
The estimate of SICCT specificity for tests more than 8 km from OTFW incidents varied significantly from one half-year to the other between 2002 and 2008 (p<0.001 for all three cut-offs). This may have been associated with batch-to-batch differences in tuberculin (Tameni and others 1998, Downs and others 2013). The coefficient of variation of false positive reactor prevalence calculated from six-monthly estimates was 40 per cent, 26 per cent and 22 per cent for the standard, severe and ultrasevere cut-offs, respectively. The source of tuberculin used in GB in most tests between 2002 and 2008 was from Weybridge, but in the first 9 months of 2006 and for the 12 months starting in April 2007 it was Lelystad Biologicals B.V. in the Netherlands (Downs and others 2013). The data (not shown) supports the finding of Downs and others that the specificity of the SICCT test was marginally greater when using Lelystad tuberculin than when using Weybridge tuberculin.
Positive predictive value
In GB as a whole, the PPV of the SICCT test for the mix of interpretations currently used was 91.8 per cent, meaning that 11 out of 12 SICCT test reactors were truly infected. This figure is only slightly smaller than the PPV estimate for the high-prevalence counties, and is over twice as large as the proportion of SICCT reactors that have postmortem evidence of infection in GB (30-40 per cent; Figure 6.2 in APHA 2014). It suggests that postmortem and laboratory investigations profoundly underestimate the proportion of reactors that is truly infected. In the high-prevalence counties, the PPV for ultrasevere interpretation is acceptable (88.9 per cent, 95 per cent confidence interval 87.4 per cent to 90.3 per cent), which would appear to justify culling all IRs as well as reactors from herds. This value is based on aggregate data, and one would need to take precautions against removing false positive reactors from so-called ‘non-specific reactor’ herds that yield an excessive number of non-specific reactors. One should also remember that reactors in routine surveillance tests supplying data for specificity calculations were assumed to be uninfected, which implies that the PPV of these particular tests was zero.
Conclusions
Values for the specificity of the SICCT test between 2002 and 2008 (with 95 per cent confidence intervals) have been calculated for surveillance tests in herds that had not suffered an OTFW incident between 1986 and 2013 and were at least 8 km from any OTFW incident in the previous or next five years. The specificity estimates (with 95 per cent confidence intervals) for three cut-offs were as follows:
Standard cut-off or interpretation: 99.983 per cent (99.979, 99.987 per cent);
Severe cut-off, which includes severe and standard reactors: 99.915 per cent (99.904, 99.929 per cent); and
Ultrasevere cut-off, which includes inconclusive, severe and standard reactors: 99.871 per cent (99.853, 99.887 per cent).
These values imply that the SICCT test will give rise to one false positive reactor animal for every 4760–7690, 1040–1410 or 680–885 uninfected animals tested, for standard, severe and ultrasevere cut-offs, respectively.
The average number of animals at each surveillance test throughout GB was 45.3, and there were asymptotically 1.163 false-positive standard-interpretation reactors at the disclosing test of each OTFS incident. Given these conditions, one would expect (with a 95 per cent probability) to find between five and eight new OTFS incidents in surveillance tests in every thousand uninfected herds. That is equivalent to a herd-wise specificity of between 99.2 per cent and 99.5 per cent for the average-sized test. Tests of larger herds are likely to suffer lower specificity: for example, a herd in which 250 animals are tested would have an expected herd-wise specificity of around 96.5 per cent.
According to the calculated PPV of the SICCT test, 91.8 per cent of reactors in GB were infected, varying between 92.3 per cent (95 per cent confidence interval 91.1 to 93.7 per cent) in the high-prevalence counties and 76.9 per cent (72.1 to 82.0 per cent) in the low-prevalence counties. The proportion of SICCT test reactors in which visible lesions were found or from which M bovis could be cultured is of the order of 30–40 per cent (APHA 2014, Figure 6.2). Thus, a small majority of SICCT test reactors with no visible lesions in each group of counties of GB – high, medium or low prevalence – is likely to be infected.
The study indicates that the SICCT test, as used in GB, has a very high specificity. The findings suggest that over 90 per cent of reactor cattle identified only by skin test in GB between 2002 and 2008 were infected and endorse the compulsory slaughter of all SICCT test reactor cattle for effective disease control.
Footnotes
Twitter: Follow Anthony GOODCHILD at @ElderBadchild
Funding: Funding for the analysis and writing of this paper and for open publication fees were provided by the UK Department of Environment, Food and Rural Affairs (Contract L, Project SB4500). JLNW is funded by the Alborada Trust and the Research and Policy for Infectious Disease Dynamics (RaPIDD) Program of the Science and Technology Directorate, Department of Homeland Security, Fogarty International Centre, U.S. National Institute of Health.
This proportion is labelled ‘prevalence’ in APHA (2014) and Defra (2015).
References
- ADVISORY COMMITTEE ON THE MICROBIOLOGICAL SAFETY OF FOOD. (2010) The possible health risks to consumers associated with Mycobacterium bovis and milk: Part 1 – Pasteurised milk and milk products. Report ID ACM/995 http://acmsf.food.gov.uk/sites/default/files/multimedia/pdfs/committee/acm995mbovis.pdf, (accessed 23 Sep 2014)
- AHMED A. (2013) Fisher's Exact Test Calculator (2×2 Contingency Table). http://scistatcalc.blogspot.co.uk/2013/11/fishers-exact-test-calculator.html (accessed 28 Aug 2014)
- ANIMAL AND PLANT HEALTH AGENCY (APHA). (2014) Bovine tuberculosis: Infection status in cattle in GB, Annual surveillance report for the period January to December 2013. Published by the Animal Health and Veterinary Laboratories Agency (the agency's former name). www.gov.uk/government/uploads/system/uploads/attachment_data/file/413806/tb-pub-surveport-gb13.pdf (accessed 8 May 2015)
- CLEGG T. A., DUIGNAN A., WHELAN C., GORMLEY E., GOOD M., CLARKE J., TOFT N. & MORE S. J. (2011) Using latent class analysis to estimate the test characteristics of the γ-interferon test, the single intradermal comparative tuberculin test and a multiplex immunoassay under Irish conditions. Veterinary Microbiology 151, 68–76 10.1016/j.vetmic.2011.02.027 [DOI] [PubMed] [Google Scholar]
- COAD M., CLIFFORD D., RHODES S. G., HEWINSON R. G., VORDERMEIER H. M. & WHELAN A. O. (2010) Repeat tuberculin skin testing leads to desensitisation in naturally infected tuberculous cattle which is associated with elevated interleukin-10 and decreased interleukin-1 beta responses. Veterinary Research 41, 14 10.1051/vetres/2009062 [DOI] [PMC free article] [PubMed] [Google Scholar]
- CONLAN A. J. K, MCKINLEY T. J., KAROLEMEAS K., BROOKS-POLLOCK E., GOODCHILD A. V., MITCHELL A. P., BIRCH C. P. D., CLIFTON-HADLEY R. S. & WOOD J. L. N. (2012) Estimating the hidden burden of bovine tuberculosis in Great Britain. PLoS Computational Biology 8, e1002730 10.1371/journal.pcbi.1002730 [DOI] [PMC free article] [PubMed] [Google Scholar]
- CORNER L., MELVILLE L., MCCUBBIN K., SMALL K. J., MCCORMICK B. S., WOOD P. R. & ROTHEL J. S. (1990) Efficiency of inspection procedures for the detection of tuberculous lesions in cattle. Australian Veterinary Journal 67, 389–392 10.1111/j.1751-0813.1990.tb03020.x [DOI] [PubMed] [Google Scholar]
- CRAWSHAW T. R., GRIFFITHS I. B. & CLIFTON-HADLEY R. S. (2008) Comparison of a standard and a detailed post mortem protocol for detecting Mycobacterium bovis in badgers. Veterinary Record 163, 473–477 10.1136/vr.163.16.473 [DOI] [PubMed] [Google Scholar]
- DE LA RUA-DOMENECH R., GOODCHILD A. T., VORDERMEIER H. M., HEWINSON R. G., CHRISTIANSEN K. H. & CLIFTON-HADLEY R. S. (2006) Ante mortem diagnosis of tuberculosis in cattle: A review of the tuberculin tests, gamma-interferon assay and other ancillary diagnostic techniques. Research in Veterinary Science 81, 190–210 10.1016/j.rvsc.2005.11.005 [DOI] [PubMed] [Google Scholar]
- DEPARTMENT FOR ENVIRONMENT, FOOD AND RURAL AFFAIRS (Defra). (2015) Latest statistics on the incidence of tuberculosis (TB) in cattle in Great Britain. www.gov.uk/government/uploads/system/uploads/attachment_data/file/410906/bovinetb-statsnotice-11mar15.pdf (accessed 25 Mar 2015) [Google Scholar]
- DOWNS S. H., CLIFTON-HADLEY R. S., UPTON P. A., MILNE I. C., ELY E. R., GOPAL R., GOODCHILD A. V. & SAYERS A. R. (2013) Tuberculin manufacturing source and breakdown incidence rate of bovine tuberculosis in British cattle, 2005–2009. Veterinary Record 172, 98 10.1136/vr.100679 [DOI] [PubMed] [Google Scholar]
- DOWNS S. H., PARRY J., NUNEZ-GARCIA J., ABERNETHY D. A., BROUGHAN J. M., CAMERON A. R., COOK A. J., DE LA RUA-DOMENECH R., GOODCHILD A. V., GREINER M., GUNN J., MORE S. J., RHODES S., ROLFE S., SHARP M., UPTON P., VORDERMEIER H. M., WATSON E., WELSH M., WHELAN A. O., WOOLLIAMS J. A. & CLIFTON-HADLEY R. S. (2011) Meta-analysis of diagnostic test performance and modelling of testing strategies for control of bovine tuberculosis in GB. Proceedings of the Society of Veterinary Epidemiology and Economics Leipzig, Germany, March 23 to 25, 2011, pp. 139–153 [Google Scholar]
- EUROPEAN FOOD SAFETY AUTHORITY (2012) Panel on animal health and welfare: Scientific Opinion on the use of a gamma interferon test for the diagnosis of bovine tuberculosis. EFSA Journal 10, 2975, 63pp. http://www.efsa.europa.eu/en/efsajournal/pub/2975.htm (accessed 18 Jul 2014) [Google Scholar]
- EUROPEAN UNION. (2013) COUNCIL DIRECTIVE of 26 June 1964 on animal health problems affecting intra-Community trade in bovine animals and swine (64/432/EEC) [as amended, published on 1st July 2013]. http://eur-lex.europa.eu/legal-content/EN/TXT/PDF/?uri=CELEX:01964L0432-20130701&qid=1408621801337&from=EN. (Accessed 21 Aug 2014)
- GALLAGHER M. J., HIGGINS I. M., CLEGG T. A., WILLIAMS D. H. & MORE S. J. (2013) Comparison of bovine tuberculosis recurrence in Irish herds between 1998 and 2008. Preventive Veterinary Medicine 111, 237–244 10.1016/j.prevetmed.2013.05.004 [DOI] [PubMed] [Google Scholar]
- GOOD M. & DUIGNAN A. (2011) An evaluation of the Irish Single Reactor Breakdown Protocol for 2005–2008 inclusive and its potential application as a monitor of tuberculin test performance. Veterinary Microbiology 151, 85–90 10.1016/j.vetmic.2011.02.029 [DOI] [PubMed] [Google Scholar]
- HARTNACK S. & TORGERSON P. R. (2012) The accuracy of the single intradermal comparative skin test for the diagnosis of bovine tuberculosis – estimated from a systematic literature search. Journal of Mycobacterial Diseases 2, 120 [Google Scholar]
- MACRAE W. D. (1961) The eradication of bovine tuberculosis in Great Britain. Symposium Number 4: Tuberculosis in Animals Eds Ritchie J. N. & MacRae W. D. Zoological Society of London, May 24th, 1960 pp. 81–90 [Google Scholar]
- MONAGHAN M. L., DOHERTY M. L., COLLINS J. D., KAZDA J. F. & QUINN P. J. (1994) The tuberculin test. Veterinary Microbiology 40, 111–124 10.1016/0378-1135(94)90050-7 [DOI] [PubMed] [Google Scholar]
- NICHOLSON R., ASHTON A., GOODCHILD A., ALEXANDER N., WINT W., BROUGHAN J. & BRUNTON L. A. (2013) Approaches for mapping the spread of endemic bovine TB in Great Britain. Proceedings of the GeoVet Conference Royal Veterinary College, London, August 21 to 23, 2013 [Google Scholar]
- SCHILLER I., OESCH B., VORDERMEIER H. M., PALMER M. V., HARRIS B. N., ORLOSKI K. A., BUDDLE B. M., THACKER T. C., LYASHCHENKO K. P. & WATERS W. R. (2010) Bovine tuberculosis: a review of current and emerging diagnostic techniques in view of their relevance for disease control and eradication. Transboundary and Emerging Diseases 57, 205–220 10.1111/j.1865-1682.2010.01148.x [DOI] [PubMed] [Google Scholar]
- ŠIDÁK Z. K. (1967) Rectangular confidence regions for the means of multivariate normal distributions. Journal of the American Statistical Association 62, 626–633 [Google Scholar]
- TAMENI S., AMADORI M., SCACCAGLIA P., QUONDAM-GIANDOMENICO R., TAGLIABUE S., ACHETTI I. L., ADONE R. & CIUCHINI F. (1998) Quality controls and in vitro diagnostic efficiency of bovine PPD tuberculins. Biologicals 26, 225–235 10.1006/biol.1998.0147 [DOI] [PubMed] [Google Scholar]
- VAN DIJK J. (2013) Towards risk-based test protocols: Estimating the contribution of intensive testing to the UK bovine tuberculosis problem. PLoS ONE 8, e63961 10.1371/journal.pone.0063961 [DOI] [PMC free article] [PubMed] [Google Scholar]
- WOLFE D. M., BERKE O., KELTON D. F., WHITE P. W., MORE S. J., O'KEEFFE J. & MARTIN S. W. (2010) From explanation to prediction: a model for recurrent bovine tuberculosis in Irish cattle herds. Preventive Veterinary Medicine 94, 170–177 10.1016/j.prevetmed.2010.02.010 [DOI] [PubMed] [Google Scholar]