

Abstract
Down syndrome (DS) is the most common genetic cause of intellectual disability and is primarily caused by the triplication of chromosome 21. The overexpression of APP may be sufficient to overexpression's disease (AD) neuropathology that is observed in virtually all individuals with DS by the age of 40 years. There is relatively little information about inflammation in the DS brain and how the genetics of DS may alter inflammatory responses and modify the course of AD pathogenesis in this disorder. Using the macrophage classification system of M1, M2a, M2b and M2c inflammatory phenotypes we have shown that the early stages of AD are associated with a bias toward an M1 or M2a phenotype. In later stages of AD, markers of M1, M2a and M2c are elevated. We now report the inflammatory phenotype in a DS autopsy series to compare this with the progression in sporadic AD. Tissue from young DS cases (under 40 years of age, pre-AD) show a bias toward M1 and M2b states with little M2a or M2c observed. Older DS cases (over 40 with AD pathology) show a distinct bias toward an M2b phenotype. Importantly, this is distinct from sporadic AD where the M2b phenotype has been rarely, if ever observed in post-mortem studies. Stimulated by immune complex activation of microglial cells and toll-like receptor activation, the M2b phenotype represents a unique neuroinflammatory state in diseased brain and may have significant implications for therapeutic intervention for persons with DS.
Introduction
Down syndrome (DS) is a genetic disorder resulting from the triplication of chromosome 21 (Lejeune, et al., 1959). It is the most common chromosomal abnormality in humans and is characterized by both physical and neurological features (Lott, 1992). Improved education and health care have significantly increased both the life span and the quality of life for DS individuals. The amyloid precursor protein gene (APP) lies on chromosome 21, and thus is triplicated in DS (Korenberg, et al., 1990). The vast majority of DS individuals over the age of 40 will develop significant amyloid pathology that is indistinguishable from Alzheimer's disease (AD) including beta-amyloid (Aβ) plaques and neurofibrillary tangles (Leverenz and Raskind, 1998, Wisniewski, et al., 1985). By 50-60 years many, but not all, of these individuals will develop dementia (Johannsen, et al., 1996, Schupf and Sergievsky, 2002). With the emergence of anti-amyloid agents as potential preventative therapies for AD, there is excitement in the field regarding the translation of these approaches to people with DS. Our goal is to better understand the aging DS brain to inform the potential for translation of AD therapies to DS.
Neuroinflammation is thought to contribute to the progression and severity of AD. Originally described by Alois Alzheimer in 1907 (Alzheimer, et al., 1995) microglia have long been known to surround amyloid plaques in the AD brain. Later, mechanistic studies described the contribution of microglia to AD pathogenesis including clearance of Aβ via phagocytosis, neurotoxicity via pro-inflammatory cytokine production, and increased amyloid deposition via neuronal cytokine signaling (Colton and Wilcock, 2009, McGeer and McGeer, 1998, Streit, et al., 1988). More recently, clear phenotypes have been characterized for neuroinflammatory processes that are multifaceted (Mandrekar-Colucci and Landreth, 2010). Work in our laboratory shows that the AD brain exhibits broad heterogeneity in its neuroinflammatory state (Sudduth, et al., 2013b). We use the markers of macrophage phenotypes M1, M2a, M2b and M2c to identify the bias of a given sample toward one state or another along a spectrum of possible responses (Edwards, et al., 2006, Mosser and Edwards, 2008). When we examine early stage AD brain, we find not only heterogeneity, but there was an apparent bias that distinguished two populations within the early AD group. One half of the early AD cases show a bias toward a pro-inflammatory, M1 phenotype, while the other half of the early AD cases show a bias toward a wound-repair, M2a phenotype (Sudduth, et al., 2013b). In contrast, late stage AD showed a more homogeneous neuroinflammatory state, with markers of M1, M2 and M2c being elevated. Interestingly, the M2b phenotype was never seen in the AD samples.
Examination of the inflammatory genes that are expressed on chromosome 21 led us to hypothesize that the brain in DS may show a bias toward an M1 phenotype (Wilcock, 2012). We examined neuroinflammatory markers in post-mortem DS frontal cortex, both in young individuals, prior to AD development, and older, with established AD neuropathology. We compared these to age-matched controls as well as sporadic AD samples.
Materials and Methods
Tissue samples
Autopsy brain tissue was obtained from several sources including the University of California (UC) at Irvine Alzheimer's Disease Research Center, the Maryland Developmental Disorders Brain Bank and the University of Kentucky Alzheimer's Disease Center. Tissue characteristics are summarized in Table 1. Human tissue collection and handling conformed to University of Kentucky/UC Irvine Institutional Review Board guidelines. All cases selected ranged from 1 to 88 years based, in part, on the availability of frozen frontal cortex. Control cases were subsequently selected to match for age and PMI (as closely as possible) to the DS cases. AD cases were selected based on PMI only to match DSAD cases (DS cases that had sufficient neuropathology for a post-mortem diagnosis of AD; (Hyman, et al., 2012). Since individuals with DSAD typically come to autopsy at younger ages than sporadic AD cases, it was not possible to match for age at death. As a result, tissues from 6 autopsy groups were available: young controls (YC, age-matched to young DS; N=16), middle aged controls (MidC, age-matched to DSAD; N=27), old controls (OC, age-matched to sporadic AD; N=9), DS (N=7), DSAD (N=29), and sporadic AD (N=9). Both males and females were included in the study, but given the challenges of matching cases, we did not match for gender. The level of premorbid ID was not available for all of the DS cases, thus it was not possible to control for this variable in the analysis.
Table 1.
Group characteristics of samples used for the study.
| Group | N | Age* | PMI* |
|---|---|---|---|
|
| |||
| Young controls (frozen) | 16 (12M, 4F) | 20.5 (8.8) | 17.8 (5.1) |
| Young controls (fixed) | 9 (5M, 4F) | 20.7 (3.8) | 12.8 (2.1) |
|
| |||
| Middle aged controls (frozen) | 26 (20M, 6F) | 49.7 (10.1) | 13.6 (4.9) |
| Middle aged controls (fixed) | 13 (7M, 6F) | 51.06 (2.4) | 14.1 (1.9) |
|
| |||
| Old controls (frozen) | 8 (2M, 6F) | 81.6 (4.7) | 3.3 (1.1) |
| Old controls (fixed) | 9 (3M, 6F) | 81.6 (4.7) | 3.3 (1.1) |
|
| |||
| Young DS (frozen) | 9 (7M, 2F) | 26.4 (14.3) | 17.7 (7.2) |
| Young DS (fixed) | 7 (4M, 3F) | 26.4 (14.3) | 17.7 (7.2) |
|
| |||
| DS with AD (frozen) | 29 (14M, 15F) | 52.0 (6.9) | 6.8 (6.2) |
| DS with AD (fixed) | 11 (6M, 5F) | 55.8 | 8.0 (2.0) |
|
| |||
| Sporadic AD (frozen) | 10 (6M, 4F) | 80.0 (7.1) | 6.8 (6.2) |
| Sporadic AD (fixed) | 8 (6M, 2F) | 81.3 (2.8) | 5.5 (1.0) |
Note: results presented are mean (SD).
Quantitative real-time RT-PCR
Frozen brain tissue was pulverized using a mortar and pestle on dry ice with liquid nitrogen and the brain powder was stored at -80°C. RNA was extracted from approximately 80mg frozen pulverized tissue using the Trizol Plus RNA Purification System (Life Technologies, Grand Island NY) according to the manufacturer's instructions. RNA was quantified using the Biospec Nano spectrophotometer (Shimadzu, Columbia MD) and cDNA was reverse transcribed using the cDNA High Capacity kit (Applied Biosystems, Foster City CA) according to the manufacturer's instructions. Real-time PCR was performed using Taqman gene expression probes shown in Table 2 (Applied Biosystems, Foster City CA). All gene expression data were normalized to 18S rRNA expression. Fold-change was determined using the 2(–delta delta Ct) method (Livak and Schmittgen, 2001).
Table 2.
Taqman probes used to measure gene expression changes.
| Gene of interest | PMID | Taqman ID |
|---|---|---|
| IL1β | NM_000576.2 | Hs00174097_m1 |
| IL-6 | NM_000600.3 | Hs00174131_m1 |
| TNFα | NM_000594.2 | Hs00174128_m1 |
| IL-12 | NM_000882.3 | Hs99999036_m1 |
| CHI3L1 | NM_001276.2 | Hs00609691_m1 |
| IL-1Ra | NM_173841.2 | Hs00893626_m1 |
| MRC1 | NM_002438.2 | Hs00267207_m1 |
| IL-10 | NM_000572.2 | Hs99999035_m1 |
| CD86 | NM_175862.4 | Hs01567025_m1 |
| FCγR1B | NM_000566.3 | Hs00174081_m1 |
| TGFβ | NM_000660.4 | Hs99999918_m1 |
Aβ ELISAs
Aβ was extracted from tissue measured as previously described (Beckett, et al., 2010). Briefly, frozen cortical samples were extracted sequentially in ice cold phosphate buffered saline (PBS, pH 7.4) with a complete protease inhibitor cocktail (PIC; Amresco, Solon, OH) and centrifuged at 20, 800 × g for 30 min. at 4°C. Following centrifugation, the supernatant was collected and the pellets were sonicated (10 × 0.5 sec pulses at 100W, Sonic Dismembrator, Fisher Scientific, Pittsburgh, PA) in 2% sodium dodecyl sulfate (SDS) with complete protease inhibitor and centrifuged at 20, 800 × g for 30 min. at 14°C. The supernatant was again collected and the remaining pellets were sonicated in 70% formic acid (FA), followed by centrifugation at 20, 800 × g for 1 hour at 4°C. Samples were stored at -80°C until time of assay.
FA-extracted material was initially neutralized by a 1:20 dilution in trisphosphate buffer (1 M Tris base, 0.5 M Na2HPO4), followed by a further dilution as needed (1:5 to 1:20, for a final dilution of 1:100 to 1:400) in Antigen Capture (AC) buffer (20mM Na3PO4, 0.4% Block Ace (AbD Serotec, Raleigh, NC), 0.05% NaN3, 2mM EDTA, 0.4M NaCl, 0.2% BSA, 0.05% CHAPS, pH 7). SDS soluble fractions were diluted as needed (1:20 to 1:50) in AC buffer alone. PBS fractions were diluted 1:4 in AC buffer alone.
Aβ×-40 and Aβ×-42 were measured using a standard, well-characterized two-site sandwich ELISA as described previously [47]. Briefly, an Immulon 4HBX plate was coated with 0.5 μg antibody per well, incubated overnight at 4°C, and blocked with a solution of Synblock (AbD Serotec, as per the manufacturer's instructions). Antigen capture was performed using monoclonal antibody Ab9 (against Human Aβ 1-16). Antigen detection was performed using biotinylated antibodies 13.1.1 (end-specific for Aβ 1-40) and 12F4 (end-specific for Aβ 1-42; Covance, Princeton, NJ), followed by NeutraVidin-HRP (Pierce Biotechnologies, Rockford, IL)
A synthetic Aβ peptide standard was run on the same plate for comparison, and standards and samples were run at least in duplicate; Aβ values were determined by interpolation relative to the standard curve. Plates were washed between steps with standard PBS containing 0.05% Tween-20 (2-4×) followed by PBS (2-4×). Plates were developed with TMB reagent (KPL, Inc., Gaithersburg, MD), stopped with 6% o-phosphoric acid, and read at 450 nm using a multiwell plate reader (BioTek, Winooski, VT).
Oligomeric Aβ from the SDS-soluble fraction was measured using a single-site sandwich ELISA similar to the one described above, except the same antibody (4G8; Covance, Princeton, NJ) was used for capture and detection. SDS samples were diluted 1:50 in AC buffer. Synthetic Aβ 42 oligomers were used to prepare a standard curve; oligomeric Aβ values were determined by interpolation relative to the standard curve.
Western blot
Protein was extracted from pulverized brain powder, prepared as described above, and quantified using the BCA protein assay kit (Thermo Scientific, Rockford, IL), according to manufacturer's instructions. 30μg protein samples from each lysate were run on a denaturing 4-20% SDS-PAGE gel. The gel was transferred onto a nitrocellulose membrane using the iBlot dry transfer system (Invitrogen, Carlsbad, CA), and Western blots were performed for CD86 (mouse anti-human CD86, 1:3000, BD Biosciences, San Jose, CA) or CD64 / FcgR1 (mouse anti-human CD64, 1:1000, BD Biosciences, San Jose, CA) as described previously (Wilcock, et al., 2008). The blots were stripped using Restore stripping buffer (Thermo Scientific, Rockford, IL) and re-probed using the above protocol for β-actin (Rabbit anti-β-actin, 1:10, 000, Cell Signaling Technology, Danvers, MA). The blots were imaged on the Odyssey imager and semi-quantitative densitometry analysis was performed using the Odyssey Imaging Software (Licor, Lincoln, NE).
Immunohistochemistry
Fixed tissue was available for 30 of 94 cases described in Table 1 that had frozen tissue. To increase our sample size, we acquired additional cases to provide sufficient cases with fixed tissue to measure HLA-DR by immunohistochemistry as described in Table 1. Tissue sections from the frontal cortex were sectioned by vibratome at 50 μm and stained by free-floating immunohistochemistry for HLA-DR (MHC-II; Dako North America, Inc. Carpinteria, CA) using previously described methods (Sarsoza, et al., 2009). Briefly, the protocol consisted of overnight incubation with the primary antibody, incubation with anti-mouse secondary antibody, amplification and detection with an ABC peroxidase kit and visualization with a DAB substrate kit (both from Vector Laboratories., Burlingame, CA). Sections were mounted on glass slides and coverslipped with Depex mounting media. The extent of immunolabeling was determined using “loads” as described previously (Head et al., 2008)
Statistical Analysis
Because matching was performed at the group level and not the individual level, paired analysis was not used for any endpoint. Student's t-test was used to compare age and PMI between each pathology group and its control. Similarly, two-group comparisons of SDS, PBS, and FA Aβ40 and 42 as well as oligomeric Aβ levels were performed using Wilcoxon's rank sum test. Reported p values for Wilcoxon tests are based on the normal approximation to the Z distribution. Group differences in HLA-DR immunoreactivity and neuroinflammatory gene expression were assessed between pathology groups and their controls, and between AD and DSAD, with Student's t-test on the log-transformed values. All analyses were performed using SAS/STAT 9.3® (SAS Institute, Inc., Cary, NC), with the exception of the densitometry analyses, which was performed as described above using Odyssey Imaging Software (Licor, Lincoln, NE).
Results
A total of 97 cases were analyzed (Table 1). Age-matching was successful for each pathology group and its control such that there were no statistically significant differences. PMI-matching was less successful in that although there were no differences between DS and YC or AD and OC, PMI was different between DSAD and MidC, with MidC have significantly longer PMI than DSAD (p<0.0001). PMI was not different between DSAD and AD.
As expected, Aβ levels were significantly increased relative to their controls in both the DS and DSAD brains as well as the sporadic AD brains (Figure 1). However, the DSAD brains showed significantly increased SDS soluble Aβ40 and FA soluble Aβ42, as well as higher levels of oligomeric Aβ (Figure 1). These data are consistent with previously shown DS and AD Aβ levels (Cenini, et al., 2012, Martin, et al., 2014). Overall, DSAD tended towards higher levels of Aβ40, Aβ42, and oligomeric Aβ relative to sporadic AD cases.
Figure 1.

Beta-amyloid levels are increased in Down syndrome and sporadic Alzheimer's disease brain. Graphs show PBS soluble, SDS soluble and formic acid soluble Aβ1-40 (AB 40), Aβ1-42 (AB 42) and oligomeric Aβ (oligomeric AB) measured by ELISA. * indicates P<0.05, ** indicates P<0.01 compared to the corresponding age matched control mean. # indicates P<0.05 significance compared to sporadic AD.
To assess microglial “activation”, immunohistochemistry for HLA-DR, a major histocompatibility complex (MHC) class II cell surface receptor, was used in a subset of fixed frontal cortex autopsy cases. There was little to no HLA-DR immunoreactivity in any of the control tissue, regardless of age and regardless of gray or white matter sampling (Figure 2; all comparisons of pathology group to control were significant at p < 0.05). Further, despite the high levels of Aβ in the DS brains as shown in Figure 1, there was a very low or absent HLA-DR immunoreactivity associated with soluble or insoluble Aβ accumulation measured by ELISA in DS cases without AD pathology. In contrast, the DSAD group, which showed the highest levels of Aβ deposition, had significantly less HLA-DR immunoreactivity than the AD brains (Figure 2; p < 0.05 for both gray and white matter).
Figure 2.
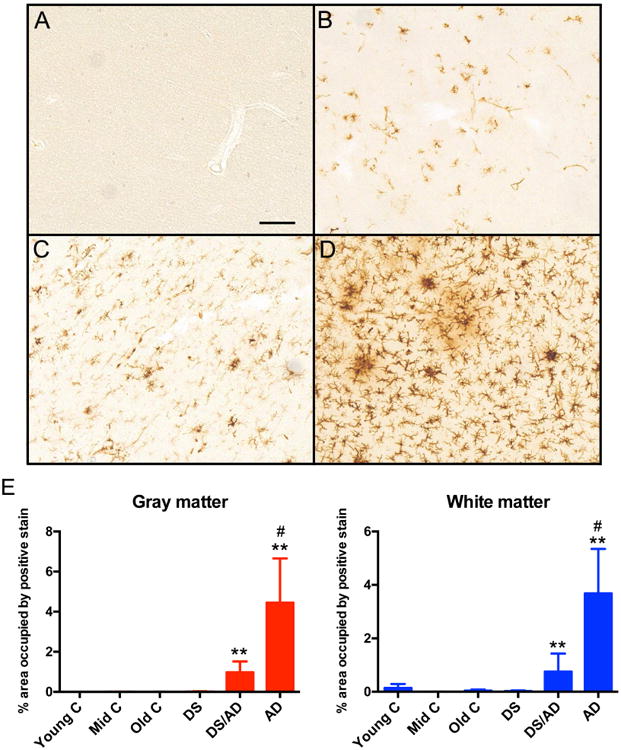
HLA-DR immunoreactivity is increased in Down syndrome with Alzheimer's disease brain and sporadic Alzheimer's disease brain. Panels A-D show representative images from frontal cortex sections of old controls (A), young Down syndrome (B), Down syndrome with Alzheimer's disease (C) and sporadic Alzheimer's disease (D). Scale bar in A for A-D = 50mm. Panel E shows percent area occupied by positive immunoreactivity for gray matter and white matter. ** indicates P<0.01 compared to the corresponding age-matched controls mean. # indicates significantly increased compared to Down syndrome with AD (DS/AD).
We next went on to characterize the neuroinflammatory state of the brains. We performed gene expression analysis of markers associated with the macrophage phenotypes M1, M2a, M2b and M2c. We found that the sporadic AD brain showed decreased expression of M1 markers IL1β and M2b markers CD86 and FcgR1, as well as increased expression of M2a marker CHI3L1 and M2c marker TGFβ1 when compared to age-matched non-demented controls (Figure 3A). The young DS brains with pre-AD neuropathology and were less than 40 years of age showed a heightened overall neuroinflammatory response relative to their age matched, non-DS controls: 8 of 11 markers showed a fold-change of at least 2 compared to control. Although only IL-12 was statistically significantly increased relative to control, we note that the young DS group comprised only 7 cases. Furthermore, CD86, FcgR1, IL1β, TGFβ1 and CHI3L3 were also significantly increased when compared to our sporadic AD cases. Interestingly, the DSAD samples showed significantly elevated levels of M2a (CHI3L3 and IL-1Ra), M2b (CD86), and M2c (TGFB) markers; 10 of 11 markers overall showed a fold-change of at least 3. Of particular interest is the elevation of M2b markers, CD86 and FcgR1 (Figure 3C). Even at the end stages of AD we have not observed elevations in M2b markers in human brain tissue, and in this study those markers are in fact significantly reduced in sporadic AD.
Figure 3.

Down syndrome brain shows a significantly different neuroinflammatory profile than sporadic Alzheimer's disease. Panels A – C show fold change in gene expression for M1, M2a, M2b and M2c specific genes for sporadic AD (A; AD> 67), young Down syndrome (B; DS Aged 0-40), and Down syndrome with AD (C; DS with AD>40). Fold change was calculated from the corresponding age-matched controls and these are indicated by the dashed line on each graph. * indicates P<0.05, ** indicates P<0.01 for a given gene compared to the corresponding age-matched controls.
In order to confirm the elevations in M2b markers, a change we have not previously observed in human brain tissue, we performed Western blot analysis for both CD86 and FcgR1 (Figure 4). The CD86 Western blots produced one band, located at 56 KDa. Densitometry analysis of the band, normalized to the densitometry of the β-actin band on the same blot, showed a significantly increased density in the DSAD brains compared to DS, AD or any of the age-matched controls (Figure 4). In addition, the FcgR1 (CD64) Western blots produced one band, located at 76KDa, also showed a significantly increased density in the DSAD brains compared to DS, AD or any of the age-matched controls (Figure 4).
Figure 4.
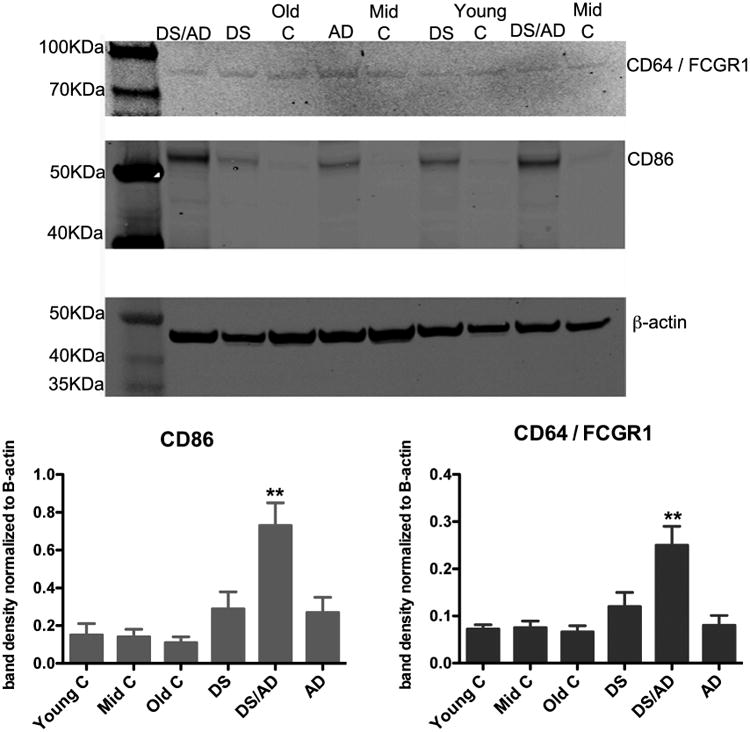
CD64 and CD86 markers of an M2b phenotype are increased significantly in brains of Down syndrome with Alzheimer's disease. Representative Western blots for CD64, CD86 and our loading control, β-actin are shown for Down syndrome (DS), Down syndrome with Alzheimer's disease (DS/AD), sporadic Alzheimer's disease (AD), young controls (Young C), middle-aged controls (Mid C) and old controls (Old C). The graphs show band densitometry analysis where the band densitometry is normalized to the density of the β-actin band for a given sample. ** indicates P<0.05 compared to all other experimental groups.
Discussion
Neuroinflammation plays a key role in the progression of AD in the general population. In DS, these pathways may be particularly important given the overexpression of multiple genes associated with pro- and anti-inflammatory processes (Wilcock, 2012, Wilcock and Griffin, 2013). We hypothesized that the DS brain may show a bias toward an M1 phenotype similar to our previous reports in sporadic AD given the predicted pattern of inflammatory gene expression. We were surprised to observe a unique inflammatory phenotype in DS that has not been reported in sporadic AD, that of an M2b response. Further, Aβ accumulation was higher in DS/AD and HLA-DR immunoreactivity for microglia was lower than sporadic AD, confirming existing studies and extending them to microglial activation (Cenini, et al., 2012). The implications of this unique phenotype for aging and disease progression in DS and response to interventions that may interact with the immune system may be critical to the design of therapeutic interventions.
Although neuroinflammation is thought to play a critical role in sporadic AD, there is very little known about the aging DS brain (reviewed in (Wilcock, 2012, Wilcock and Griffin, 2013) with early studies by Griffin's and Lemere's groups strongly suggesting that inflammation is a key pathway in DS that should be more fully examined (Griffin and Barger, 2010, Griffin, 1989, Griffin, 1998, Mrak and Griffin, 2004, Stoltzner, 2000, Wilcock and Griffin, 2013). The scarcity of studies regarding the inflammatory changes in the DS brain is particularly surprising given that chromosome 21 contains genes that are involved in many different pro- and anti-inflammatory processes (Wilcock, 2012). We provide novel data showing that the extent of HLA-DR immunoreactivity on microglial cells in the frontal white and grey matter was lower than that predicted based on the levels of Aβ. It is unclear why this is the case, however, the literature is unclear on what expression of HLA-DR represents. Clearly, HLA-DR expression is increased under pro-inflammatory conditions (Gehrmann, et al., 1993, Schmitt, et al., 2000), but also HLA-DR is increased under repair / healing conditions (Gordon and Taylor, 2005, Taylor, et al., 2005). For these reasons, we examined expression levels of specific inflammatory markers that inform a phenotype of inflammation.
While we predicted an M1 response in the DS brain, we actually observed a robust M2b response that was apparent prior to AD neuropathology onset (<40 years) and further exacerbated after pathology was observed (>40 years). This would suggest that there might be over-riding factors beyond the genetics of DS that are driving this unique phenotype. An M2b response is typically associated with the presence of immune complexes (Edwards, et al., 2006, Mosser and Edwards, 2008, Sudduth, et al., 2013a). The M2b macrophage was described in the periphery by Mosser et al. several years ago (Edwards, et al., 2006). Called the type-II activated macrophage, the group elegantly showed that activation of the Fcγ receptors by immune complexes switches the macrophage phenotype to this unique state characterized by elevations in some M1 markers, particularly IL-1β, TNF-α, and IL-6, while there was increased IL-10 and no induction of IL-12 (Mantovani, et al., 2004, Mosser and Edwards, 2008).
There were also some markers that were identified to be more specific for an M2b phenotype, including CD86 (Edwards, et al., 2006). CD86 is expressed on antigen-presenting cells and is a ligand for CD28 and CD152 on T-cells, leading to T-cell activation (Sansom, et al., 2003). We have shown that intracranial injection of pooled IgG into the brain parenchyma of amyloid depositing transgenic mice stimulates an M2b phenotype and promotes clearance of amyloid deposits (Sudduth, et al., 2013a), leading us to hypothesize that large amounts of IgG in the brain can promote an M2b phenotype through the formation of immune complexes. Therefore, we believe it is possible that the robust M2b phenotype observed in the DS brain is indicative of a cerebrovascular failure and extravasation of IgG into the brain promoting this phenotype.
The literature pertaining to cerebrovascular abnormalities in DS is sparse, but several reports suggest that there are early cerebrovascular abnormalities that highlight a need for careful examination of such pathological processes. One such instance found that children with DS demonstrate reduced brain perfusion as measured by SPECT and MRI (Aydin, et al., 2007). Further, cerebral hypoperfusion was observed in adult DS individuals both with and without demonstrated clinical dementia (Deb, et al., 1992). There is little discussion of cerebral amyloid angiopathy and hemorrhagic events in DS individuals, but several intriguing case studies suggest that these may be prevalent in the DS population (Biskup, et al., 2005, Cabrejo, et al., 2006, Mendel, et al., 2010). We hypothesize that accumulation of CAA and subsequent vascular leakage results in extravasation of IgG into the brain, promoting the M2b phenotype. Future autopsy and longitudinal aging studies can test this hypothesis.
While the current study presents data from autopsy cases that have limited if no clinical data and so we cannot speak as to when and how inflammation contributes to dementia per se, our findings highlight distinct differences between the DS brain and AD brain that warrant further investigation. It is important to note that chromosome 21 contains over 200 genes, affecting multiple protein pathways and domains that have not been fully explored in relation to aging and could significantly and possibly, adversely, affect clinical trial outcomes. Our current studies strongly suggest that, neuroinflammation has unique features in the DS aging brain but studies are currently still limited (reviewed in (Wilcock and Griffin, 2013)). This suggests a disruption in the inflammatory milieu in DS that could directly modulate responses to interventions that include immunotherapy or anti-inflammatories.
The article demonstrates that Down syndrome individuals, pre-dementia, have exacerbated neuroinflammation.
Down syndrome individuals with Alzheimer's diease show a distinct neuroinflammatory profile compared to sporadic Alzheimer's disease.
The neuroinflammation observed in Down syndrome with Alzheimer's disease is primarily an M2b state, which may be reflective of co-morbidities along with the Alzheimer's pathology, or a unique responsedue to the triplication of chromosome 21.
Acknowledgments
Research reported in this manuscript was supported by Alzheimer's Association Grant DSADNIP-13-282631, Eunice Kennedy Shriver National Institute of Child Health and Development of the National Institutes of Health under award number R01HD064993 to EH and FAS. We are grateful to the UCI-ADRC and Ira T. Lott of UCI for providing some of the tissue for the study (R01HD065160 and R01AG16573 to ITL; P50AG16573 to UCI-ADRC). Other autopsy tissue was obtained from UK ADC (P30AG28383) and from the NICHD Brain and Tissue Bank for Developmental Disorders of the University of Maryland, Baltimore, MD, contract HHSN275200900011C (N01HD90011). The content is solely the responsibility of the authors and does not necessarily represent the official views of the National Institutes of Health.
Footnotes
Conflict of interest: The authors declare no competing financial interests.
Publisher's Disclaimer: This is a PDF file of an unedited manuscript that has been accepted for publication. As a service to our customers we are providing this early version of the manuscript. The manuscript will undergo copyediting, typesetting, and review of the resulting proof before it is published in its final citable form. Please note that during the production process errors may be discovered which could affect the content, and all legal disclaimers that apply to the journal pertain.
References
- Alzheimer A, Stelzmann RA, Schnitzlein HN, Murtagh FR. An English translation of Alzheimer's 1907 paper, “Uber eine eigenartige Erkankung der Hirnrinde”. Clin Anat. 1995;8(6):429–31. doi: 10.1002/ca.980080612. [DOI] [PubMed] [Google Scholar]
- Aydin M, Kabakus N, Balci TA, Ayar A. Correlative study of the cognitive impairment, regional cerebral blood flow, and electroencephalogram abnormalities in children with Down's syndrome. Int J Neurosci. 2007;117(3):327–36. doi: 10.1080/00207450600582249. [DOI] [PubMed] [Google Scholar]
- Beckett TL, Niedowicz DM, Studzinski CM, Weidner AM, Webb RL, Holler CJ, Ahmed RR, LeVine H, 3rd, Murphy MP. Effects of nonsteroidal anti-inflammatory drugs on amyloid-beta pathology in mouse skeletal muscle. Neurobiology of disease. 2010;39(3):449–56. doi: 10.1016/j.nbd.2010.05.018. [DOI] [PMC free article] [PubMed] [Google Scholar]
- Biskup S, Mueller JC, Sharma M, Lichtner P, Zimprich A, Berg D, Wullner U, Illig T, Meitinger T, Gasser T. Common variants of LRRK2 are not associated with sporadic Parkinson's disease. Ann Neurol. 2005;58(6):905–8. doi: 10.1002/ana.20664. [DOI] [PubMed] [Google Scholar]
- Cabrejo L, Guyant-Marechal L, Laquerriere A, Vercelletto M, De la Fourniere F, Thomas-Anterion C, Verny C, Letournel F, Pasquier F, Vital A, Checler F, Frebourg T, Campion D, Hannequin D. Phenotype associated with APP duplication in five families. Brain. 2006;129(Pt 11):2966–76. doi: 10.1093/brain/awl237. [DOI] [PubMed] [Google Scholar]
- Cenini G, Dowling AL, Beckett TL, Barone E, Mancuso C, Murphy MP, Levine H, 3rd, Lott IT, Schmitt FA, Butterfield DA, Head E. Association between frontal cortex oxidative damage and beta-amyloid as a function of age in Down syndrome. Biochim Biophys Acta. 2012;1822(2):130–8. doi: 10.1016/j.bbadis.2011.10.001. [DOI] [PMC free article] [PubMed] [Google Scholar]
- Colton CA, Wilcock DM. Assessing Activation States in Microglia. CNS & neurological disorders drug targets. 2009 doi: 10.2174/187152710791012053. doi:HT-2(Town)[pii] [DOI] [PubMed] [Google Scholar]
- Deb S, de Silva PN, Gemmell HG, Besson JA, Smith FW, Ebmeier KP. Alzheimer's disease in adults with Down's syndrome: the relationship between regional cerebral blood flow equivalents and dementia. Acta Psychiatr Scand. 1992;86(5):340–5. doi: 10.1111/j.1600-0447.1992.tb03277.x. [DOI] [PubMed] [Google Scholar]
- Edwards JP, Zhang X, Frauwirth KA, Mosser DM. Biochemical and functional characterization of three activated macrophage populations. J Leukoc Biol. 2006;80(6):1298–307. doi: 10.1189/jlb.0406249. [DOI] [PMC free article] [PubMed] [Google Scholar]
- Gehrmann J, Banati RB, Kreutzberg GW. Microglia in the immune surveillance of the brain: human microglia constitutively express HLA-DR molecules. J Neuroimmunol. 1993;48(2):189–98. doi: 10.1016/0165-5728(93)90191-z. [DOI] [PubMed] [Google Scholar]
- Gordon S, Taylor PR. Monocyte and macrophage heterogeneity. Nat Rev Immunol. 2005;5(12):953–64. doi: 10.1038/nri1733. [DOI] [PubMed] [Google Scholar]
- Griffin WS, Barger SW. Neuroinflammatory Cytokines-The Common Thread in Alzheimer's Pathogenesis. US neurology. 2010;6(2):19–27. [PMC free article] [PubMed] [Google Scholar]
- Griffin WS, Stanley LC, Ling C, White L, MacLeod V, Perrot LJ, White CL, Araoz C. Brain interleukin I and S-100 immunoreactivity are elevated in Down syndrome and Alzheimer's disease. Proc Natl Acad Sci USA. 1989;86:7611–5. doi: 10.1073/pnas.86.19.7611. [DOI] [PMC free article] [PubMed] [Google Scholar]
- Griffin WST, Sheng JG, McKenzie JE, Royston MC, Gentleman SM, Brumback RA, Cork LC, Del Bigio MR, Roberts GW, Mrak RE. Life-long overexpression of S100β in Down's syndrome: Implications for Alzheimer pathogenesis. Neurbiol Aging. 1998;19(5):401–5. doi: 10.1016/s0197-4580(98)00074-8. [DOI] [PMC free article] [PubMed] [Google Scholar]
- Hyman BT, Phelps CH, Beach TG, Bigio EH, Cairns NJ, Carrillo MC, Dickson DW, Duyckaerts C, Frosch MP, Masliah E, Mirra SS, Nelson PT, Schneider JA, Thal DR, Thies B, Trojanowski JQ, Vinters HV, Montine TJ. National Institute on Aging-Alzheimer's Association guidelines for the neuropathologic assessment of Alzheimer's disease. Alzheimers Dement. 2012;8(1):1–13. doi: 10.1016/j.jalz.2011.10.007. [DOI] [PMC free article] [PubMed] [Google Scholar]
- Johannsen P, Christensen JE, Mai J. The prevalence of dementia in Down syndrome. Dementia. 1996;7(4):221–5. doi: 10.1159/000106883. [DOI] [PubMed] [Google Scholar]
- Korenberg JR, Kawashima H, Pulst SM, Ikeuchi T, Ogasawara N, Yamamoto K, Schonberg SA, West R, Allen L, Magenis E, et al. Molecular definition of a region of chromosome 21 that causes features of the Down syndrome phenotype. Am J Hum Genet. 1990;47(2):236–46. [PMC free article] [PubMed] [Google Scholar]
- Lejeune J, Turpin R, Gautier M. Mongolism; a chromosomal disease (trisomy) Bull Acad Natl Med. 1959;143(11-12):256–65. [PubMed] [Google Scholar]
- Leverenz JB, Raskind MA. Early amyloid deposition in the medial temporal lobe of young Down syndrome patients: a regional quantitative analysis. Exp Neurol. 1998;150(2):296–304. doi: 10.1006/exnr.1997.6777. [DOI] [PubMed] [Google Scholar]
- Livak KJ, Schmittgen TD. Analysis of relative gene expression data using real-time quantitative PCR and the 2(-Delta Delta C(T)) Method. Methods. 2001;25(4):402–8. doi: 10.1006/meth.2001.1262. [DOI] [PubMed] [Google Scholar]
- Lott IT. The neurology of Alzheimer disease in Down syndrome. Prog Clin Biol Res. 1992;379:1–14. [PubMed] [Google Scholar]
- Mandrekar-Colucci S, Landreth GE. Microglia and inflammation in Alzheimer's disease. CNS & neurological disorders drug targets. 2010;9(2):156–67. doi: 10.2174/187152710791012071. [DOI] [PMC free article] [PubMed] [Google Scholar]
- Mantovani A, Sica A, Sozzani S, Allavena P, Vecchi A, Locati M. The chemokine system in diverse forms of macrophage activation and polarization. Trends Immunol. 2004;25(12):677–86. doi: 10.1016/j.it.2004.09.015. [DOI] [PubMed] [Google Scholar]
- Martin SB, Dowling AL, Lianekhammy J, Lott IT, Doran E, Murphy MP, Beckett TL, Schmitt FA, Head E. Synaptophysin and Synaptojanin-1 in Down Syndrome are Differentially Affected by Alzheimer's Disease. J Alzheimers Dis. 2014;42(3):767–75. doi: 10.3233/JAD-140795. [DOI] [PMC free article] [PubMed] [Google Scholar]
- McGeer PL, McGeer EG. Glial cell reactions in neurodegenerative diseases: pathophysiology and therapeutic interventions. Alzheimer Dis Assoc Disord. 1998;12(Suppl 2):S1–6. [PubMed] [Google Scholar]
- Mendel T, Bertrand E, Szpak GM, Stepien T, Wierzba-Bobrowicz T. Cerebral amyloid angiopathy as a cause of an extensive brain hemorrhage in adult patient with Down's syndrome - a case report. Folia Neuropathol. 2010;48(3):206–11. [PubMed] [Google Scholar]
- Mosser DM, Edwards JP. Exploring the full spectrum of macrophage activation. Nat Rev Immunol. 2008;8(12):958–69. doi: 10.1038/nri2448. [DOI] [PMC free article] [PubMed] [Google Scholar]
- Mrak RE, Griffin WS. Trisomy 21 and the brain. Journal of neuropathology and experimental neurology. 2004;63(7):679–85. doi: 10.1093/jnen/63.7.679. [DOI] [PMC free article] [PubMed] [Google Scholar]
- Sansom DM, Manzotti CN, Zheng Y. What's the difference between CD80 and CD86? Trends Immunol. 2003;24(6):314–9. doi: 10.1016/s1471-4906(03)00111-x. [DOI] [PubMed] [Google Scholar]
- Sarsoza F, Saing T, Kayed R, Dahlin R, Dick M, Broadwater-Hollifield C, Mobley S, Lott I, Doran E, Gillen D, Anderson-Bergman C, Cribbs DH, Glabe C, Head E. A fibril-specific, conformation-dependent antibody recognizes a subset of Abeta plaques in Alzheimer disease, Down syndrome and Tg2576 transgenic mouse brain. Acta Neuropathol. 2009;118(4):505–17. doi: 10.1007/s00401-009-0530-3. [DOI] [PMC free article] [PubMed] [Google Scholar]
- Schmitt AB, Buss A, Breuer S, Brook GA, Pech K, Martin D, Schoenen J, Noth J, Love S, Schroder JM, Kreutzberg GW, Nacimiento W. Major histocompatibility complex class II expression by activated microglia caudal to lesions of descending tracts in the human spinal cord is not associated with a T cell response. Acta Neuropathol. 2000;100(5):528–36. doi: 10.1007/s004010000221. [DOI] [PubMed] [Google Scholar]
- Schupf N, Sergievsky GH. Genetic and host factors for dementia in Down's syndrome. Br J Psychiatry. 2002;180:405–10. doi: 10.1192/bjp.180.5.405. [DOI] [PubMed] [Google Scholar]
- Stoltzner SE, Grenfell TJ, Mori C, Wisniewski KE, Wisniewski TM, Selkoe DJ, Lemere CA. Temporal accrual of complement proteins in amyloid plaques in Down's syndrome with Alzheimer's disease. American Journal of Pathology. 2000;156(2):489–99. doi: 10.1016/S0002-9440(10)64753-0. [DOI] [PMC free article] [PubMed] [Google Scholar]
- Streit WJ, Graeber MB, Kreutzberg GW. Functional plasticity of microglia: a review. Glia. 1988;1(5):301–7. doi: 10.1002/glia.440010502. [DOI] [PubMed] [Google Scholar]
- Sudduth TL, Greenstein A, Wilcock DM. Intracranial injection of Gammagard, a human IVIg, modulates the inflammatory response of the brain and lowers Abeta in APP/PS1 mice along a different time course than anti-Abeta antibodies. J Neurosci. 2013a;33(23):9684–92. doi: 10.1523/JNEUROSCI.1220-13.2013. [DOI] [PMC free article] [PubMed] [Google Scholar]
- Sudduth TL, Schmitt FA, Nelson PT, Wilcock DM. Neuroinflammatory phenotype in early Alzheimer's disease. Neurobiol Aging. 2013b;34(4):1051–9. doi: 10.1016/j.neurobiolaging.2012.09.012. [DOI] [PMC free article] [PubMed] [Google Scholar]
- Taylor PR, Gordon S, Martinez-Pomares L. The mannose receptor: linking homeostasis and immunity through sugar recognition. Trends Immunol. 2005;26(2):104–10. doi: 10.1016/j.it.2004.12.001. [DOI] [PubMed] [Google Scholar]
- Wilcock DM. Neuroinflammation in the aging down syndrome brain; lessons from Alzheimer's disease. Current gerontology and geriatrics research. 2012;2012:170276. doi: 10.1155/2012/170276. [DOI] [PMC free article] [PubMed] [Google Scholar]
- Wilcock DM, Griffin WS. Down's syndrome, neuroinflammation, and Alzheimer neuropathogenesis. Journal of neuroinflammation. 2013;10:84. doi: 10.1186/1742-2094-10-84. [DOI] [PMC free article] [PubMed] [Google Scholar]
- Wilcock DM, Lewis MR, Van Nostrand WE, Davis J, Previti ML, Gharkholonarehe N, Vitek MP, Colton CA. Progression of amyloid pathology to Alzheimer's disease pathology in an amyloid precursor protein transgenic mouse model by removal of nitric oxide synthase 2. JNeurosci. 2008;28(7):1537–45. doi: 10.1523/JNEUROSCI.5066-07.2008. [DOI] [PMC free article] [PubMed] [Google Scholar]
- Wisniewski KE, Wisniewski HM, Wen GY. Occurrence of neuropathological changes and dementia of Alzheimer's disease in Down's syndrome. Ann Neurol. 1985;17(3):278–82. doi: 10.1002/ana.410170310. [DOI] [PubMed] [Google Scholar]