Abstract
The objective of this study was to assess the clinical role of apparent diffusion coefficient (ADC) analysis in noncystic focal liver lesion (FLL) classification/characterization.
Six hundred liver magnetic resonances with multi-b (b = 50, 400, 800 s/mm2) diffusion-weighted imaging (DwI) were retrospectively reviewed. Mean ADC was measured in 388 lesions (195 benign and 193 malignant) excluding internal necrotic areas. Cystic benign lesions were excluded from analysis. Sensitivity and specificity in distinguishing benign from malignant lesions were calculated. Analysis of variance was performed to detect differences among subgroups of solid lesions.
Mean ADC of malignant lesions was 0.980 × 10⁻³ mm2/s, significantly (P < 0.05) lower than mean ADC of benign lesions (1.433 × 10⁻³ mm2/s). Applying an ADC cutoff of 1.066 × 10⁻³ mm2/s, specificity and sensitivity for malignancy were respectively 86.6% and 73.6%. Of all lesions, >1/3 (39.5%) presented values lower than 1 × 10⁻³ mm2/s, with 90.0% chance of malignancy. Above 1.5 × 10⁻³ mm2/s (about 20% of all lesions) chance of malignancy was 9.5%.
DwI cannot assist in noncystic FLL characterization, but can help in FLL classification in about half the cases.
INTRODUCTION
Magnetic resonance (MR) diffusion-weighted imaging (DwI) is a technique for obtaining good image contrast by exploiting the properties of water molecule “diffusion” within tissue; the apparent diffusion coefficient (ADC, expressed in mm2/s), is a quantitative parameter calculated by DwI, which combines the effects of capillary perfusion and mobility of water molecules, thus reflecting the cellularity of tissues and integrity of cell membranes.
To date, DwI is potentially a very useful instrument for the study of focal liver lesion (FLL) and there is continuous and growing interest in order to credit its capacity in detecting and characterizing FLLs, identifying active areas in tumoral tissues, and predicting response to cancer treatment.1,2
The use of DwI in standard abdomen protocols is becoming usual, because it is not a time-consuming technique, capable of detecting FLL in patients with suspected malignant disease. Moreover, it is feasible also when it is not possible to administrate gadolinium chelates, as a result of refusal by patients, history of previous allergic reaction, lack of reliable venous access, and risk of nephrogenic systemic fibrosis. However, after the first period of great expectations, whereas the role of DwI in detection has been already recognized, its function in FLL classification and characterization still remains under review,3,4 and possible contribution of ADC measurement in clinical practice has not been fully clarified yet, especially when facing solid lesion with indeterminate characteristics on conventional MR imaging. In fact, as has already been demonstrated,5–10 there is a great overlap in ADC values among groups of different lesions, in particular when considering the solid ones.
Given this background, the purpose of our retrospective study was to evaluate a potential clinical role of ADC measurement for noncystic FLL classification/characterization.
MATERIALS AND METHODS
Informed written consent for magnetic resonance imaging (MRI) study and contrast agent administration was obtained from all patients immediately before the beginning of examination. This retrospective study was notified to the local ethics committee and a formal institutional review board approval was waived because patient anonymity was maintained, acquisitions were performed using standard abdomen protocol, and patient care was not impacted. All data and information derived from study images were under exclusive control of investigative radiologists.
Patients, FLLs, and Standard of Reference
Six hundreds liver MR examinations consecutively performed from June 2008 to January 2012 at the radiology department of Brescia were retrospectively reviewed by two radiologists, with 15 and 7 years of experience in abdominal MRI, working at the partnered Department of Radiology of Florence. The entry criterion for the study choice was the suspicious or known (from patient history and/or other previous exams) presence of a FLL, either benign or malignant. All the examinations were anonymized, exported from the local picture archiving and communication system to an external storage device in noncompressed digital imaging and communications in medicine format, and then transferred from Brescia Hospital to Florence University. Both radiologists were blinded to all clinical information.
Of 600 patients examined, 254 patients (116 M and 138 F, mean age 57 years, age range 21 to 82 years) were enrolled in the study. A maximum of 5 lesions for each patient were sampled. Every lesion presented the maximum diameter ≥5 mm. Detailed information of used materials is shown in Figure 1.
FIGURE 1.
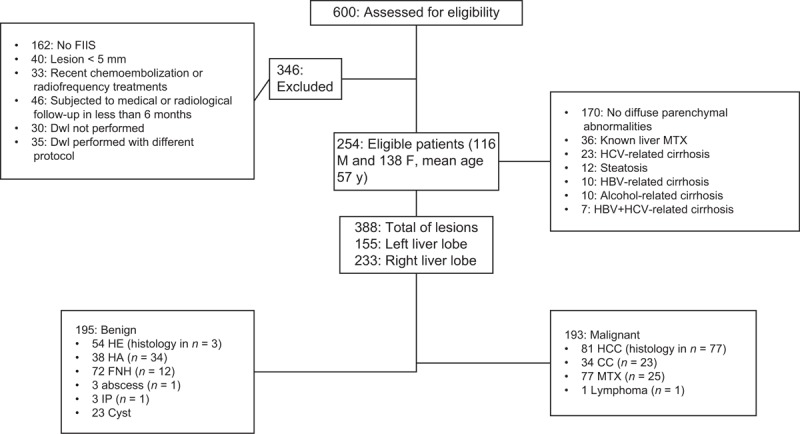
Flow chart for patient selection. CC = cholangiocarcinoma, DwI = diffusion-weighted imaging, FLL = focal liver lesion, FNH = focal nodular hyperplasias, HA = hepatic adenomas, HBV = hepatitis B virus, HCC = hepatocellular carcinoma, HCV = hepatitis C virus, HE = hemangiomas, IP = in phase, MTX = metastases.
The final diagnosis for each FLL was based on histological result, consensus reading by the two above-named radiologists using unenhanced and dynamic contrast-enhanced MR images (at least 3 examinations), clinical information, and/or follow-up imaging evaluations (at least 18 months).
A total of 388 lesions (average diameter 28 ± 15 mm, 7 to 45 range) were examined, 195 benign and 193 malignant; 155 lesions were located in the left liver lobe whereas the remaining 233 were located in the right lobe. Among the 195 benign lesions, there were 54 hemangiomas (HE), 25 cysts, 38 hepatic adenomas (HA), 72 focal nodular hyperplasias (FNH), 3 abscesses, and 3 inflammatory pseudotumors. Histological confirmation was obtained for 54 lesions: 34 HA (6 after surgical resection and 28 with biopsy), 12 FNH (all with biopsy), 3 HE, 3 inflammatory pseudotumors (biopsy), and 2 abscesses (aspiration and analysis of liquid of drainage). For the remaining benign lesions, the diagnosis was achieved based on distinctive MR findings,11–23 laboratory findings, and dimensional stability at follow-up exams.
Among the 193 malignant lesions, there were 81 hepatocellular carcinomas (HCC), 34 cholangiocarcinomas (CC), 77 metastases, and only 1 primitive lymphoma. Histological confirmation was obtained for 86 lesions, respectively: 37 HCC (12 with biopsy and 25 after resection), 23 CC (15 with biopsy and 8 after resection), 25 metastases (24 with biopsy and 1 after resection), and 1 lymphoma (biopsy). For the remaining HCC and CC, the diagnosis was made in consideration of typical MR findings,11–23 guidelines of the American Association for the Study of Liver Diseases guidelines, 24 and increase of tumor markers (α-feto-protein for HCC and carbohydrate antigen-19.9 for CC). Diagnostic confirmation for neither biopsied nor resected metastases was obtained by demonstrating dimensional changes at follow-up controls.
MRI Protocol
All examinations were performed using a 1.5-T MR body scanner with 18-channel system (Avanto, Siemens Medical Systems, Erlangen, Germany), maximum gradient strength, 45 mT/m, peak slew rate, 200 mT/m/ms, and a 4-channel phased array body coil. Detailed MR protocol is shown in Table 1, including the following sequences: axial gradient echo (GE) T1 weighted (T1w) in out-of-phase, navigator-triggered axial and coronal turbo spin echo T2 weighted with and without fat suppression, navigator-triggered axial diffusion-weighted (Dw) multi-b imaging (b value, single direction = 50, 400, 800 s/mm2), axial GE T1w imaging before and after intravenous administration of 0.025 mmol per kilogram of body weight of gadoxetic acid disodium (Gadolinium Ethoxybenzyl Diethylene-Triamine-Pentaacetic Acid, Primovist; Bayer-Schering, Berlin, Germany).
TABLE 1.
MR Protocol Details

Parallel imaging integrated technique was used with acceleration factor 2 applied to all sequences to decrease the echo train length, improve the quality of images, and reduce the acquisition time. For sequences acquired using respiratory trigger, we applied the PACE (prospective acquisition correction) technique for recognition and correction of motion artifacts. The PACE technique interleaves the imaging sequence with a navigator sequence. The information gained with the navigator is used to synchronize the measurement with the patient’s breathing cycle and to place the data acquisition period into the end-expiration phase.
The minimum b-value was set at 50 s/mm2 in order to acquire images with a high contrast-to-noise ratio for optimal conspicuity of liver lesions while keeping “pseudodiffusion” by means of perfusion effects low. Trace images were synthesized for each b-value, and ADC map was calculated from all diffusion weightings.
The scanner used showed good stability, comparable with what has already been reported: repeatability and reproducibility related errors were always <0.8%.25
Image Analysis
For the quantitative analysis of Dw images and for ADC calculation, we proceeded as follows. The lesion was detected on images obtained at b = 50 s/mm2; a region of interest (ROI) was manually drawn including the entire lesion, taking care to avoid either internal necrotic areas or adjacent vessels. Thereafter, the same ROI was positioned on the corresponding ADC map and mean ADC value was found. In case of lesions with maximum diameter >3 cm, 3 consecutive measurements were evaluated, taking into account the mean value. ROIs were drawn taking care to verify that signal intensity variations (coefficients of variation inside the ROI) were <5% at every b-value (Figure 2), especially when the lesion had been located on the left lobe. For every FLL, a ROI of similar size was also drawn in the liver parenchyma of the central part of the right lobe (to avoid cardiac motion artifacts) where data show higher reproducibility and repeatability, excluding large blood vessels, biliary vessels, and hepatic borders.25
FIGURE 2.
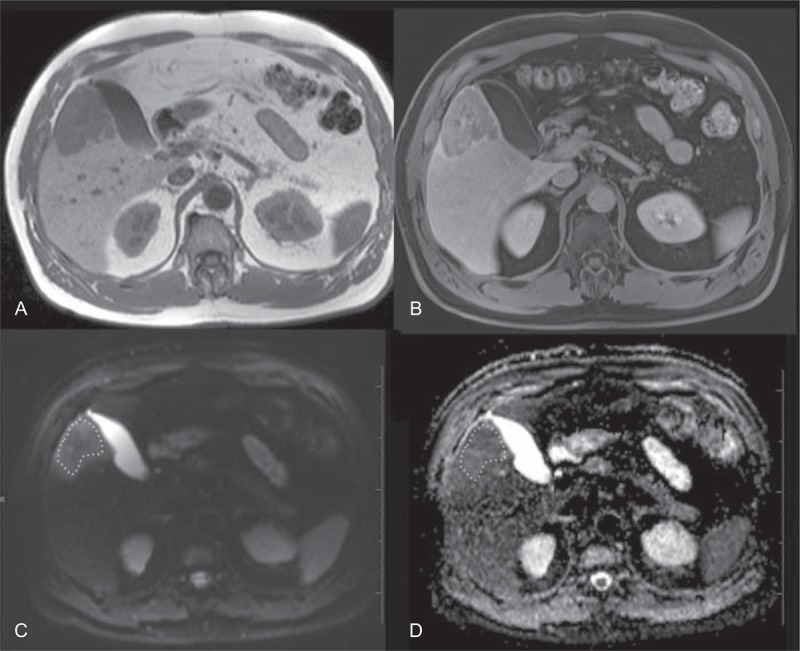
Image analysis process. The lesion (peripheral cholangiocellular carcinoma) appears hypointense on unenhanced T1w image (A) and presents heterogeneous enhancement on dynamic postcontrast scan (B, equilibrium phase). ROI (white dashed line) is manually drawn on DwI obtained at b = 50 mm/s2 (C) including the entire lesion, and the same ROI is positioned on the corresponding ADC map (D) to calculate mean ADC value.
Statistical Analysis
Both cystic lesions (cyst and abscess groups) and the single lymphoma were excluded from statistical analysis. The Levene test was used to display differences in ADC variances in benign and malignant lesion groups. T-test for independent groups was adopted to demonstrate differences between benign and malignant lesions. Then a receiver operating characteristic (ROC) analysis was performed. Sensitivity and specificity in distinguishing benign from malignant lesions were calculated on the whole spectrum of ADC values, with the corresponding areas under the curve (AUCs). Afterwards, analysis of variance was performed on the same variables, to detect significant differences among the different solid lesion subgroups. When significant differences were detected, Games-Howell and Bonferroni posthoc tests were applied, respectively, in case of significant or nonsignificant differences in subgroup variances revealed by the Levene test (significance threshold P = 0.05). Descriptive statistic was also calculated for each subgroup.
Statistical analysis was performed using Statistical Package for the Social Sciences (SPSS) version 17.0.0 (SPSS Inc., Chicago, IL).
RESULTS
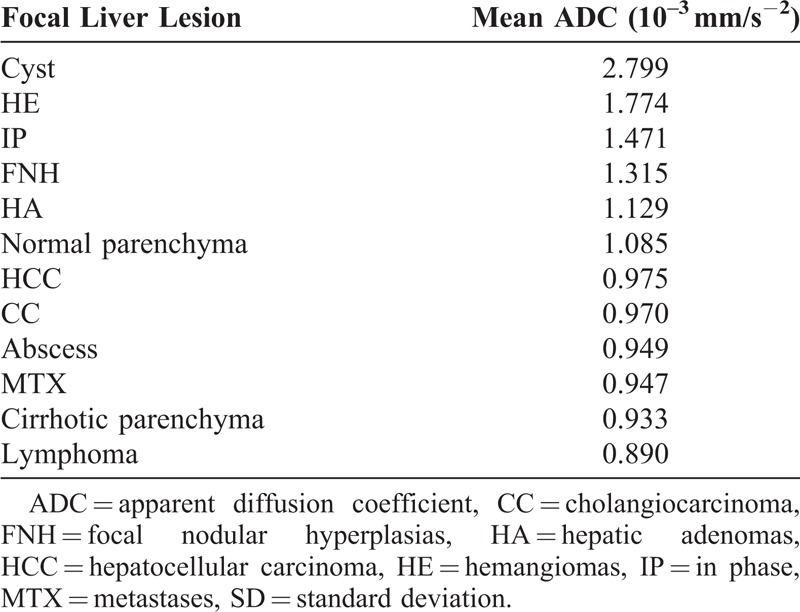
Mean ADC values of different lesion subgroups are reported in Table 2. The highest mean ADC values were found on cysts (among the nonsolid lesions) and inflammatory pseudotumors (among the solid ones). The lowest mean ADC values were found on abscesses (among the nonsolid lesions) and metastases (among the solid ones). In accordance with previous studies,5,6,26,27 the mean ADC value of cirrhotic liver parenchyma (0.933 × 10⁻³ mm2/s, standard deviation, SD = 0.055) was significantly lower (P < 0.05) than that of normal liver parenchyma (1.085 × 10⁻³ mm2/s, SD = 0.064).
TABLE 2.
Mean ADC Values of Different Lesion Subgroups. Mean ADC Value of Cirrhotic Liver Parenchyma (0.933 × 10⁻³ mm2/s, SD = 0.055) was Significantly Lower (P < 0.05) than that of Normal Liver Parenchyma (1.085 × 10⁻³ mm2/s, SD = 0.064)
Lesion Classification
The ADC mean value of malignant lesions was 0.980 × 10⁻³ mm2/s (SD = 0.254), significantly (P < 0.05) lower than the mean ADC value of benign lesions, 1.433 × 10⁻³ mm2/s (SD = 0.433) (Figure 3). On performing ROC analysis, it was found that the area under the curve with 95% confidence interval (CI) was 0.87 (0.83 to 0.91). Sensitivity and specificity for malignancy applying different ADC cutoff values are shown in Table 3. In particular, applying an ADC cutoff value of 1.066 × 10⁻³ mm2/s, specificity and sensitivity for malignancy were 86.6% and 76.3%, respectively. Distributions of malignant and benign FLLs for different intervals of ADC values are shown in Table 4. Nearly half of all lesions (42.7%) presented ADC values between 1.0 and 1.5 × 10⁻³ mm2/s.
FIGURE 3.
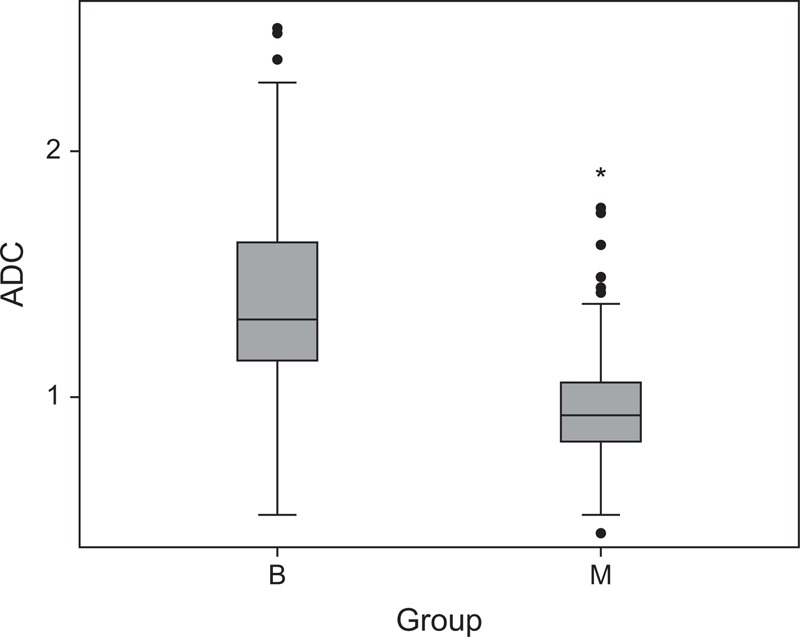
Classification. Box and whisker plots showing ADC values of benign and malignant FLLs. The horizontal line in each box is the median of measured values. Despite some overlap differences, ADC values between benign and malignant FLL were statistically significant. ADC = apparent diffusion coefficient, B = benign, M = malignant.
TABLE 3.
Sensitivity and Specificity for Malignancy Applying Different ADC Cutoff Values. Applying a Cutoff Value of 1.066 × 10⁻³ mm2/s, Specificity and Sensitivity for Malignancy are of 86.6% and 76.3%, Respectively
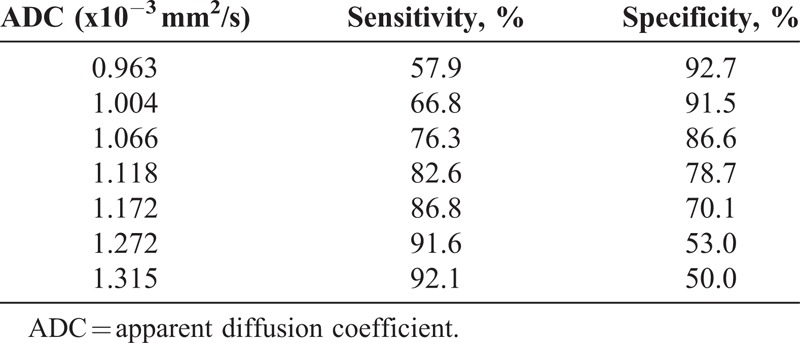
TABLE 4.
Distribution of Malignant and Benign FLLs for Different Intervals of ADC Values

Lesion Characterization
ADC values for each subgroup of lesions are reported in Figure 4. Among benign lesions both HE and FNH subgroup showed mean ADC significantly (P < 0.05) higher than that of all malignant subgroups. HA subgroup presented mean ADC values significantly lower than HE; besides, a significant difference was also found between HA and the metastases subgroup. No significant differences in mean ADC were demonstrated among various metastases, CC, and HCC subgroups.
FIGURE 4.
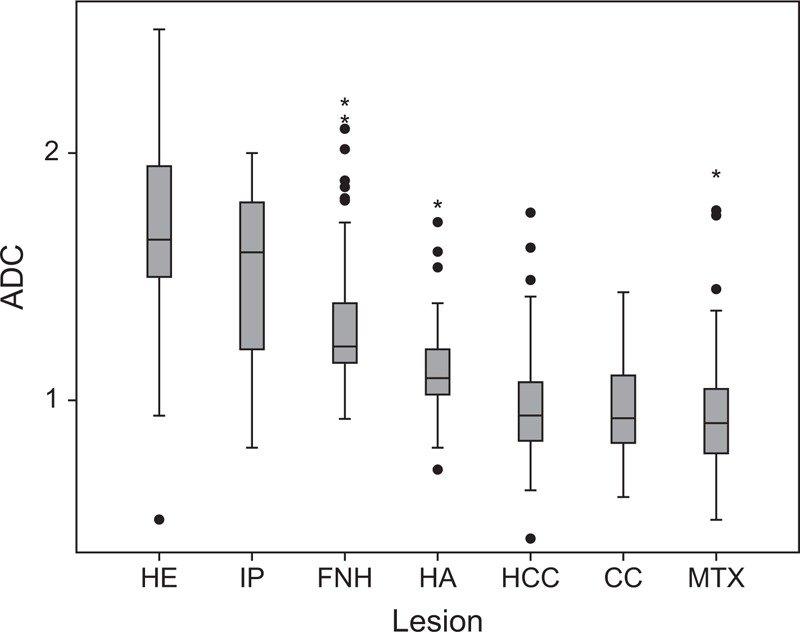
Characterization. Box and whisker plots, respectively, of ADC values for each subgroup of lesions. The horizontal line in each box is the median of measured values. HE and FNH subgroups showed mean ADC significantly (P < 0.05) lower than all malignant subgroups. No significant differences in mean ADC were demonstrated among metastases, CC, and HCC subgroups. ADC = apparent diffusion coefficient, CC = cholangiocarcinoma, FNH = focal nodular hyperplasias, HA = hepatic adenomas, HCC = hepatocellular carcinoma, HE = hemangiomas, IP = in phase, MTX = metastases.
DISCUSSION
Our study demonstrates that ADC quantification can help to correctly classify a noncystic FLL as benign or malignant in about half the cases.
Many papers described an attempt to discriminate malignant from benign lesions and to characterize them by the means of ADC value.5–10 However, most of them presented low statistical power due to the limited sample of lesion analyzed, also including in the analysis lesions such as cysts and abscesses,6–10 which usually may be quite confidently diagnosed by the use of conventional MR sequences and/or clinical statement of the patient and do not cause many problems in differential diagnosis. In addition, cystic lesions can alter the group analysis results by increasing differences in ADC value between benign and malignant lesions.
Our analysis (with exclusion of necrotic areas in ADC) presented good results in terms of statistically significant differences in ADC values between malignant and benign FLLs. Also sensitivity and specificity for the above-described cutoff values are quite good (Table 3).
In our opinion the best diagnostic performance in clinical routine would be obtainable by applying a cutoff value of 1.066 × 10⁻³ mm2/s, resulting in a specificity and sensitivity for malignancy of 86.6% and 76.3%, respectively, although a wide overlap was present between the groups, confirming the data of several previous papers.5–10 To better comprehend the extension of this “gray area” and to evaluate the effective range of clinical application of ADC, we did not apply a single cutoff value, but we divided all ADC values into 3 sets (respectively, <1.0, from 1.0 to 1.5, >1.5 × 10⁻³ mm2/s) (Table 4). Indeed, we can see that >1/3 (39.5%) presented values <1 × 10⁻³ mm2/s, with a 90% chance of malignancy. Most of the lesions (42.7%) presented ADC values ranging from 1.0 to 1.5 × 10⁻³ mm2/s and even if the larger part of them resulted in being benign (56.7%), chances to recognize a malignant lesion from a benign one are tough in such a range. Above 1.5 × 10⁻³ mm2/s (17.8%) we can classify a lesion as benign, having 9.5% chances of malignancy. Summarizing, ADC cannot help in classification of about 43% of all lesions because of the overlap between values, but in the remaining cases (more than 50%) ADC measurement should be considered reliable in differentiating benign from malignant lesions. With respect to surrounding parenchyma, when a FLL is iso-hypointense on DwI and presents ADC value <1 × 10⁻³ mm2/s, it will be most likely malignant; if a FLL is iso-hyperintense on DwI and presents ADC value >1.5 × 10⁻³ mm2/s, it will be very likely benign.
Our results in terms of lesion characterization were poor; however, we found statistically significant (P < 0.05) differences in mean ADC values among benign subgroups and malignant ones, with the exceptions of HA and inflammatory pseudotumors. Within the benign nodules, HA subgroup presented mean ADC values significantly lower than HE and there was a significant difference between HA and metastases subgroup, while no significant differences in mean ADC were demonstrated among various malignancy subgroups.
In our statistical analyses we chose not to include the single case of primitive liver lymphoma because of its single entity. However, it showed very low ADC value (0.890 × 10⁻³ mm2/s) as theoretically expected because of very dense cellularity and high diffusion restriction. It is a very rare diagnosis, difficult to find in everyday practice and even literature reports only few cases28,29: further analysis is needed based on larger number of case studies to confirm such low ADC values.
The design of our study was simple and both the used Dw image acquisition and the mean ADC were potentially feasible in clinical routine. It should be underlined that b = 0 s/mm2 images were not acquired in our multi-b Dw protocol. The selection of a low b-value >0 s/mm2 provides suppression of large vessels increasing lesion detection rate and, consequently, reproducibility of ROI positioning. Moreover, calculation of ADC value can be more accurate when starting with b value = 50–100 s/mm2, because of reduction of perfusion influence on Dw signal.30 We did not consider fitted ADC and intravoxel incoherent motion (IVIM) theory, because of the retrospective nature of this study; however, these results are not dissimilar from those presented in another of our recent works (prospective and based on IVIM theory parameters and fitted ADC).31 When including b = 0 s/mm2 images in ADC, these values could be slightly higher (probably around 10%), because of the larger contribution of perfusional IVIM in ADC.
In addition, our aim was to investigate the option in using ADC measurement as a supplemental parameter in clinical practice so that any time-consuming method in acquisition or postprocessing would have not been appropriate. Furthermore, an important point in our study was the number of included lesions, large enough to draw accurate statistical conclusions and this is confirmed by narrow AUCs 95% Confidence Intervals in ROC analysis (never >0.08).
Our study has three major limitations: first, it was a retrospective study so selection biases cannot be excluded and an overestimation of DwI accuracy in FLL classification and characterization is likely present, although not critical31; second, during acquisition of Dw images cardiac motion artifacts and noise contamination might have distorted ADC values to a certain degree, in particular those of lesions located on the left lobe; third, both the ROI drawing and positioning on ADC map were highly operator-dependent so problems with reproducibility of the method should be considered.
In conclusion, our experience confirms that DwI cannot assist radiologists in the characterization of FLLs, however it can help them in the classification of more than half the cases of noncystic FLLs. In addition, an ADC value found to be <1 × 10⁻³ mm2/s (ie, in about 40% of the cases) represents a strong hint of malignancy.
Footnotes
Abbreviations: DwI = diffusion-weighted imaging, FLL = focal liver lesion.
During the past 2 years, the University Department which Professor Colagrande is affiliated with has received grants, loans, and has entered into agreements with various carriers of commercial interests in the healthcare field: Bayer, Bracco, Novartis, Sanofi Aventis, and Eli Lilly.
The authors have no conflicts of interest to disclose.
References
- 1.Kele PG, van der Jagt EJ. Diffusion weighted imaging in the liver. World J Gastroenterol. 2010; 16:1567–1576. [DOI] [PMC free article] [PubMed] [Google Scholar]
- 2.Thomas DL, Lythgoe MF, Pell GS, et al. The measurement of diffusion and perfusion in biological systems using magnetic resonance imaging. Phys Med Biol. 2000; 45:97–138. [DOI] [PubMed] [Google Scholar]
- 3.Bilgili MY. Reproductibility of apparent diffusion coefficients measurements in diffusion-weighted MRI of the abdomen with different b values. Eur J Radiol. 2012; 81:2066–2068. [DOI] [PubMed] [Google Scholar]
- 4.Taouli B. Diffusion-weighted imaging for liver lesion characterization: a critical look. Radiology. 2012; 262:378–380. [DOI] [PubMed] [Google Scholar]
- 5.Bruegel M, Holzapfel K, Gaa J, et al. Characterization of focal liver lesions by ADC measurements using a respiratory triggered diffusion-weighted single-shot echo-planar imaging technique. Eur Radiol. 2008; 18:477–485. [DOI] [PubMed] [Google Scholar]
- 6.Taouli B, Vilgrain V, Dumont E, et al. Evaluation of liver diffusion isotropy and characterization of focal hepatic lesions with two single-shot echo-planar imaging sequences: prospective study in 66 patients. Radiology. 2003; 226:71–78. [DOI] [PubMed] [Google Scholar]
- 7.Onur MR, Çiçekçi M, Kayalı A, et al. The role of ADC measurement in differential diagnosis of focal hepatic lesions. Eur J Radiol. 2012; 81:171–176. [DOI] [PubMed] [Google Scholar]
- 8.Miller FH, Hammond N, Siddiqi AJ, et al. Utility of diffusion-weighted MRI in distinguishing benign and malignant hepatic lesions. J Magn Reson Imaging. 2010; 32:138–147. [DOI] [PubMed] [Google Scholar]
- 9.Gourtsoyianni S, Papanikolaou N, Yarmenitis S, et al. Respiratory gated diffusion-weighted imaging of the liver: value of apparent diffusion coefficient measurements in the differentiation between most commonly encountered benign and malignant focal liver lesions. Eur Radiol. 2008; 18:486–492. [DOI] [PubMed] [Google Scholar]
- 10.Filipe JP, Curvo-Semedo L, Casalta-Lopes J, et al. Diffusion-weighted imaging of the liver: usefulness of ADC values in the differential diagnosis of focal lesions and effect of ROI methods on ADC measurements. MAGMA. 2013; 26:303–312. [DOI] [PubMed] [Google Scholar]
- 11.Agrawal S, Khurana J, Sahu M. Hemorrhagic liver cyst. J Gastrointest Surg. 2012; 16:1629–1631. [DOI] [PubMed] [Google Scholar]
- 12.Vilgrain V, Boulos L, Vullierme MP, et al. Imaging of atypical hemangiomas of the liver with pathologic correlation. Radiographics. 2000; 20:379–397. [DOI] [PubMed] [Google Scholar]
- 13.Elsayes KM, Narra VR, Yin Y, et al. Focal hepatic lesions: diagnostic value of enhancement pattern approach with contrast-enhanced 3D gradient-echo imaging. Radiographics. 2005; 25:1299–1320. [DOI] [PubMed] [Google Scholar]
- 14.Terkivatan T, van den Bos IC, Hussain SM, et al. Focal nodular hyperplasia: lesion characteristics on state-of-the-art MRI including dynamic gadolinium-enhanced and superparamagnetic iron-oxide-uptake sequences in a prospective study. J Magn Reson Imaging. 2006; 24:864–872. [DOI] [PubMed] [Google Scholar]
- 15.Hussain SM, Zondervan PE, IJzermans JN, et al. Benign versus malignant hepatic nodules: imaging findings with pathologic correlation. Radiographics. 2002; 22:1023–1036. [DOI] [PubMed] [Google Scholar]
- 16.Grazioli L, Bondioni MP, Haradome H, et al. Hepatocellular adenoma and focal nodular hyperplasia: value of gadoxetic acid-enhanced imaging in differential diagnosis. Radiology. 2012; 262:520–529. [DOI] [PubMed] [Google Scholar]
- 17.Silva AC, Evans JM, McCullough AE, et al. MR imaging of hypervascular liver masses: a review of current techniques. Radiographics. 2009; 29:385–402. [DOI] [PubMed] [Google Scholar]
- 18.Balci NC, Sirvanci M. MR imaging of infective liver lesions. Magn Reson Imaging Clin N Am. 2002; 10:121–135. [DOI] [PubMed] [Google Scholar]
- 19.Prasad SR, Wang H, Rosas H, et al. Fat-containing lesions of the liver: radiologic-pathologic correlation. Radiographics. 2005; 25:321–331. [DOI] [PubMed] [Google Scholar]
- 20.Haradome H, Grazioli L, Al manea K, et al. Gadoxetic acid disodium-enhanced hepatocyte phase MRI: can increasing the flip angle improve focal liver lesion detection? Magn Reson Imaging. 2012; 35:132–139. [DOI] [PubMed] [Google Scholar]
- 21.Xu LH, Cai SJ, Cai GX, et al. Imaging diagnosis of colorectal liver metastases. World J Gastroenterol. 2011; 17:4654–4659. [DOI] [PMC free article] [PubMed] [Google Scholar]
- 22.Balduzzi C, Yantorno M, Mosca I, et al. Primary hepatic lymphoma: an infrequent cause of focal hepatic lesion. Acta Gastroenterol Latinoam. 2010; 40:361–366. [PubMed] [Google Scholar]
- 23.Beaty SD, Silva AC, Depetris G. AJR teaching file: incidental hepatic mass. Am J Roentgenol. 2008; 190:S62–S64. [DOI] [PubMed] [Google Scholar]
- 24.Bruix J, Sherman M, Practical Guidelines Committee, American Association for the Study of Liver Disease. Management of hepatocellular carcinoma. Hepatology. 2005; 42:1208–1236. [DOI] [PubMed] [Google Scholar]
- 25.Colagrande S, Pasquinelli F, Mazzoni LN, et al. MR-diffusion weighted imaging of healthy liver parenchyma: repeatability and reproducibility of apparent diffusion coefficient measurement. J Magn Reson Imaging. 2010; 31:912–920. [DOI] [PubMed] [Google Scholar]
- 26.Yamada I, Aung W, Himeno Y, et al. Diffusion coefficients in abdominal organs and hepatic lesions: evaluation with intravoxel incoherent motion echo-planar imaging. Radiology. 1999; 210:617–623. [DOI] [PubMed] [Google Scholar]
- 27.Amano Y, Kumazaki T, Ishihara M. Single-shot diffusion-weighted echo-planar imaging of normal and cirrhotic livers using a phased-array multicoil. Acta Radiol. 1998; 39:440–442. [DOI] [PubMed] [Google Scholar]
- 28.Abthony PP, Sarsfield P, Clarke T. Primary lymphoma of the liver: clinical and pathologic features of 10 patients. J Clin Pathol. 1990; 43:1007–1013. [DOI] [PMC free article] [PubMed] [Google Scholar]
- 29.Bilaj F, Berdica L, Dhima A, et al. Magnetic resonance imaging findings in primary lymphoma of the liver: a case report. J Med Case Rep. 2012; 6:282. [DOI] [PMC free article] [PubMed] [Google Scholar]
- 30.Guiu B, Cercueil JP. Liver diffusion-weighted MR imaging: the tower of Babel? Eur Radiol. 2011; 21:463–467. [DOI] [PubMed] [Google Scholar]
- 31.Colagrande S, Regini F, Pasquinelli F, et al. Focal liver lesion classification and characterization in non cirrhotic liver: a prospective comparison of Dw-MRI related parameters. J Comput Assist Tomogr. 2013; 37:560–567. [DOI] [PubMed] [Google Scholar]


